Uster unevenness data usually arrives as a single number per lot, read after the fact as a pass or fail against a customer specification. What it rarely shows on its own is the trend leading up to that number, or which machine setting or raw material change actually caused unevenness to drift before the test ever flagged a problem. Spinning mills that want their own unevenness trends connected to specific causes can review an unevenness trend dashboard against their own test history with iFactory AI.
A Single Uster Number Doesn't Show You the Drift That Led to It
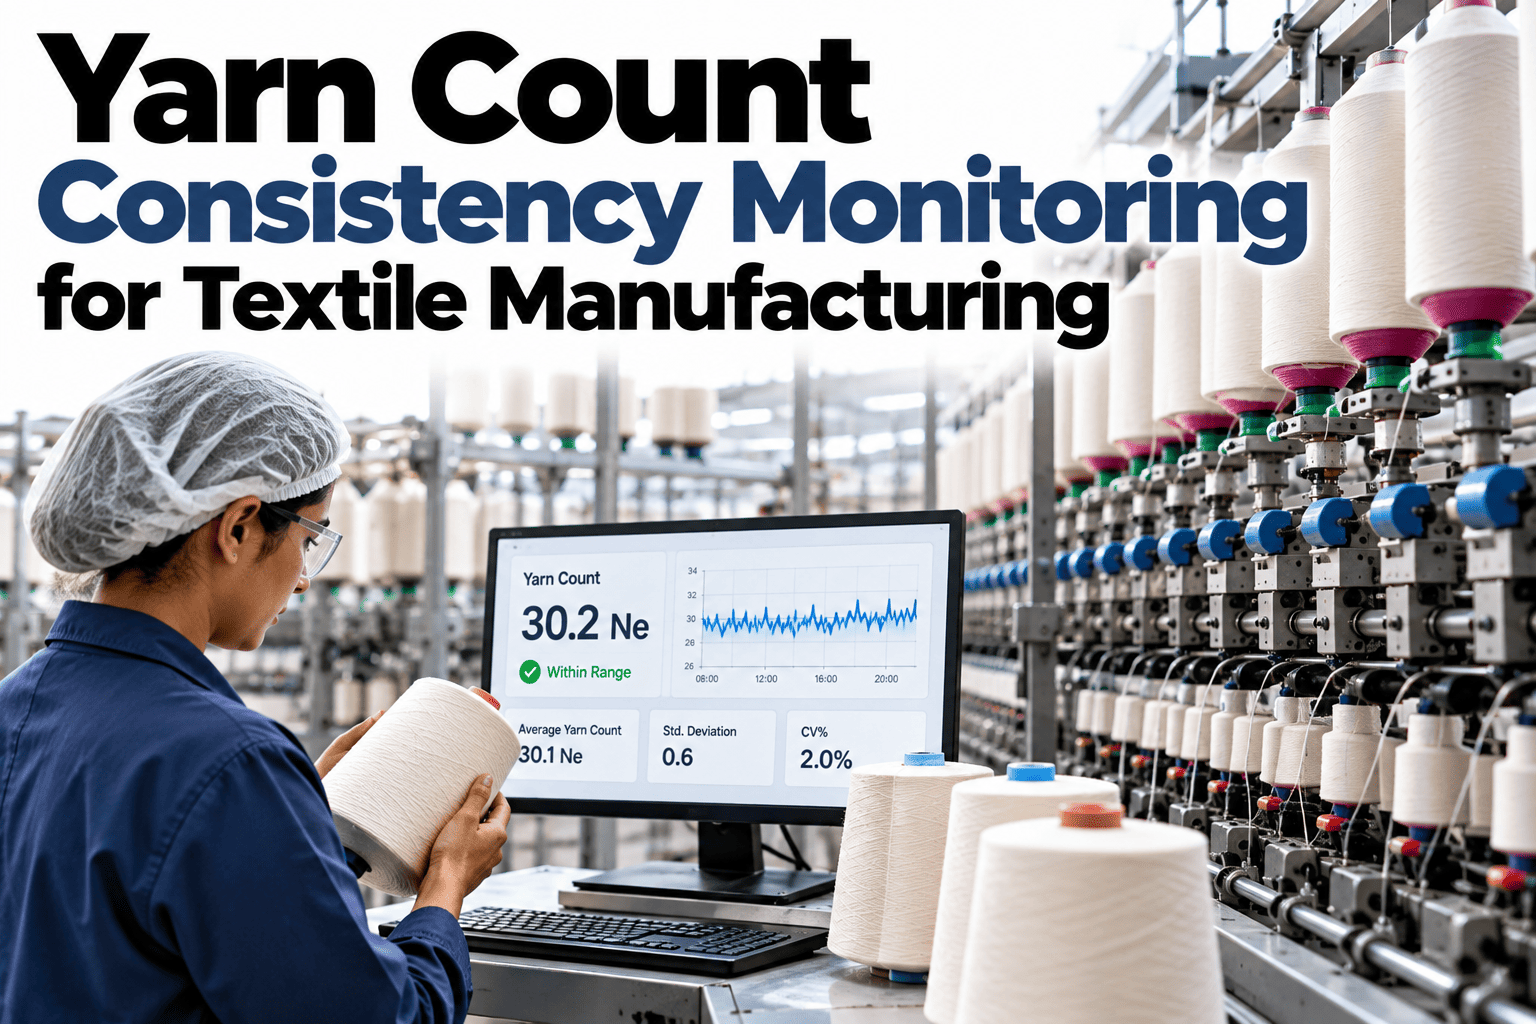
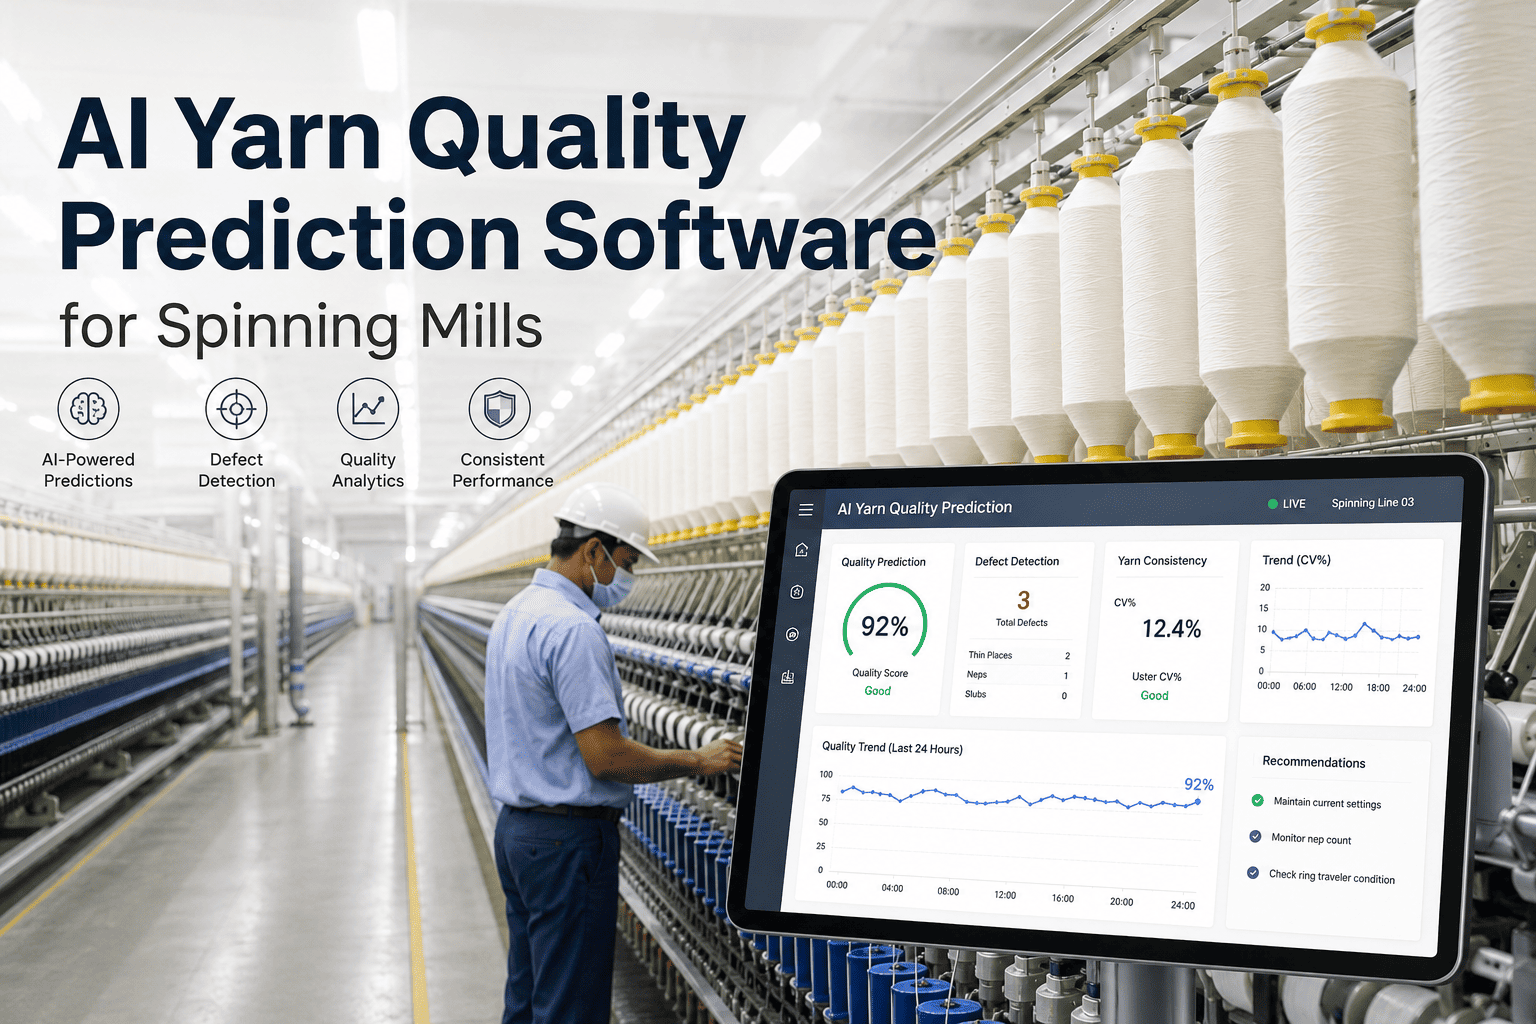
iFactory AI tracks unevenness trends continuously and correlates changes with machine settings and raw material shifts, catching drift before it becomes a failed test.
Why a Single Test Result Hides the Trend That Matters
A lot that passes its unevenness test today might be drifting steadily worse lot over lot, a trend invisible if each test is reviewed only in isolation against a pass/fail threshold.
Correlating Drift With Its Likely Cause
| Drift pattern | Common correlated cause |
|---|---|
| Gradual increase across lots | Roller or apron wear developing over time |
| Sudden jump at a specific lot | A raw material or blend change |
| Shift-specific pattern | A setting difference between shift handovers |
See Your Own Unevenness Trend, Not Just the Latest Test
Share recent Uster test history and a short session will show the trend leading up to your most recent results.
A Composite Scenario: The Drift That Took Six Lots to Fail
A mill's unevenness results had been creeping upward across six consecutive lots, each one still passing the customer specification individually, so nothing triggered a review until the seventh lot finally failed. Tracing the trend back showed a roller had been gradually wearing over exactly that period, a pattern that would have been visible as a clear drift if lots were reviewed together rather than one at a time. Catching the drift at lot three or four, rather than waiting for an outright failure, would have avoided the rework and customer delay the eventual failure caused — a trend view iFactory AI's team can help build from your own test history.
Why Shift-Level Correlation Matters on a 24-Hour Operation
A mill running continuous shifts can develop subtle differences in settings or handling between crews, and a drift pattern that correlates with a specific shift rather than a machine or material change points toward a training or standardization gap rather than an equipment issue — a distinction that matters for choosing the right fix.
Frequently Asked Questions
Catch the Drift Before It Becomes a Failed Test
iFactory AI tracks unevenness trends across lots and correlates drift with likely causes. Book a walkthrough with your own Uster test history.