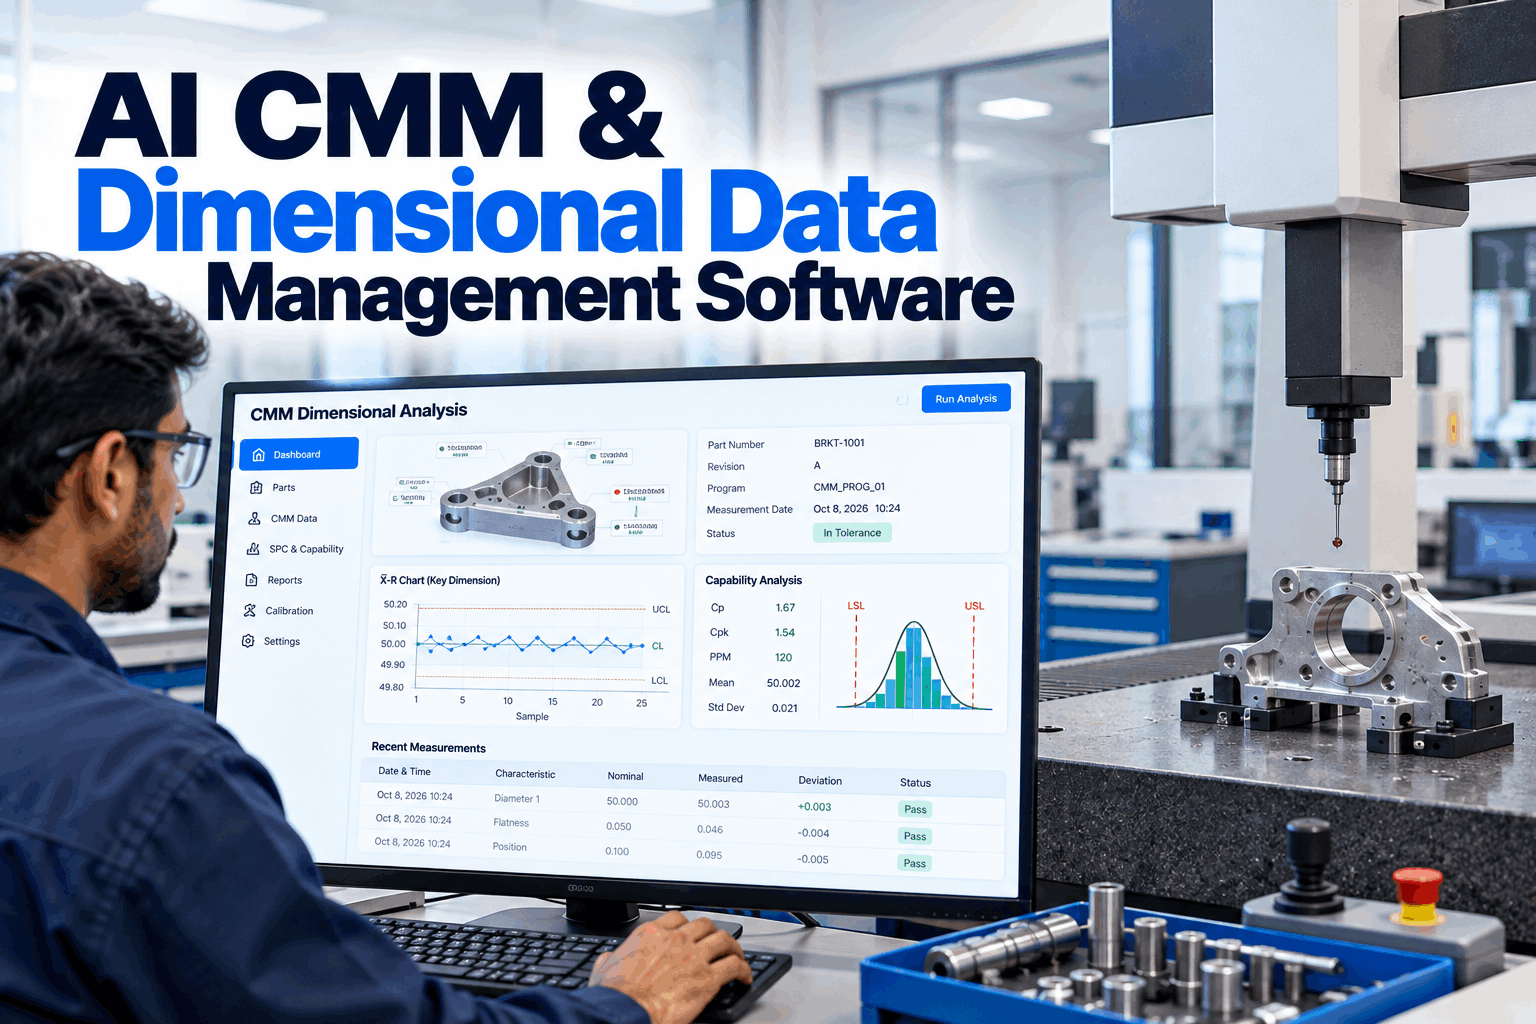
Most plants measure far more than they analyse. Every shift, CMMs, height gauges, bore gauges and vision systems produce thousands of dimensional results, and most of them end up as PDF reports in a shared folder. The results pass, so nobody looks again until a feature creeping towards its limit finally fails and a batch is quarantined. AI CMM and dimensional data management software collects results from every measuring device, runs SPC and capability for each feature automatically and flags drift while parts are still good. Start with a dimensional data review.
AI CMM and Dimensional Data Management Software
Every CMM, gauge and vision result in one database, mapped to drawing characteristics. SPC and capability run on every feature, and drift is caught before parts go out of tolerance.
- Why CMM reports hide drift
- Collecting and mapping data from every device
- Automatic SPC, capability and drift alerts
Why CMM Reports Hide Drift
A pass on today's report says nothing about where the process is heading.
CMM software is very good at measuring a part and saying whether each feature passes. It is less good at showing what has happened to that feature over the last hundred parts, across several machines and shifts. Results are often stored as separate reports, in different formats for each CMM brand, and hand-gauge readings live on paper. Spotting a trend means exporting, copying and charting by hand, so it rarely happens until something fails. Meanwhile quality engineers spend hours each week moving data between files instead of using it to improve the process. Our metrology specialists can review how your data flows today.
Report silos
Each CMM writes its own report format.
Paper gauges
Hand-gauge readings never reach a chart.
Manual SPC
Charts built in spreadsheets, if at all.
Late discovery
Drift found only when a part fails.
Collecting Data From Every Measuring Device
One database for all dimensional results, whatever measured them.
Dimensional data comes from many sources on the same shop floor. The software reads each one in its own format and stores the results in one structure, linked to the part, characteristic, machine, operation and time. Once data arrives automatically, inspectors no longer need to retype readings, and reports are produced from the same source every time. Standard formats help: the Quality Information Framework, published as ISO 23952, was designed to carry quality measurement data between systems, and many CMM packages also export DMIS or structured text. Map your devices with our integration team.
Give every measured feature a characteristic ID that matches the ballooned drawing and the control plan. When CMM programs, gauges and reports all use the same IDs, results from different devices for the same feature land on the same chart.
Automatic SPC and Capability for Every Feature
No exports, no spreadsheets, no waiting for a monthly report.
As each result arrives, the software adds it to the right control chart and recalculates capability for that feature. Control chart rules, such as points outside limits or runs of points moving in one direction, are checked automatically. Capability indices such as Cp and Cpk show how comfortably each feature fits its tolerance. A capability summary across all features of a part shows at a glance which characteristics are healthy and which need attention, so engineers spend their time where it matters. Set up chart rules with our quality team.
Catching Drift While Parts Are Still Good
The best time to act is before the first bad part.
Most dimensional drift has a physical cause: tool wear, thermal growth, fixture wear, a changed setting or a new material lot. The AI watches every feature's trend, applies your control chart rules and links alerts to the operation and machine that made the feature. Because many features share a tool or fixture, it can also spot when several features move together. Alerts go to the right people by cell and operation, with the chart, the likely cause and the parts affected, so the response starts with facts rather than a search. Review your alert rules in a working session.
Tool wear
Steady trend on features cut by one tool.
Thermal growth
Shift after start-up or with shop temperature.
Fixture wear
Related features drifting together.
Step change
Sudden shift after a setup or material change.
Turn Measurements Into Early Warnings
Every CMM and gauge result charted the moment it is taken, with drift caught while parts are still in tolerance.
Trust the Measurement Before the Trend
A drifting chart can mean a drifting process or a drifting gauge.
Before acting on a trend, it helps to know the measuring system is sound. CMM performance is commonly verified to the ISO 10360 series, and gauge studies such as repeatability and reproducibility show how much of the variation comes from measurement. The software stores CMM verification records and gauge study results with each device, and warns when a result comes from a device that is due for verification. When two CMMs measure the same feature, it can compare them on shared parts and flag a growing offset between them. Discuss measurement systems with our metrology team.
Measurement checks held
- CMM verification dates and results
- Gauge calibration status
- Gauge R and R studies by feature
- Probe qualification records
Warnings raised
- Results from overdue devices
- Features with poor gauge studies
- Sudden shifts after probe changes
- Differences between two CMMs on one feature
Comparing Machines, Fixtures and Shifts
The same feature made in different places tells you where variation comes from.
When results carry the machine, fixture, spindle, cavity or shift that produced them, the software can split each feature's data and compare. One machine with a wider spread, one fixture position that runs offset or one shift that sets up differently becomes obvious in a single chart. That turns long arguments about whose machine is at fault into a quick look at the data, and points the fix at the source instead of the symptom. Explore comparisons with our process team.
Machine to machine
Same part, same feature, different machines.
Fixture positions
Offsets between nests or pallets.
Mould cavities
Cavity-to-cavity variation for moulded parts.
Setups and crews
Differences after setup or by shift.
First Article, Incoming and Final Inspection
The same database serves every inspection stage.
Dimensional data is not only for production SPC. First article inspections, incoming checks on supplier parts and final inspection all produce results against the same drawing characteristics. Keeping them in one place lets quality teams compare supplier parts with in-house parts, check that a first article matches later production and produce inspection records quickly. Where a feature has shown strong capability over time, the data supports a case for lighter inspection, freeing CMM time for the features that need it. Plan inspection stages with our quality team.
Inspection stages covered
- First article inspection by characteristic
- Incoming inspection of supplier parts
- In-process checks at the machine
- Final inspection before shipping
What it makes easy
- Supplier capability by feature
- First article against later production
- Inspection records for customers
- Reduced inspection where capability is proven
From Alert to Action
The alert should tell the operator what to check first.
A drift alert is most useful when it reaches the right person with the right context. The exchange below shows how a quality engineer uses it to decide on a tool change. Questions on alert routing go to our implementation team.
Dimensional Data Mistakes to Avoid
More measurements do not help if nobody can see the trend.
These are common problems in dimensional data programs. A short readiness review can find them.
What works
- One characteristic ID per drawing feature
- Automatic capture from every device
- Control rules, not just tolerance checks
- Gauge and CMM status linked to results
What fails
- PDF reports as the only record
- Different feature names on each CMM
- Capability calculated once a year
- Reacting only when a part fails
How iFactory Runs Dimensional Data Management
Measurement and Calibration, on your own network.
iFactory collects CMM, gauge and vision results, maps them to drawing characteristics, runs SPC and capability for every feature, links measurement system status and raises drift alerts with likely causes. It runs on an on-prem AI server inside your plant. Fit questions go to our solutions team.
Device integration
CMMs, gauges and vision systems.
Characteristic mapping
Results tied to drawing features.
Automatic SPC
Charts and capability per feature.
Drift alerts
Rule-based alerts with likely causes.
Calibration status
Device verification linked to results.
Reports
Capability and inspection reports on demand.
Results depend on your parts, devices and data quality. We measure drift alerts, response time and capability on your own data during the pilot, rather than promising a general figure.
Turnkey AI: Delivered, Connected and Live in 6–12 Weeks
You do not build this. It arrives ready.
iFactory ships as a pre-configured NVIDIA AI server with the software pre-loaded, racked and ready. Rack it, plug in power and Ethernet, and the AI is live on your network. Our team handles cabling, network setup, PLC, SCADA, DCS and CMMS integration, CMM and gauge links, operator training and 24×7 remote monitoring. Data stays on your network. For a scope matched to your plant, request a turnkey quote.
Ship, network and data
Server installed. CMMs, gauges and vision systems connected. Characteristics mapped.
Model training and pilot
Control rules and alerts tuned on one cell or part family.
Go-live and training
Dimensional analytics live. Quality and production trained. 24×7 monitoring begins.
Frequently Asked Questions
What is CMM and dimensional data management software?
Software that collects measurement results from CMMs, gauges and vision systems into one database, maps them to drawing features and runs SPC and capability automatically.
Which CMM formats can it read?
Common outputs such as QIF, DMIS results and structured vendor report files. We confirm each of your CMMs during scoping.
Can it include hand-gauge readings?
Yes. Digital gauges can send readings directly, and manual checks can be entered at the station.
How does it catch drift early?
It applies control chart rules to every feature and tracks capability, so a trend towards a limit is flagged while parts are still in tolerance.
What is Cpk?
A capability index showing how well a feature fits within its tolerance, based on its mean and spread. It is the smaller of the distances to each limit divided by three standard deviations.
Does it track CMM verification?
Yes. Verification and calibration records are held with each device, and results from overdue devices are flagged.
Can it compare machines or fixtures?
Yes. When results carry the machine, fixture, cavity or shift, each feature can be split and compared to find where variation comes from.
Where is the data stored?
On the on-prem server inside your plant, linked to parts, lots and machines.
How do we start?
Start with one cell or part family and its CMM and gauges. A 6-week pilot connects devices, maps features and turns on alerts. To plan it, contact our team.
See Every Feature, Every Trend
In thirty minutes we look at your CMM reports and gauge data for one part, and show what automatic trending would reveal. You keep the notes either way.
- 1CMM reports for one part
- 2The ballooned drawing
- 3Your CMM brands and software
- 4Gauge list and calibration records
- 5One dimensional failure that surprised you