A dam doesn't fail on the day it fails. It fails months earlier, when a hairline crack propagates a fraction of a millimeter deeper into the downstream face, when a seepage plume warms a patch of vegetation the rope-access inspector couldn't reach, when a piping pathway starts moving fines through the embankment core. The June 2024 Rapidan Dam breach and every FERC after-action report since tells the same story: the signals were present in the structure long before the water came over the abutment. Traditional inspection sees the surface. AI drone inspection sees the developing failure — every crack width measured in millimeters, every thermal anomaly mapped to a coordinate, every vegetation stress pattern flagged against a trained seepage signature. Dam owners running FERC Part 12 programs, USACE levee coordination, and state dam safety compliance use iFactory's dam inspection engineering team to build the imagery, defect library, and CMMS integration into a defensible Part 12D evidence record.
Dam Safety · Levee Assessment · FERC Compliant
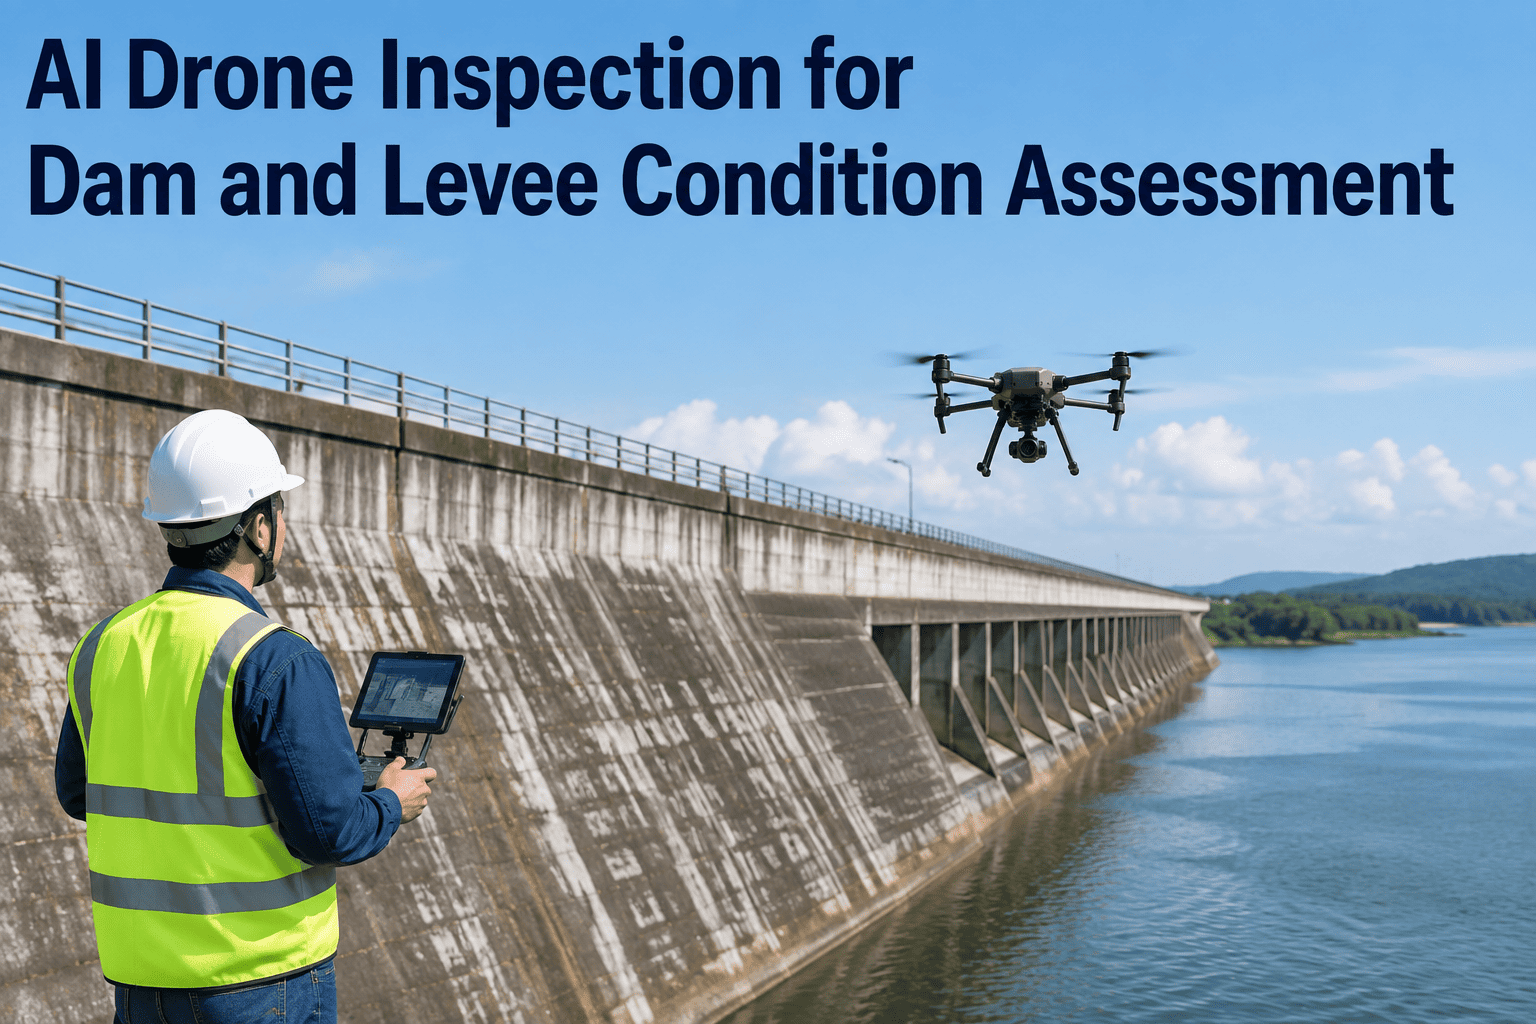
AI Drone Inspection for Dam and Levee Condition Assessment
Map concrete deterioration on dam faces, seepage indicators through levee embankments, and vegetation growth patterns that reveal internal erosion — all before the next FERC Part 12 inspection cycle. Repeatable RTK flight paths compare millimeter-level change against the last flight, and every finding lands as visual evidence in the compliance record.
vs. 40–60% typical manual inspection coverage
The Stakes Beneath The Water Line
Why Dam and Levee Inspection Cannot Rely On Line-Of-Sight Alone
The Federal Energy Regulatory Commission finalized a two-tier inspection structure in recent years, retaining the five-year independent consultant safety inspection cycle but alternating those inspections between a periodic inspection and a deeper comprehensive assessment. That comprehensive assessment requires a detailed review of design, engineering analyses, construction history, spillway adequacy evaluation, and a formal risk analysis — all of which lean heavily on evidence-quality condition data that a walking inspection physically cannot produce across a dam's full geometry.
The failure modes that actually breach dams and levees are the ones that develop where inspectors can't easily walk. Consider a fifty-year-old earthen dam after intense rainfall: the spillway is inaccessible on foot, the downstream face is heavily vegetated, and the inspection crew can only visually assess the crest and reachable slopes. Two weeks later a deep-seated structural void the surface never revealed collapses, and the reservoir is running downhill through the abutment. Every dam safety after-action report reads some version of that story. The gap between what a manual inspection sees and what a dam actually contains is the gap that AI drone inspection was built to close.
Levees compound the problem. The United States has tens of thousands of miles of federal and non-federal levees, and internal erosion driven by seepage is the most frequent and destructive mechanism of levee failure. Under hydraulic gradient, river water carries fine soil particles from the water side to the land side, hollowing the levee body until a breach is inevitable. The visible surface signals of that process — vegetation stress from cool wet zones, subtle temperature differentials, small piping outlets on the landside toe — are exactly the signals that thermal-equipped drones catch and AI segmentation quantifies. Manual inspection walks past those signals unless the inspector is standing directly on them at the right time of day.
The Failure Mode Map
Every Dam and Levee Failure Signature The AI Is Trained To Catch
Dam and levee failures cluster into a well-understood taxonomy of failure modes, each with its own signature and its own sensor pathway. The nine modes below cover the overwhelming majority of documented dam and levee incidents in North American infrastructure — and each one is a mode modern AI drone inspection is trained to detect against annotated field data.
Concrete Dam Failure Signatures
C1
Concrete Cracking & Spalling
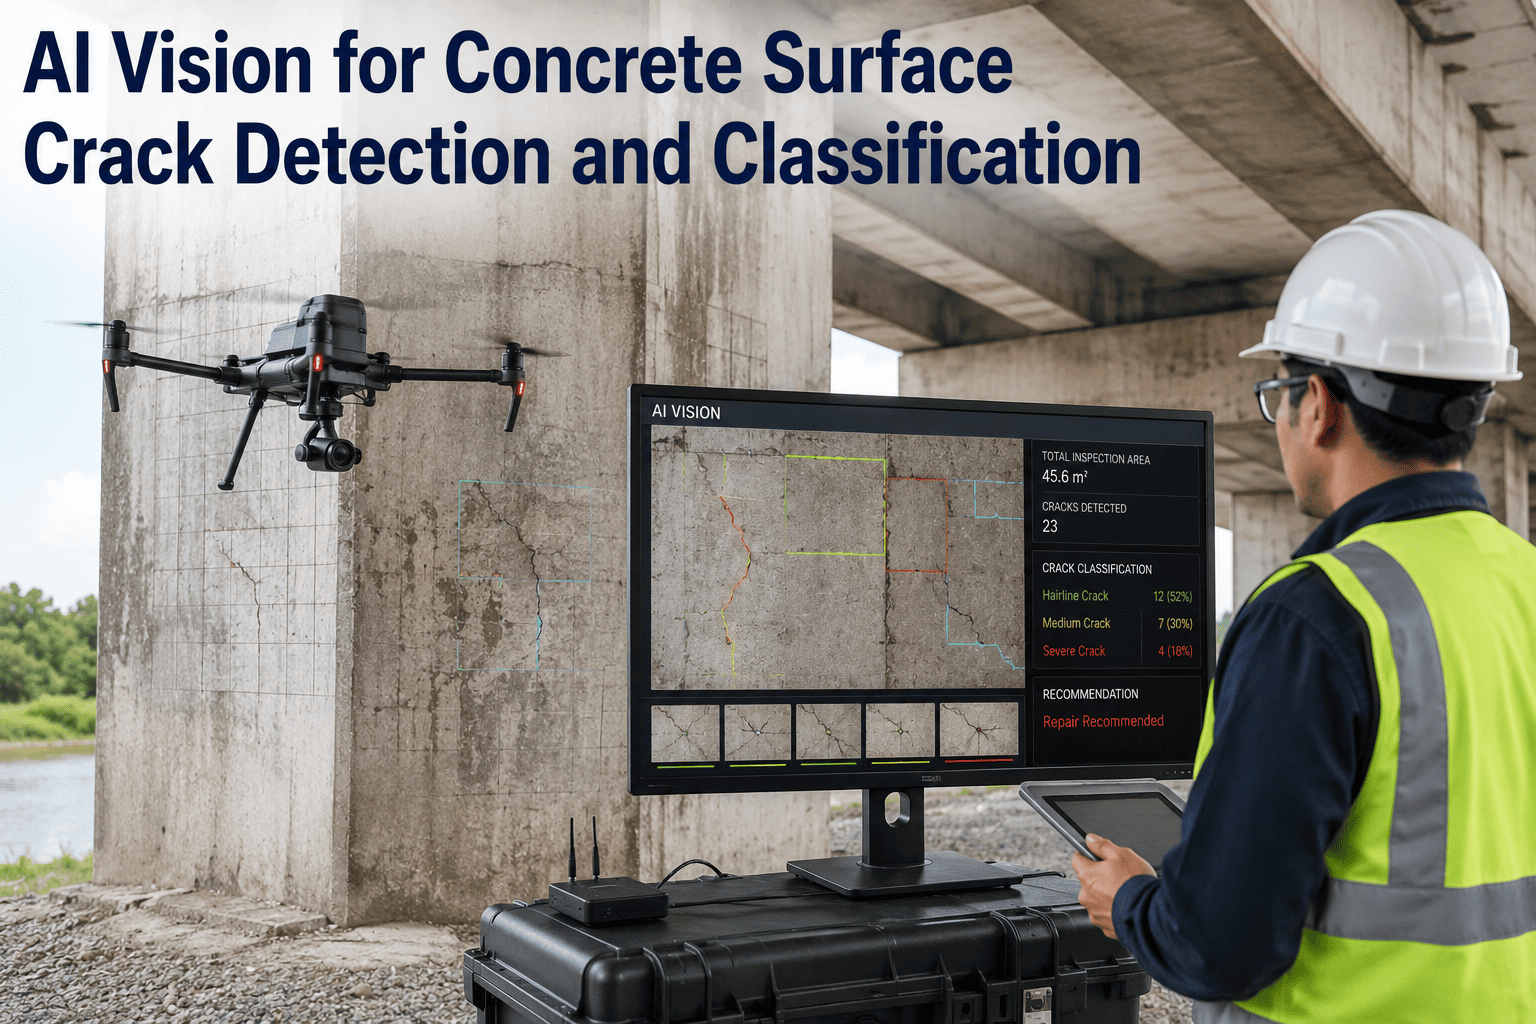
Hairline through structural cracks on downstream face, spalled concrete exposing reinforcement, and freeze-thaw damage on crest surfaces. AI measures crack width to sub-millimeter precision from repeat flights.
C2
Efflorescence & Calcite Deposits
Mineral leaching through the concrete indicates water pathways through the dam body. Trained models distinguish active efflorescence from historical staining, prioritizing the active zones for engineering review.
C3
Spillway Chute Erosion
Cavitation damage, joint erosion, and slab uplift on high-velocity spillway surfaces. Photogrammetric reconstruction quantifies depth of erosion pockets that visual inspection can only estimate qualitatively.
C4
Gate & Trunnion Deterioration
Corrosion on radial gates, trunnion pin wear indicators, and seal deterioration at gate perimeters. High-resolution close-approach photography captures detail engineers previously needed rope access to see.
Embankment & Levee Failure Signatures
E1
Seepage & Piping Outlets
Thermal imaging catches the temperature differential between seeping water and surrounding earth. Semantic segmentation identifies piping outlets on the landside toe — the earliest visible signal of internal erosion.
E2
Vegetation Stress Patterns
Multispectral analysis flags vegetation stress that reveals saturation, seepage plumes, or slope instability underneath. Absence of vegetation on embankment slopes signals cracks, burrows, or erosion pathways.
E3
Slope Erosion & Rilling
Wave erosion on upstream slopes, rain rilling on downstream faces, and toe erosion at the embankment-foundation interface. LiDAR change detection quantifies material loss between flight cycles in cubic meters.
E4
Settlement & Deformation
RTK-corrected photogrammetry detects millimeter-scale crest settlement and lateral deformation between flight cycles. Trended settlement rates feed directly into risk analysis for FERC comprehensive assessment.
E5
Animal Burrows & Encroachment
Rodent burrows, tree root intrusion, and unauthorized encroachment on levee crown or slopes. Every disturbance is a potential seepage pathway during high water, and AI catches them across levee miles in a single flight.
Hazard-Tiered Inspection Frequency
Matching Drone Inspection Cadence To Hazard Classification
Every dam is classified by its downstream hazard potential — the danger a breach would pose to human life and property. That classification drives regulatory inspection frequency, and it should drive drone inspection cadence too. The pyramid below is the pattern iFactory's engineering team applies when structuring a portfolio-wide dam and levee inspection program under FERC and state dam safety authority requirements.
Tier 1
High Hazard Potential
Probable loss of life on breach. Monthly or quarterly drone inspection cycles, RTK-repeated flight paths for change detection, thermal survey after every major rainfall event, and full annual comprehensive AI defect map. Every inspection lands as evidence in the FERC Part 12D file.
Tier 2
Significant Hazard Potential
Economic loss, environmental damage, or infrastructure disruption on breach. Quarterly to semi-annual drone inspection cycles, thermal and visual survey combined, and formal AI defect trending against baseline every twelve months. Compliance frequency typically five years, drone cadence tighter.
Tier 3
Low Hazard Potential
Minimal expected damage from breach. Annual drone inspection cycles with visual and photogrammetric survey, thermal added if seepage history exists. Drone workflow keeps low-hazard inspection cost sustainable across large owner portfolios that were historically undermanaged.
See The Defect Trending On A Real Concrete Arch Dam
Watch Millimeter-Level Change Detection Against A Two-Year Flight Baseline
Book a walkthrough with iFactory's dam inspection engineering team. See live AI defect segmentation on a real high-hazard concrete arch dam, seepage plume mapping across a levee embankment, and the FERC-ready evidence report drop straight into the compliance file.
The Sensor Stack
What Actually Flies On A Dam Inspection Mission
"AI drone inspection" is shorthand for a coordinated multi-sensor payload, not a single camera. Different failure signatures live in different regions of the electromagnetic spectrum, and different geometries require different flight patterns. The four sensor layers below are the standard payload for a comprehensive dam and levee inspection mission — each catching failure signatures that the others structurally cannot see.
Layer 01
High-Resolution RGB Visual
42–100 megapixel RGB cameras capture surface detail at sub-millimeter ground sample distance from safe standoff. The primary layer for crack detection, spalling, efflorescence, and vegetation classification. Every image GPS-tagged for photogrammetric reconstruction.
Layer 02
Thermal Infrared Imaging
Radiometric thermal cameras catch temperature differentials between seeping water and surrounding earth or concrete. Flown at dawn or dusk when thermal contrast peaks. The primary layer for seepage detection, internal erosion signals, and moisture pathways through concrete.
Layer 03
LiDAR & Photogrammetric 3D
LiDAR point clouds and photogrammetric reconstruction produce a survey-grade 3D model of the entire dam and reservoir geometry. Change detection compares point clouds between flights, quantifying settlement, deformation, and material loss in survey-grade coordinates.
Layer 04
Multispectral Vegetation Analysis
NDVI and near-infrared bands quantify vegetation vigor across levee embankments and dam abutments. Stress patterns invisible to the human eye reveal saturation, seepage, or slope instability signatures — the earliest available signal for internal erosion.
Regulatory Evidence Chain
How Drone Imagery Becomes FERC Part 12 Evidence
A drone flight is only as useful as its ability to survive regulatory scrutiny. FERC's finalized Part 12 rule is explicit about the level of technical rigor required in comprehensive assessments — and the state dam safety programs that mirror it apply the same evidentiary standard. The table below shows how AI drone inspection maps directly to the documentation requirements FERC and state authorities look for during inspection review.
| Regulatory Requirement |
Traditional Documentation |
AI Drone Inspection Evidence |
| Comprehensive Condition Documentation |
Written inspector notes, spot photos |
Full 3D digital twin, orthomosaic per elevation, geotagged defect map |
| Change Detection Between Cycles |
Qualitative — "worse than last inspection" |
Quantitative — millimeter-scale crack growth, cubic meter erosion loss |
| Spillway Adequacy Documentation |
Selective visual inspection where accessible |
Full chute geometry captured, cavitation and erosion measured |
| Seepage & Piping Evidence |
Landside walk during dry conditions |
Thermal survey during peak differential, AI segmentation of outlets |
| Risk Analysis Input Data |
Engineer estimate from field notes |
Quantified defect population, propagation rates, trended over cycles |
| Emergency Action Plan Support |
Pre-event condition assumptions |
Current 3D twin, post-event flight for rapid damage assessment |
| Audit Trail Reproducibility |
Inspector-dependent, notes-based |
RTK flight paths logged, imagery archived, AI classifications versioned |
| Independent Consultant Review |
Consultant re-inspects during site visit |
Consultant reviews imagery and 3D twin remotely, verifies on site |
The shift matters most for the comprehensive assessment tier of Part 12. When an independent consultant is required to conduct a deep review of design assumptions against current condition, having a millimeter-accurate 3D twin and a trended defect population removes ambiguity from the review. The consultant's job becomes evaluating the evidence rather than trying to reconstruct condition from incomplete field notes.
The Flight-to-Filing Timeline
From Mission Planning To Filed Compliance Evidence — What Actually Happens
Dam and levee inspection missions have a predictable shape once the AI drone pipeline is operating. The five phases below are what a real inspection cycle looks like from the point iFactory's team is engaged to the point the certified report lands in the compliance file — and how each phase compresses against traditional inspection timelines.
01
Mission Design & Regulatory Alignment
Dam classification, hazard tier, and applicable regulatory program identified. Flight paths designed for full geometry coverage including spillway, abutments, and downstream face. RTK ground station positioned for centimeter-grade repeatability. FAA Part 107 authorization filed where required for controlled airspace.
02
Multi-Sensor Data Capture
Sequential RGB, thermal, LiDAR, and multispectral flights executed on the same visit. Thermal timing optimized to peak differential — typically dawn on winter flights, dusk after solar loading. Reservoir level and hydraulic conditions logged with the flight metadata for engineering interpretation.
03
Photogrammetric Reconstruction & AI Segmentation
Overlapping imagery processed into a survey-grade 3D model of the dam and surrounding terrain. AI segmentation identifies concrete defects, seepage outlets, vegetation stress zones, and geometric deformation. Every classified feature pinned to real-world coordinates on the digital twin.
04
Engineering Review & Change Detection
Licensed dam safety engineer reviews AI classifications, confirms severity, and runs change detection against the prior flight baseline. Millimeter-scale crack growth, settlement rates, and erosion volumes quantified. Findings prioritized for the certified condition assessment report.
05
Compliance Filing & CMMS Work Order Routing
Certified assessment filed into the FERC Part 12 record or state dam safety file. Priority defects routed as structured work orders into the maintenance system with imagery, coordinates, and repair scope attached. Full audit trail preserved from flight log to filed report.
Engineering Perspective
"
Every after-action report on a dam failure tells the inspector the signals were there. The forensic team walks the failed section, reconstructs what happened, and identifies the surface signatures that a comprehensive inspection would have caught in time. That's not a criticism of the inspectors — it's a statement about what a walking inspection can physically cover on a dam or a mile of levee. The geometry defeats the method. When we move a dam onto an AI drone inspection program, the first thing owners see is coverage they didn't know they were missing. The downstream face they'd been surveying at fifty percent effective coverage becomes one hundred percent effective coverage. The levee toe that the field crew walked past in the afternoon becomes a thermal map flown at dawn when the seepage differential peaks. The abutment they inspected from a boat becomes a photogrammetric reconstruction accurate to a centimeter. What matters isn't that the AI replaces the engineer — it doesn't, and it shouldn't. What matters is that the engineer's judgment now sits on top of a comprehensive evidence base instead of an incomplete one. The Part 12 comprehensive assessment gets stronger. The state dam safety file gets thicker with actual data. And the failure signatures the surface has been carrying for months finally show up in the record while there's still time to act on them.
Dr. Ingrid Vasquez-Holbrook
Dam Safety Engineering Lead · 24 years in hydropower dam inspection, FERC Part 12 comprehensive assessments, and levee condition programs across the Mississippi and Columbia basins
Common Questions
Frequently Asked Questions
Does AI drone inspection satisfy FERC Part 12 comprehensive assessment requirements?
AI drone inspection provides the underlying condition data and evidence base that a Part 12 comprehensive assessment relies on, with the licensed independent consultant continuing to certify the assessment and issue the final report to FERC. The rule requires a detailed review of design, engineering analyses, spillway adequacy, and a formal risk analysis — all of which benefit from millimeter-accurate 3D geometry, trended defect populations, and thermal seepage evidence that drone workflows produce. FERC's guidance also acknowledges the value of remote sensing in evidence-based safety programs.
Talk to dam engineering about aligning drone cadence with the specific Part 12 cycle on your project.
How does thermal imaging actually detect seepage that visual inspection misses?
Water has a much higher specific heat capacity than earth or concrete, so seepage pathways stay warmer or cooler than the surrounding structure depending on the time of day and season. Thermal cameras on inspection drones capture that temperature differential as a distinct signature, and AI semantic segmentation isolates the pixels associated with seepage outlets on the landside toe or the downstream face. The technique is documented in peer-reviewed research on levee leakage detection and has been deployed operationally across concrete dams, earthen dams, and river levees. Flight timing matters — dawn and post-solar-loading windows give the strongest signal, which is why thermal missions are scheduled against thermal conditions, not calendar convenience.
Can drone inspection work on earthen dams and long linear levee systems, or only on concrete structures?
Both, and the value proposition on earthen dams and levees is arguably stronger. Concrete dams have surfaces that a manual inspector can at least attempt to reach with rope access or boat access. Earthen dams and levees have long linear geometry — miles of embankment in some cases — that manual inspection cannot cover comprehensively at any reasonable cost. A single drone mission can survey miles of levee crown, waterside slope, and landside toe in a few flight hours, with multispectral and thermal data revealing seepage, vegetation stress, and animal burrows across the full alignment. The Texas A&M ERDC research program at RELLIS has validated aerial and satellite remote sensing specifically for levee cracking, erosion, vegetation encroachment, settlement, and seepage.
How does RTK-corrected flight repeatability enable change detection between inspection cycles?
Real-Time Kinematic GPS correction gives the drone centimeter-level positional accuracy. That precision matters because change detection between flights depends on comparing images captured from as close to the same position, angle, and standoff as possible. When two flights are RTK-repeated against the same ground station, the resulting orthomosaics and 3D point clouds overlay to sub-centimeter accuracy, allowing the AI to measure whether a specific crack has widened by one or two millimeters between cycles. That millimeter-level trending is what turns a snapshot inspection into a longitudinal record of dam condition, and it's what makes Part 12 comprehensive risk analysis stronger year over year.
Book a demo to see change detection running against real flight archives.
What happens if severe weather or high water disrupts a planned inspection cycle?
Weather-driven schedule flexibility is actually a strength of drone-based programs compared to traditional inspection methods that require pre-scheduled rope access crews or boat access. When a flood event or storm passes, the drone team can mobilize within hours for a post-event condition flight — capturing the current state of the structure while the loading conditions are still fresh. Conversely, if seasonal high water makes upstream face inspection impractical, the flight can be re-scheduled to the drawdown window without losing the labor cost of a pre-arranged crew. Rain, sustained wind above operational limits, and low visibility do force flight delays, but modern industrial drones tolerate light rain and moderate wind — and the RTK-repeatable flight paths mean deferred flights recover cleanly against the baseline once conditions clear.
Build The Evidence Base Before The Next Cycle
Turn Dam and Levee Inspection Into A Longitudinal Condition Intelligence Program
iFactory's AI drone inspection platform is built for the specific realities of dam safety and levee condition assessment — full geometry coverage, multi-sensor payload, RTK-repeatable flight paths for millimeter-level change detection, and FERC-aligned evidence workflows that survive independent consultant review. Every flight strengthens the compliance record and the capital planning picture at the same time.