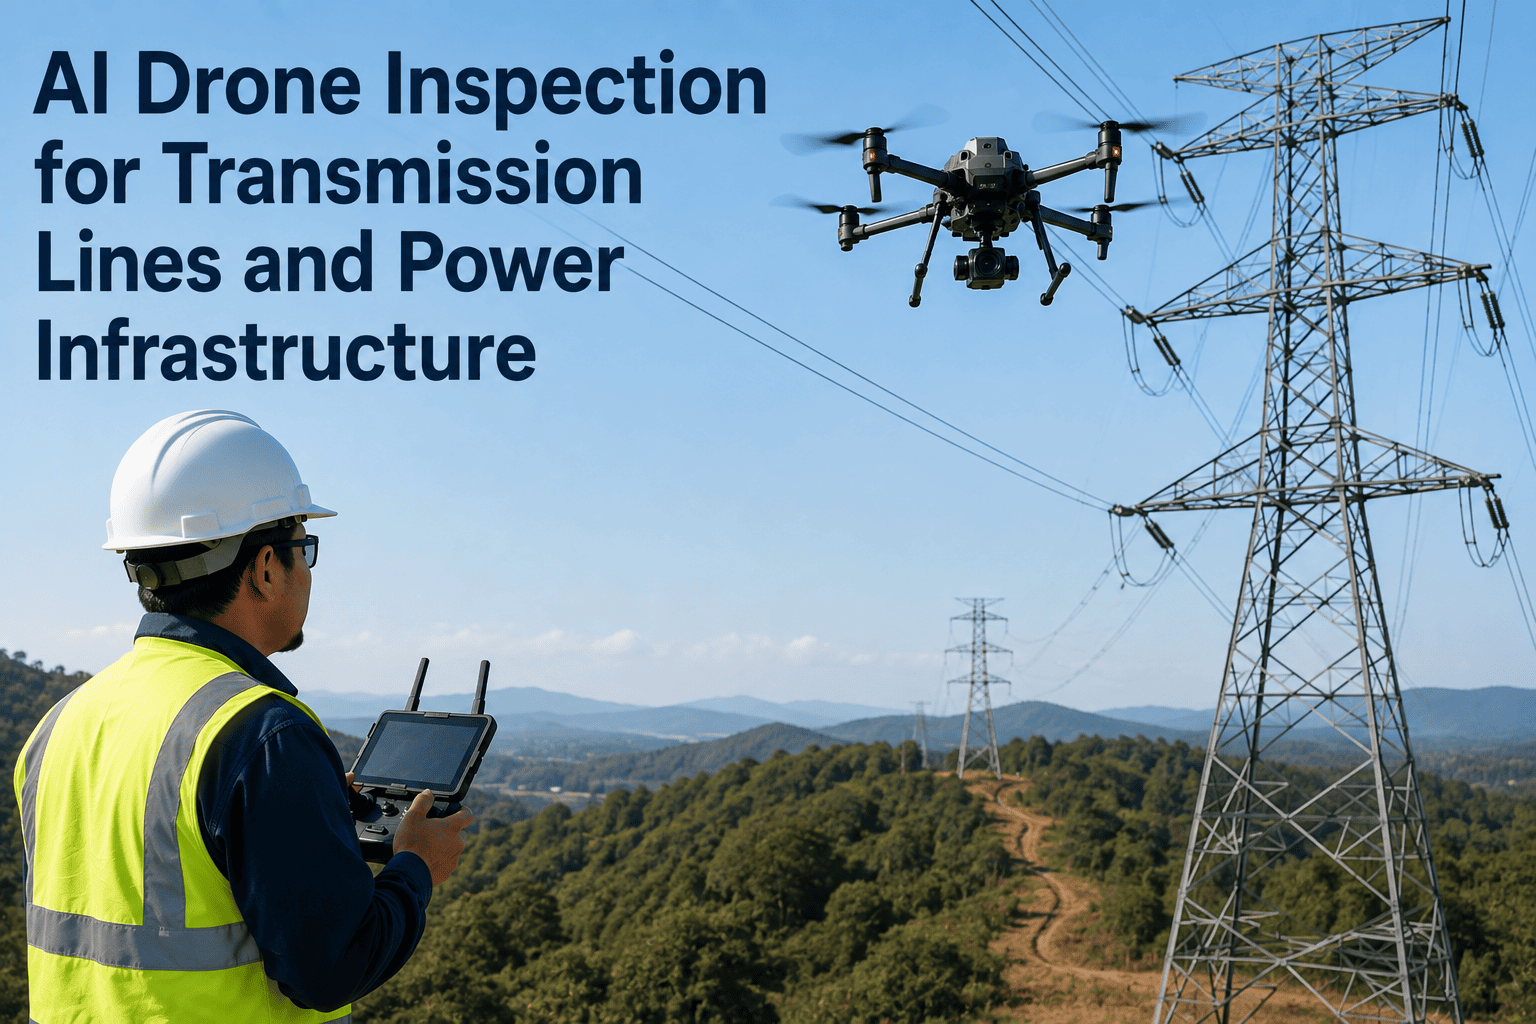
Seventy percent of transmission lines in service today are more than 25 years old, the average power transformer is 40, and 60 percent of circuit breakers have been in the field for more than three decades. That is the aging asset base a shrinking utility workforce is expected to inspect, maintain, and defend against wildfire liability across corridors that stretch hundreds of kilometers into terrain a bucket truck was never designed to reach. Manual foot-and-truck patrols cover a few kilometers per crew per day; an AI-piloted drone corridor patrol covers a hundred or more, identifies structural, thermal, and vegetation defects in the same pass, and drops geolocated work orders directly into the O&M queue. Utility teams evaluating that shift can Book a Demo to see how iFactory turns raw drone corridor data into ranked, dispatchable defect lists.
Why Utilities Cannot Inspect Their Way Out of This With Ground Crews
The scale problem is not new, but the ratio between what utilities own and what a foot-and-truck patrol can realistically inspect has widened past the point where sampled coverage is defensible. A single U.S. transmission utility may operate 10,000 to 40,000 circuit-kilometers of high-voltage line, each of which is subject to NERC FAC-003-4 vegetation clearance requirements, right-of-way inspection cycles, and post-event structural verification after every major storm. A ground crew inspects on the order of 5 to 10 km per day in accessible terrain and substantially less in remote or off-road corridor — meaning a full utility-wide inspection cycle using manual methods runs into years, not months, and by the time a survey closes, conditions at the start of it are no longer accurate.
Two forces have pushed AI-enabled drone inspection from an optional efficiency play into an operational necessity. The first is wildfire liability. The 2018 Camp Fire in California — sparked by a faulty transmission line, resulting in 85 deaths and more than 18,000 destroyed structures — reset the risk math on utility vegetation management across every fire-prone service territory. Utilities cannot defend "we inspected recently enough" if recently enough was 18 months ago and a spark ignited a corridor a foot patrol never reached that season. The second is workforce demographics: the utility field workforce is retiring faster than it is being replaced, and no line-crew hiring program at any utility is producing enough new inspectors to keep manual patrol cadence steady, let alone increase it as asset counts grow.
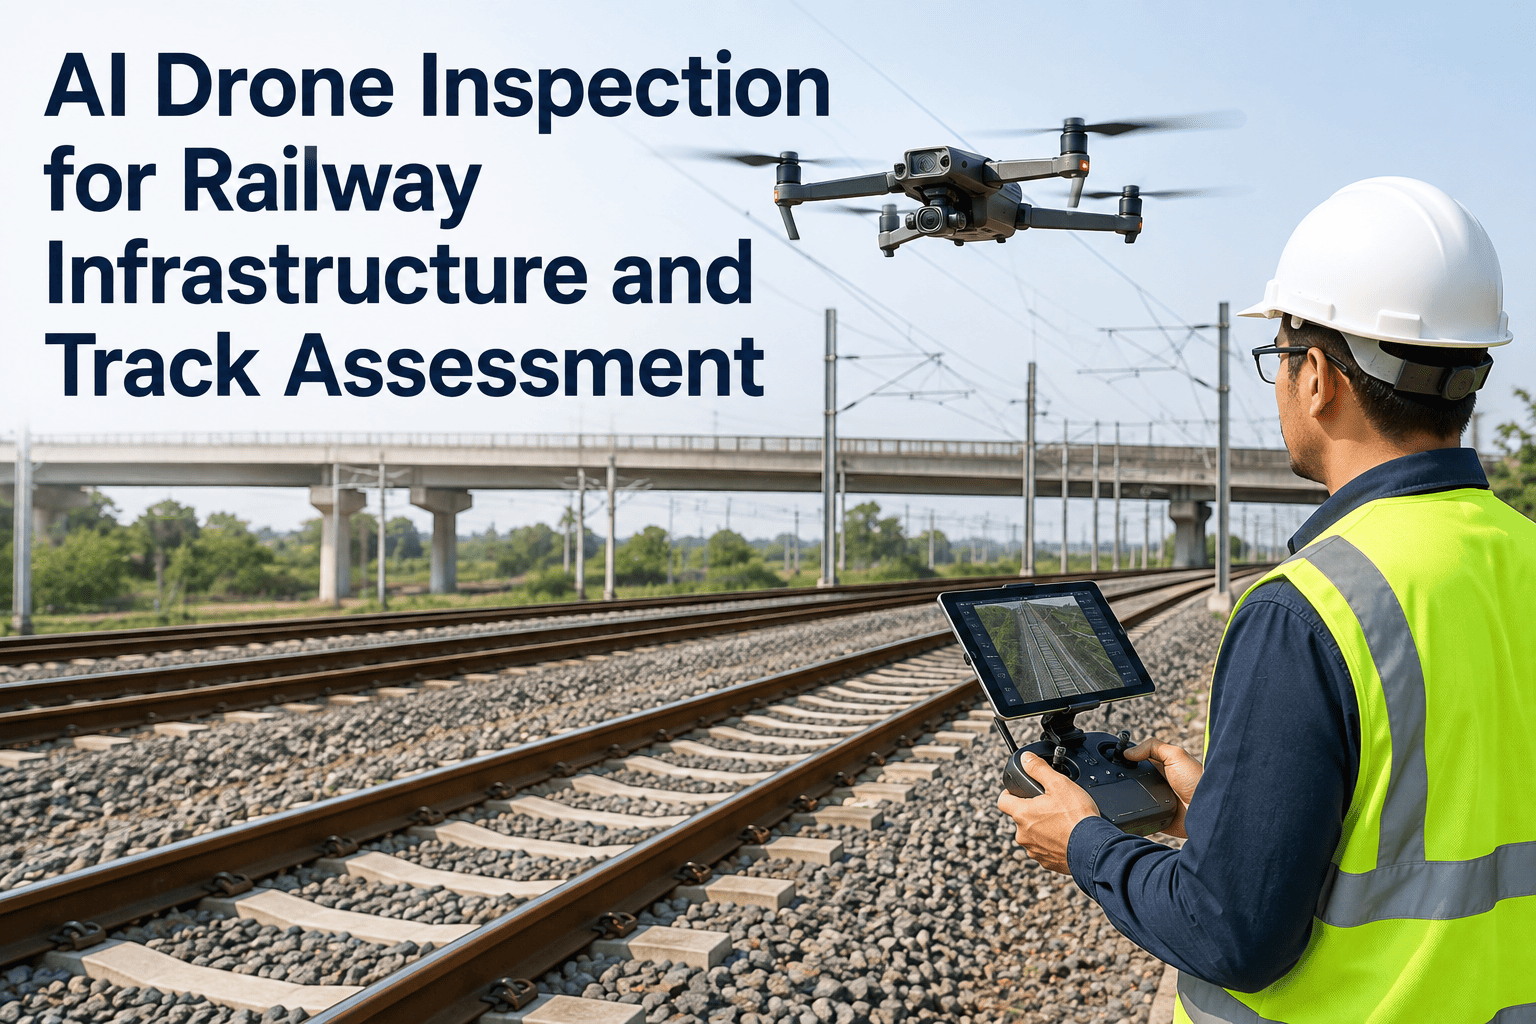
The productivity difference above is not marginal — it is the difference between an annual inspection program that covers 5 percent of the network and one that covers the entire network multiple times per year. Once BVLOS (beyond visual line of sight) regulatory frameworks mature — which is happening rapidly in both U.S. FAA and international jurisdictions — a single autonomous drone covers corridors that previously required repositioning ground teams every few kilometers, and the inspection frequency question stops being "can we afford it" and starts being "why aren't we doing it monthly."
The Six Defect Categories AI Classifiers Are Actually Trained On
Transmission line inspection is a specific machine-learning problem because the asset base is highly standardized. A steel lattice tower looks fundamentally like every other steel lattice tower on the corridor; an insulator string on 138 kV line looks like every other insulator string of the same class. That standardization is exactly what makes vision-AI models effective at detecting when something is wrong. Modern classification systems are trained against six defect families that between them account for the overwhelming majority of transmission-corridor failure modes.
What makes AI classification transformative is not that it detects any single defect class better than a trained human observer — a good field inspector can identify most of these defects reliably. What AI does is apply the same detection consistency to every frame, across tens of thousands of towers per week, without fatigue-driven accuracy degradation, and with severity grading that stays calibrated across the entire dataset rather than drifting between individual reviewers.
The Sensor Payload Stack: What Each Modality Actually Sees
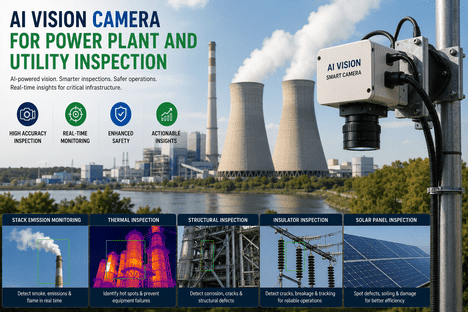
A single-camera drone flying a transmission corridor captures a fraction of what modern multi-sensor payloads produce in the same pass. Every payload modality answers a different diagnostic question, and the most operationally effective inspection programs combine three or four modalities into a single flight rather than running separate campaigns for each. The table below breaks down what each sensor class contributes and where its unique diagnostic value lies.
| Sensor Payload | Primary Diagnostic Value | Fault Types Detected |
|---|---|---|
| High-Resolution RGB | Visual defect identification and asset condition documentation at zoom levels ground observers cannot reach | Corrosion, cracked insulators, missing hardware, broken conductor strands, bird nests, foreign objects |
| Radiometric Thermal (IR) | Temperature anomaly detection on live conductors, splices, dead-ends, and hardware connections under load | Hot splices, loose connections, overloaded conductors, transformer hotspots, degraded contact points |
| LiDAR | Centimeter-accurate 3D geometry of conductors, structures, and adjacent vegetation for clearance analysis | Vegetation encroachment, sag/tension deviations, tower lean, ground clearance violations, encroaching structures |
| Ultraviolet Corona Imaging | Detection of corona discharge from damaged insulators and hardware — invisible in RGB and thermal alone | Insulator surface tracking, damaged corona rings, contamination flashover risk, hardware discharge points |
| Multispectral / Hyperspectral | Vegetation health assessment beyond simple geometric clearance measurement | Dead or dying trees within strike distance, disease-stressed vegetation, fire-fuel accumulation identification |
The industry has converged around a payload combination of high-resolution RGB, radiometric thermal, and LiDAR as the baseline configuration for transmission corridor inspection, with UV corona and multispectral added on utility-specific requirements. Modern enterprise drone platforms carry these sensors on a single gimbaled payload or in dual-payload configurations that capture all modalities in a single overpass — meaning what used to be three separate inspection campaigns is now one flight day producing three correlated datasets. Payload selection also drives the AI classifier architecture: RGB and thermal feed convolutional vision models trained on labeled defect imagery, while LiDAR point clouds feed geometric analysis pipelines that produce clearance measurements rather than image classifications. Utilities running mature programs increasingly treat these as complementary rather than substitutable — a defect flagged by two independent modalities is scored higher confidence than one flagged by RGB alone, and the fusion logic across modalities is where classifier accuracy improvements are compounding fastest.
Vegetation Management: The Highest-Stakes Application of LiDAR Drone Inspection
Vegetation encroachment remains one of the leading causes of both power outages and utility-caused wildfires globally. NERC FAC-003-4 sets clear regulatory requirements for transmission right-of-way clearance, with per-violation penalties that scale meaningfully for utilities with large network footprints. But the regulatory penalty is not the reason vegetation management programs are shifting toward drone LiDAR — the reason is that manual patrol methods physically cannot maintain the inspection frequency required to catch fast-growing vegetation before it enters strike zone under adverse weather conditions.
Utilities running LiDAR-based vegetation programs report vegetation-related outage reductions of up to 60 percent versus prior calendar-based trim schedules. The mechanism is straightforward: calendar-based trimming addresses vegetation that is scheduled to be addressed, while data-driven trimming addresses vegetation that actually poses risk — which are frequently not the same trees. In fire-prone service territories, the combination of drone LiDAR structural analysis and multispectral or satellite vegetation-health data has become the effective standard for defensible wildfire mitigation program documentation. Insurers and rating agencies are beginning to write specific inspection cadence and documentation requirements into utility coverage and credit assessments, which shifts LiDAR-based vegetation programs from an operational choice into a financing-and-insurance condition — meaning the business case for the program frequently no longer needs to compete against manual patrol on cost alone.
The Storm Response Window: Where Drone Speed Matters Most
Routine inspection is where drone economics are compelling, but post-event inspection after major storms is where drone speed is genuinely transformative. When a hurricane, ice storm, or high-wind event impacts a transmission network, restoration crews cannot begin repair work until damaged sections are identified and prioritized. Traditionally, that assessment phase took days — helicopter crews flying accessible corridors, ground teams walking impassable ones, dispatchers piecing together a damage picture from customer outage reports and scattered visual reports. Drone deployment collapses that assessment window from days to hours.
The customer-impact math on this is straightforward: shorter time to first-truck-on-site translates directly into shorter average outage duration, which is the single metric utility regulators, ratepayer advocates, and executive teams all track most closely. Utilities piloting permanent drone stations at substations — enabling on-demand patrol launches without repositioning crews — are compressing post-event assessment windows further, with some operators reporting damage-mapping turnaround within four hours of an event ending. The downstream operational effect is that crew utilization improves as well: instead of dispatching restoration teams into corridors to first assess then repair, teams roll with a known damage list and pre-staged materials, which reduces both crew hours per outage and the number of return trips to the same site to obtain parts identified only after arrival.
The Numbers Utilities Track After Twelve Months of AI Drone Inspection
The metrics below represent the outcomes utilities running production AI-enabled drone inspection programs consistently report after a full year of operational data. Individual programs vary based on network size, starting inspection cadence, and terrain, but the direction and magnitude of these figures have proven durable across geographies and utility types.
Two metrics matter more than the rest of the list combined for executive-level reporting. Mean time to repair drops because dispatch now happens with exact GPS coordinates and pre-identified fault modes rather than crew self-diagnosis on arrival. Reliability metrics improve because faults are being caught 14 to 21 days earlier in their development curve, well before they become customer-visible outages. Everything else on this list is a consequence of those two shifts. And the compounding effect over multiple inspection cycles matters more than any single-year figure — utilities in their second and third year of production AI drone programs consistently report that year-two outage metrics exceed year-one improvements, because a program that catches faults 14 to 21 days earlier eventually clears its backlog of latent developing defects entirely, leaving only genuinely new fault emergence to address.