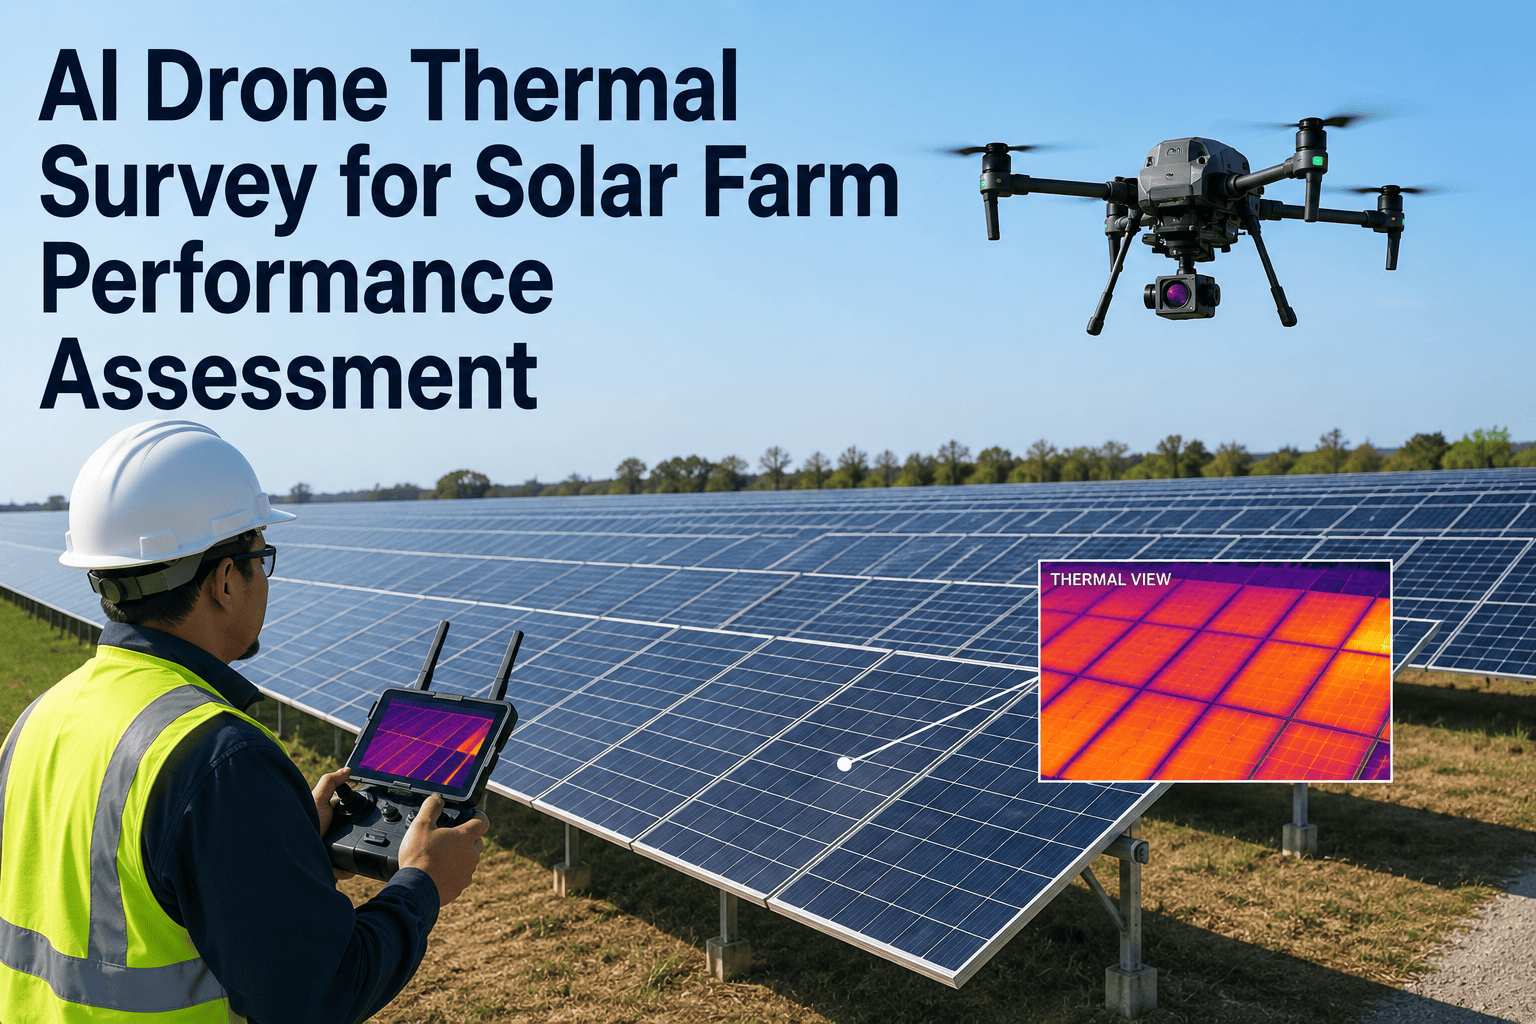
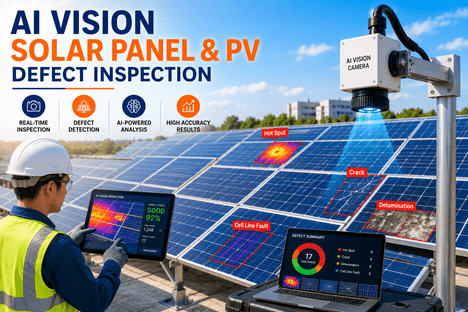
A 50 MW solar farm holds somewhere between 150,000 and 200,000 individual PV modules — and a manual thermal walkthrough with a handheld camera covers 1 to 2 MW per technician per day. The arithmetic is not subtle: full-plant thermal coverage at utility scale is either weeks of crew time in 40°C field conditions, or it is a targeted drone survey that finishes in a day and misses fewer defects doing it. What has changed in the last three years is not the drone hardware — radiometric IR payloads have been production-grade since 2020 — but the AI classification layer sitting behind the flight, sorting hot pixels into IEC 62446-3 anomaly classes automatically instead of leaving that work for a human reviewer at 3 a.m. Solar operators evaluating this shift can Book a Demo to see how iFactory turns raw thermal captures into ranked, geolocated fault lists ready for the O&M ticket queue.
AI DRONE THERMAL SURVEY · SOLAR FARM PERFORMANCE ASSESSMENT · IEC 62446-3
AI Drone Thermal Survey for Solar Farm Performance Assessment
50MW+ plants inspected in a single day. Hot spots, string failures, bypass diode faults, PID patterns, and soiling — detected across millions of cells, ranked by ΔT severity, and mapped to exact module coordinates.
100+ MW
Coverage per drone per day
75%
Faster than manual inspection
$2,100
Saved per MW vs. handheld crews
17
Anomaly classes auto-graded
The Coverage Math That Made Manual Thermal Inspection Obsolete
Utility-scale solar has crossed a threshold where routine full-plant thermal inspection using ground crews is no longer economically defensible. A 50 MW site contains roughly 150,000 to 200,000 modules; a 100 MW site double that. A trained thermographer walking rows with a handheld IR camera inspects around 1 to 2 MW per day under favorable conditions, meaning a single 50 MW farm requires 25 to 50 person-days of skilled labor for a single pass — before accounting for heat stress, fatigue-driven detection error, and the fact that irradiance conditions on day 30 of a walkthrough differ meaningfully from day 1.
A drone equipped with a radiometric thermal sensor and a synchronized RGB camera covers that same 50 MW plant in one to two flight days. The DJI Matrice 350 or 400 RTK with a Zenmuse H30T payload — 1280×1024 thermal resolution, sub-50 mK sensitivity, RTK positioning to centimeter accuracy — has become the reference platform for utility-scale surveys. But the drone itself is only half of what changed. Raw thermal frames are useless without a classification layer that maps observed hot pixels to specific fault types, and manual review of tens of thousands of frames per plant is where the traditional bottleneck simply moved rather than disappeared. AI-driven anomaly detection compresses that review from weeks to hours by classifying each thermal signature against a taxonomy of 17-plus anomaly types drawn from IEC 62446-3, ranking severity by measured temperature delta, and outputting a ready-to-triage fault list keyed to individual module GPS coordinates.
Manual Handheld Thermal
Coverage rate1–2 MW / person / day
50 MW plant time4–8 weeks, multi-person crew
Cost per MWHigher labor & travel overhead
Fault detection consistencyDeclines with operator fatigue
Irradiance conditionsVaries across days of survey
Safety exposureCrew near live DC arrays, heat stress
AI Drone Thermal Survey
Coverage rate50–100+ MW / drone / day
50 MW plant time1–2 flight days, single pilot
Cost per MW~$2,100 lower than manual
Fault detection consistencyAI classifier — no fatigue drift
Irradiance conditionsSingle-window capture, consistent
Safety exposureGround operator, no array contact
The reason drone-based thermography has become the dominant utility-scale inspection method is not speed alone — it is what speed unlocks. Faster coverage means more frequent inspections, which means faults are caught closer to the day they emerge rather than at the next annual walk. Documented case studies show individual site inspections surfacing $21,000-plus in undetected annual revenue losses on a single pass. On a 50 MW plant, previously undetected faults can represent $368,000 in recoverable annual generation. That number is what changes the ROI equation from "drones are nice to have" to "manual inspection is the expensive option."
What the Thermal Camera Actually Sees: The IEC 62446-3 Anomaly Taxonomy
Under normal operation, a healthy PV module radiates heat uniformly across its surface. Every fault — electrical, physical, or environmental — disrupts that uniformity in a way a radiometric IR camera can measure. IEC 62446-3 provides the international framework for classifying those disruptions, and drone-based AI inspection maps observed thermal signatures directly into its abnormality classes. The taxonomy below covers the fault types responsible for the overwhelming majority of solar farm performance losses detectable through outdoor infrared thermography.
CLASS A
Single Cell Hot Spot
One isolated cell running measurably hotter than its neighbors — typically indicating a cracked cell, cell-level shading, delamination point, or localized interconnect failure. Concentrated within a few thermal pixels; the earliest visible signature of many degradation pathways.
CLASS B
Multiple Cell Hot Spots
Several distinct hot cells within a single module, often signaling manufacturing defects, uneven cell degradation across a batch, or accumulated microcracking from installation or thermal cycling stress.
CLASS C
Hot Substring (Bypass Diode)
A uniformly hot substring inside a module — the classic bypass diode activation signature. Indicates the diode has engaged to route current around a compromised cell group, and that substring is now producing zero power while dissipating heat.
CLASS D
Uniformly Hot Module
An entire module running hotter than adjacent modules, typically indicating a disconnected module, reverse-biased module, or complete module-level failure where the panel is drawing current but producing no useful output.
CLASS E
Hot String / Open Circuit
An entire series-connected string of modules showing uniform elevated temperature — the signature of a disconnected or open-circuit string. Represents complete generation loss across the affected string until repaired.
PID
Potential Induced Degradation
A characteristic thermal pattern where modules near the negative end of a string show degraded output — a voltage-driven degradation mode that spreads across affected panels and produces measurable generation loss over months.
SOIL
Soiling-Related Heating
Non-uniform heat distribution caused by dirt accumulation, bird droppings, or vegetation shading — reducing irradiance absorption locally and creating both cooler shaded zones and adjacent hot spots from partial shading electrical effects.
CONN
Connector & J-Box Heating
Elevated temperature at module junction boxes or DC connectors — indicating loose connections, corrosion, or degraded contacts. Represents both a performance concern and a documented fire risk pathway on aging installations.
Severity in the IEC 62446-3 framework is graded not by anomaly class alone but by the measured temperature delta (ΔT) between the anomaly and surrounding healthy modules. A ΔT above 10°C on a single panel signals a fault requiring immediate attention; smaller deltas indicate developing conditions that should be tracked but may not require immediate intervention. AI classification layers apply this severity grading automatically frame-by-frame, escalating fire-risk categories such as connector heating earlier in the priority queue than lower-risk soiling anomalies.
RANKED FAULT LISTS · GPS-TAGGED MODULES · O&M-READY OUTPUT
Turn Thermal Captures Into Work Orders, Not Photo Archives
iFactory ingests raw radiometric thermal data, applies IEC 62446-3 anomaly classification, ranks findings by ΔT severity, and outputs geolocated fault lists your O&M team can dispatch against directly — no manual frame-by-frame review required.
The Flight Day: What a Compliant Thermal Survey Actually Looks Like
A defensible IEC 62446-3 thermal survey is not a matter of launching a drone whenever weather permits. The standard specifies environmental conditions strict enough that a meaningful percentage of flight windows in a given month simply do not qualify — and results captured outside those conditions are diagnostically unreliable regardless of hardware quality. Understanding what a compliant flight day looks like is the difference between a survey report an insurer or warranty administrator accepts and one they send back for re-shooting.
01
Environmental Condition Check
Irradiance must be at or above 600 W/m² for the survey to be diagnostically valid — panels must be under electrical load producing power for faults to generate detectable thermal contrast. Wind speed below 28 km/h (roughly 5 m/s) prevents both aircraft instability and thermal convection distortion of module surface temperatures. Ambient temperature and reflected apparent temperature are logged and used to calibrate radiometric readings.
02
Automated Mission Planning
Grid mission plans are generated automatically from the plant's boundary and row layout. Flight paths run perpendicular to string orientation to ensure consistent thermal capture geometry, with fixed altitude between 20 and 40 meters and image overlap tuned for continuous mosaic construction. RTK positioning locks each captured frame to centimeter-level coordinates for later fault localization.
03
Synchronous Thermal + RGB Capture
The dual-payload sensor captures radiometric thermal and high-resolution visible imagery simultaneously. Thermal frames identify anomalies invisible to the naked eye; the paired RGB frame provides visual confirmation of module identity and confirms whether an observed hot spot corresponds to a physical defect, soiling event, or environmental artifact.
04
AI Classification & Severity Grading
Each captured frame passes a capture-quality gate — irradiance floor, camera angle, focus, thermal contrast — before entering the classifier. Valid frames are analyzed against the IEC 62446-3 anomaly taxonomy, with each detection labeled by class, measured ΔT, severity ranking, and module coordinates. Fire-risk categories are escalated in the priority output ahead of lower-severity findings.
05
Georeferenced Reporting
Individual frames are stitched into a plant-wide orthomosaic map with every detected anomaly plotted to exact GPS coordinates. The output combines a plant-level fault heat map for asset management overview with per-module drill-down showing thermal image, RGB image, ΔT measurement, and classification — the deliverable format IEC 62446-3 requires for compliant reporting.
The ROI Numbers Utility-Scale Operators Actually Track
Drone thermal inspection is one of the few solar O&M investments where payback math resolves inside a single inspection cycle. The savings come from three sources that stack rather than compete: recovered generation from previously undetected faults, reduced labor cost per MW surveyed, and reduced warranty-window loss where a defect discovered before the warranty expiration is a manufacturer recovery rather than an owner absorbed cost.
$21K+
Undetected annual revenue loss surfaced on a single site inspection
$368K
Documented annual generation recovery on a 50 MW plant post-inspection
400%
Faster utility-scale coverage vs. handheld crew methods
45%
Lower cost per MW inspected vs. manual thermal walkthroughs
Single
Season payback typical for in-house drone program economics
100%
Module coverage per survey vs. sampled coverage from ground crews
The comparison that matters most is not drone-vs-manual on cost alone — it is drone-vs-nothing on fault discovery. Manual thermal inspection at utility scale is expensive enough that most operators sample rather than survey exhaustively, meaning a meaningful percentage of modules go uninspected in any given year. A drone survey inspects every module in a single pass; sampled coverage misses precisely the faults that most benefit from early detection because they are not concentrated where a sampling protocol looks for them.
Inspection Frequency: Matching Survey Cadence to Plant Risk Profile
Not every plant needs the same inspection cadence, and the economics of drone-based surveys mean the right frequency for a given asset is a matter of risk profile rather than budget constraint. The reference cadence recommendations below track industry consensus on what routine inspection intervals should look like for different plant sizes, ages, and known quality histories.
The single strongest predictor of when a plant benefits from tighter inspection cadence is not size alone but generation-loss exposure per undetected month. A 100 MW plant with a 2% underperformance shortfall running undetected for six months represents a materially larger recoverable revenue figure than a 10 MW plant with the same percentage loss over the same period, which is why utility-scale operators tend to converge on quarterly surveys once they run the arithmetic against their own PPA rates. Insurers and financing partners are increasingly writing minimum inspection cadence requirements directly into project agreements — a shift that reflects growing actuarial evidence linking undetected thermal anomalies, particularly connector and junction-box heating, to documented fire loss events on aging installations.
What Thermal Alone Cannot See — And Where AI Cross-Correlation Fills the Gap
Thermal imaging is the most powerful single modality for solar farm fault detection, but it is not a complete diagnostic on its own. Understanding where thermal reaches its limits — and how modern AI inspection platforms fill those gaps by cross-correlating thermal data with other signals — is what separates a competent inspection program from one that misses categories of defects it never had visibility on.
01
Very early-stage defects. Cell-level defects producing insufficient temperature contrast may not flag reliably in thermal data alone. AI cross-referencing against RGB imagery and electroluminescence data — where available — closes this gap.
02
Purely optical defects. Surface scratches, coating degradation, and cosmetic damage may not shift thermal signatures meaningfully but affect long-term generation. AI RGB-channel analysis identifies these signatures automatically alongside thermal capture.
03
Weather-dependent capture windows. Cloudy conditions, low irradiance, or high wind ground compliant flights entirely. Modern inspection platforms schedule around weather forecasts automatically and re-queue missed capture windows without operator intervention.
04
Nighttime inspection blind spot. Thermal fault detection requires panels under load — nighttime flights capture no useful diagnostic data on PV faults. AI-integrated platforms combine daylight thermal with continuous performance monitoring for round-the-clock coverage.
05
Inverter and BOS-side faults. Module-level thermal captures may not surface faults originating in inverters, combiner boxes, or DC-side wiring. Cross-referencing thermal survey output with inverter SCADA data localizes the actual fault origin.
The strategic implication is not that thermal drone inspection is incomplete on its own — it remains the highest-yield single inspection modality for utility-scale solar. The implication is that its outputs become substantially more actionable when correlated with the plant's existing operational data streams, and that this correlation is exactly the workflow modern AI inspection platforms are built to handle rather than leave for operators to reconcile manually. Teams evaluating how to integrate thermal survey outputs with existing SCADA and O&M ticketing systems can contact iFactory Support to discuss integration architecture.
Frequently Asked Questions: AI Drone Thermal Survey for Solar Farms
How large a solar farm can a single drone actually inspect in one day?
Under favorable environmental conditions, a single enterprise drone with a radiometric thermal payload covers 50 to 100+ MW per operational day, meaning most utility-scale plants complete in one to two flight days regardless of module count. Coverage rate depends on module density per hectare, flight altitude, image overlap requirements, and battery-swap turnaround time. Larger multi-hundred-MW sites typically deploy multiple synchronized drones to complete capture within a single irradiance window. Operators can
Book a Demo to see coverage projections for specific plant sizes.
What environmental conditions are required for a valid IEC 62446-3 thermal survey?
IEC 62446-3 specifies irradiance at or above 600 W/m² for the survey to produce diagnostically valid thermal data — modules must be under electrical load generating power for faults to create detectable thermal contrast against healthy panels. Wind speeds must remain below approximately 28 km/h to prevent aircraft instability and thermal convection distortion. Ambient temperature and reflected apparent temperature are logged for radiometric calibration. Surveys conducted outside these conditions produce results that may be rejected by insurers, warranty administrators, or acceptance auditors regardless of hardware quality.
How does AI classification differ from manual thermal image review?
Manual review of a utility-scale plant's thermal capture involves a trained thermographer examining tens of thousands of individual frames, applying IEC 62446-3 anomaly classification by eye, and cross-referencing each finding against RGB confirmation and GPS coordinates. This is where inspection programs historically bottlenecked. AI classification applies the same taxonomy automatically frame-by-frame, gates each frame against capture-quality standards, ranks findings by measured ΔT severity, and outputs the geolocated fault list in hours rather than weeks — with consistency that does not degrade across long review sessions the way human accuracy does.
Can drone thermal surveys detect potential-induced degradation (PID) reliably?
Yes. PID produces a characteristic thermal signature where modules near the negative end of a string show progressive output degradation and elevated relative operating temperature. AI classification layers trained against IEC 62446-3 anomaly patterns identify PID signatures at the module and string level, with severity graded by how far the affected panels have degraded relative to the string's healthy modules. Early PID detection is where thermal survey frequency matters most — the degradation is progressive, and catching it early substantially reduces total generation loss over the plant's remaining service life.
Does a drone thermal survey replace physical inspection entirely, or supplement it?
Drone thermal survey replaces the routine full-plant thermal walkthrough that ground crews previously performed, but it does not replace targeted physical inspection of specific findings the survey identifies. The workflow shifts: rather than sampling modules manually and hoping to find issues, the survey identifies exactly which modules require physical follow-up, and technicians visit only those specific panels for confirmation, cleaning, or replacement work. This is where the labor savings actually come from — not eliminating ground work entirely, but eliminating the exhaustive search phase that used to consume most of it.
DRONE THERMAL SURVEY · AI ANOMALY CLASSIFICATION · IEC 62446-3 REPORTING
Move Your Solar Fleet From Sampled Inspection to Full-Plant Thermal Coverage
iFactory ties AI-classified thermal survey output directly to your O&M ticketing, SCADA correlation, and warranty documentation — so every anomaly detected turns into a tracked, resolved, defensible record instead of a PDF that lives in a shared drive.