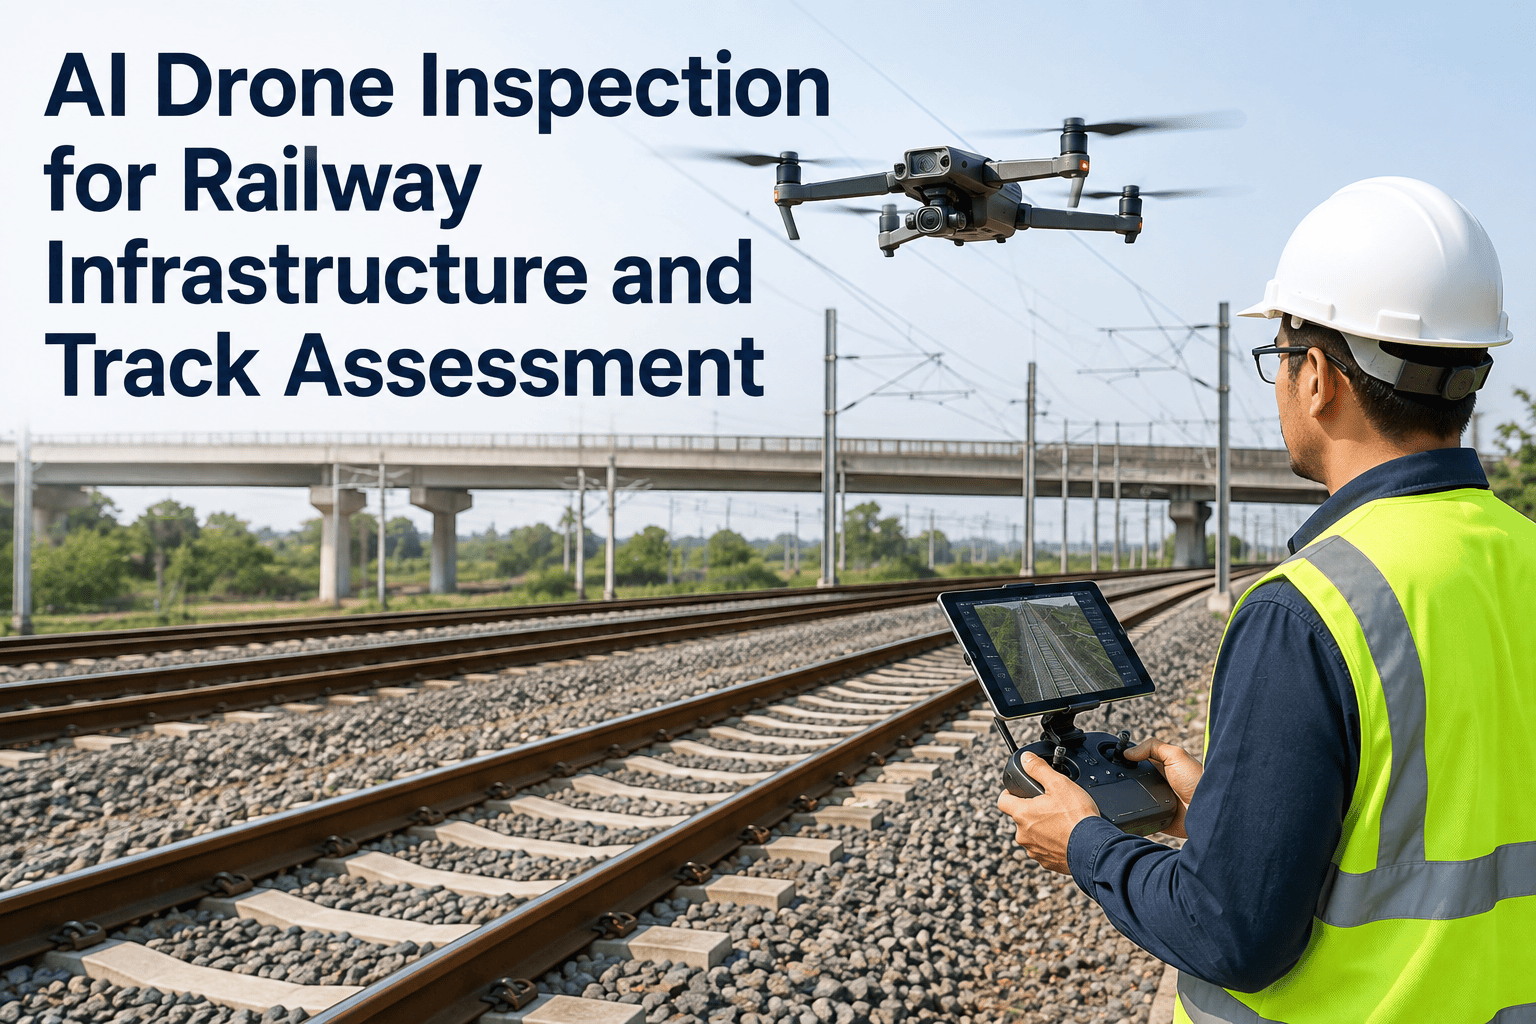
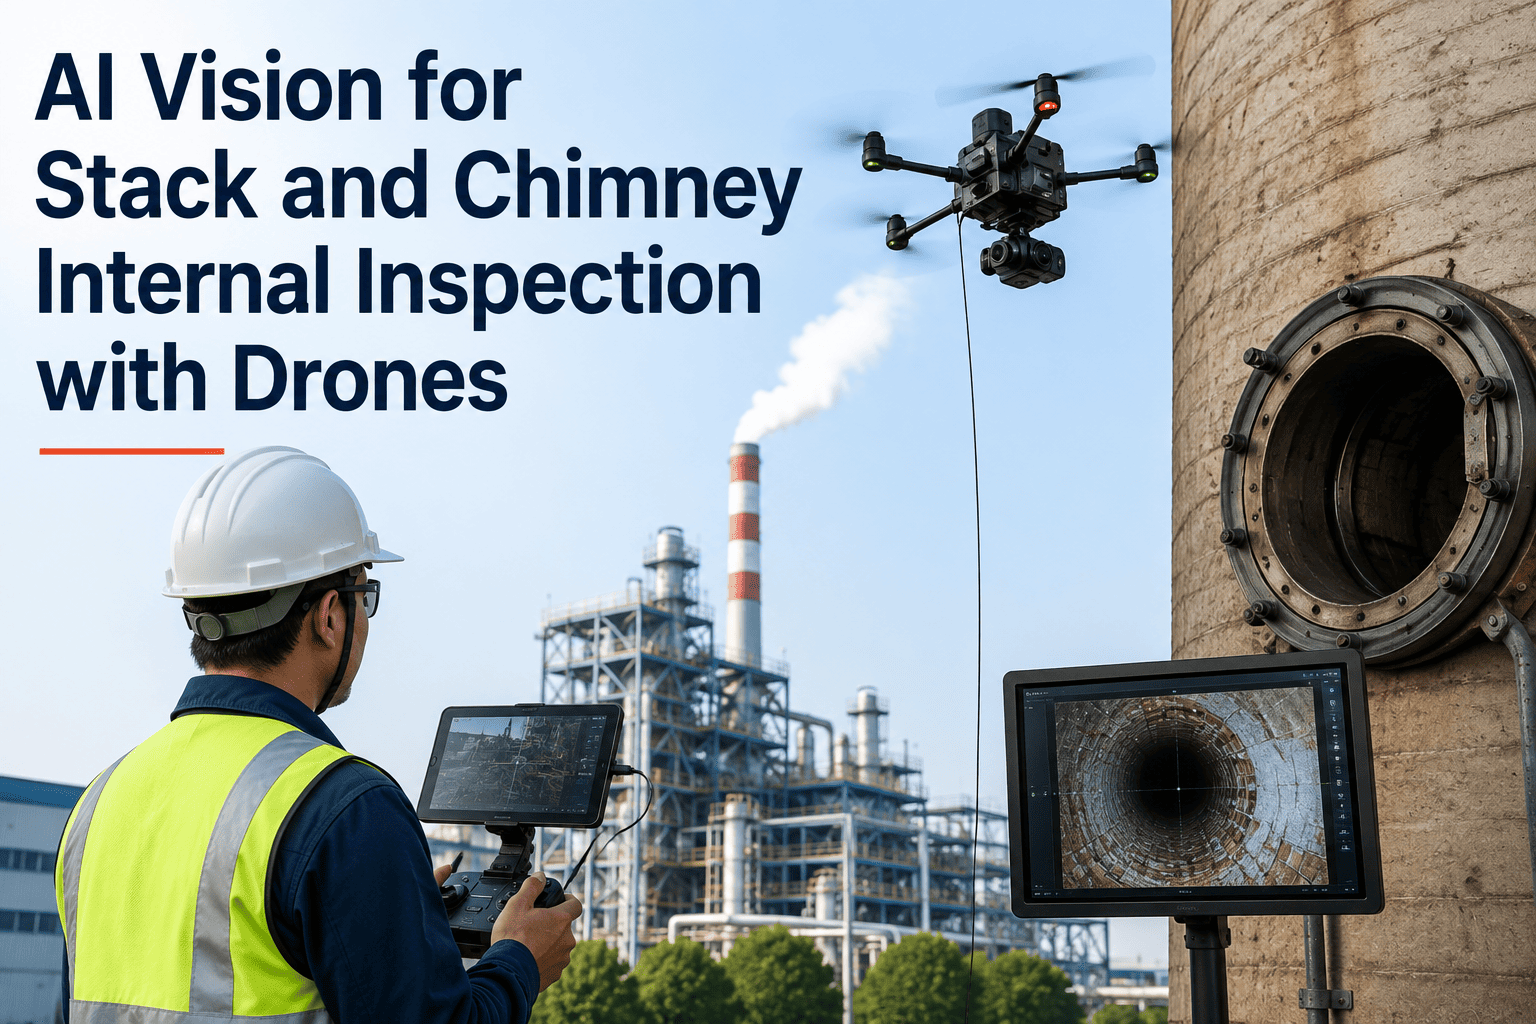
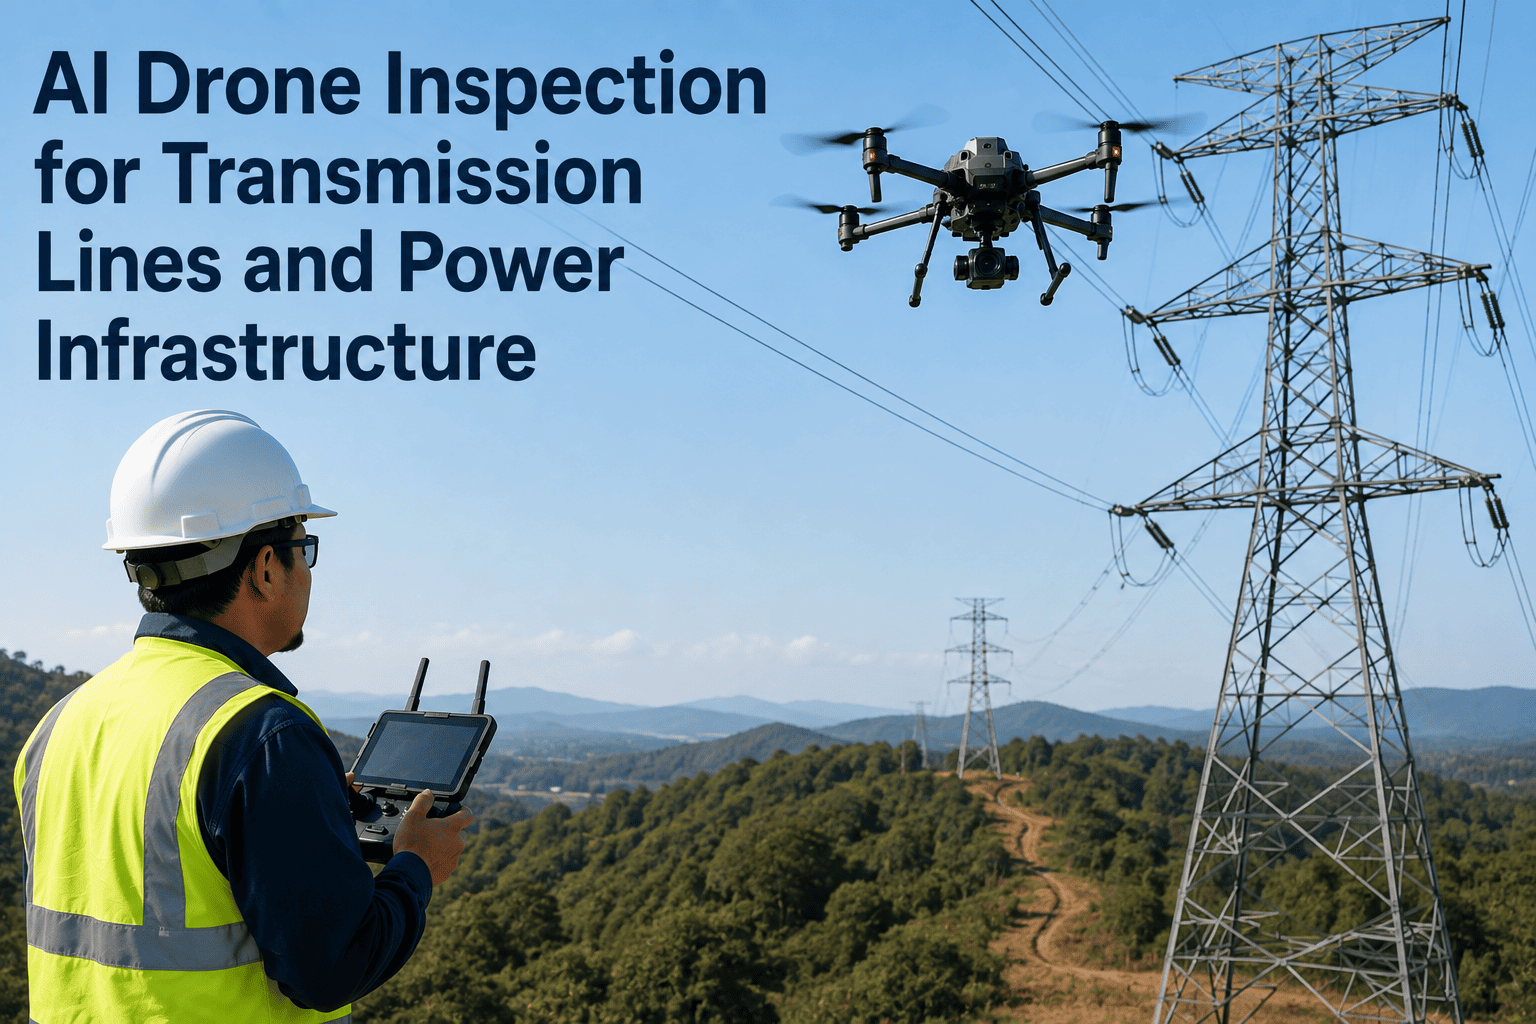
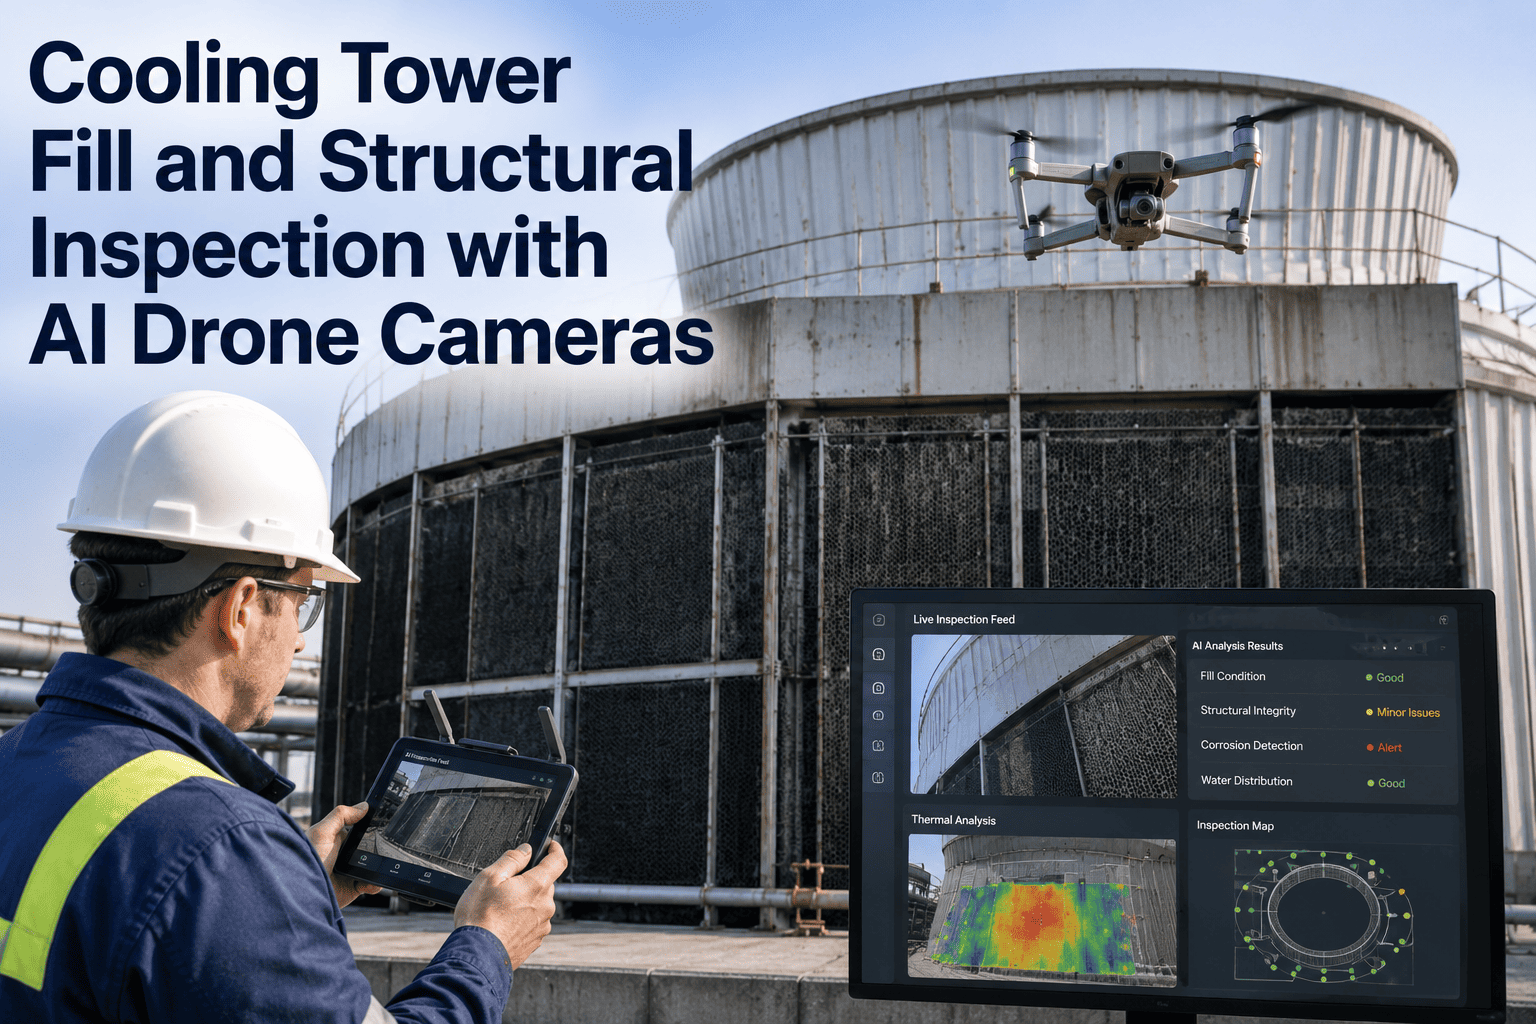
A flare stack sits somewhere between the most critical and the most inspection-hostile asset in a refinery. It burns 24/7 at temperatures reaching 1,500°F. Its tip, refractory lining, and structural welds degrade continuously, but every traditional inspection method requires you to shut it down, cool it for days, then send climbers up 500 feet in a harness — a process that runs three to five weeks and costs somewhere between $150,000 and $250,000 per stack. A drone with a high-temperature ultrasonic thickness probe now completes the same inspection in about two hours, on a live in-service flare, without a single technician leaving ground level. That is the reason flare stack inspection has become the highest-ROI use case in industrial drone programs. To see it running on your own stacks, connect with the iFactory support team.
Oil and Gas · Flare and Vent Inspection
Inspect a Live Flare in 2 Hours. Skip the Three-Week Shutdown.
AI drones inspect flare tip condition, refractory erosion, weld integrity, and structural welds at 500+ feet elevation while the stack keeps burning. No scaffolding. No crane rental. No cooldown window. Just a defect-ranked report the next morning.
2 hrs
In-service inspection time
$150K
Saved per stack per inspection
95%
Reduction in setup time
Anatomy of a Flare Inspection
What the Drone Actually Looks At on a 500-Foot Stack
Flare stacks fail from the top down. The parts under the most thermal and mechanical stress — the tip, the pilot assembly, and the upper refractory zone — are also the parts that are hardest to reach and most dangerous to inspect. A single mission covers all of them at close range with imagery no rope-access technician could safely capture. The five zones below break down what actually gets looked at, in the order the AI processes them, so you can see exactly which condition data flows out of a single flight and where the highest-value findings usually appear on your first inspection cycle.
Zone 1
Flare Tip and Burner Assembly
Tip erosion, burner nozzle wear, pilot ignition assembly, and windshield damage. Direct exposure to 1,500°F combustion means this zone degrades fastest and fails hardest. Thermal drone imagery captures hotspots and cool-spot patterns invisible to any ground-based survey, and the tip condition is often the single highest-value finding on the first inspection cycle for most operators.
Zone 2
Upper Refractory Lining
Refractory erosion, spalling, and thermal cycling damage in the top 30 to 50 feet of the stack. Refractory failure here exposes the steel shell to direct heat and drives the next major structural repair. AI compares this cycle's imagery to the last one and quantifies erosion depth changes.
Zone 3
Structural Shell and Weld Seams
Longitudinal and circumferential weld integrity, external corrosion, coating breakdown, and shell wall thickness. High-temperature ultrasonic probes deliver contact thickness measurements at elevation — the same NDT data a rope-access crew would collect, without the crew or the harness. Grid measurement points are pre-planned against the 3D stack model so cycle-over-cycle thickness trends are quantified rather than approximated, and API 510 remaining-life calculations run directly against the measured data.
Zone 4
Guy Wires, Platforms, and Ladder
Guy-wire tension anomalies, platform corrosion, ladder cage integrity, and lightning protection continuity. These are the ancillary systems that fail quietly and produce the incident reports nobody wants. Drone imagery catches them without waiting for the next scaffolded window, and the AI flags any degradation against the baseline captured on the first inspection cycle.
Zone 5
Vent Systems and Knockout Drums
Vent header connections, knockout drum external condition, and associated piping. Full-facility flare and vent surveys extend the same mission to cover the ground-level infrastructure feeding the stack, producing a complete asset condition record in one visit. Vent system findings are often what surprises operators most on a first-cycle inspection, because these are the components that traditional flare inspection contracts typically excluded from scope entirely — the drone captures them at no additional flight cost since they sit inside the same mission envelope.
Sensor Payloads
The Three Payload Configurations That Cover a Complete Flare Survey
Not every mission needs every sensor. Depending on what you are looking for and how far along your registry is, the drone flies with one of three payload configurations. Each has a specific job and a specific accuracy envelope, and mixing them across a survey is how you get to a complete inspection record without wasted flight time. On a first-cycle inspection most operators start with the RGB and thermal payload to establish baseline condition, then add ultrasonic thickness measurements on flagged areas in a second flight window. On follow-up inspections the mission is smaller and more targeted, because the AI already knows where degradation is progressing and where the wall thickness measurements need to be taken.
Payload A
High-Resolution RGB + Thermal
Visual defect detection
Dual optical and infrared cameras capture 20MP+ visual frames alongside thermal imagery. AI identifies cracks, coating breakdown, refractory spalling, hotspots indicating internal degradation, and cool-spot patterns revealing refractory failure. This is the baseline payload — every flare inspection starts here.
Payload B
Ultrasonic Thickness Probe
Contact NDT at elevation
Omnidirectional aerial platforms carry high-temperature UT probes that make stable contact with the stack surface and record wall thickness. This is the payload that replaces the rope-access technician entirely for thickness measurement. Detects wall thinning, pitting, and stress corrosion cracking in early stages — the API 510 and API 653 data auditors expect.
Payload C
Pulsed Eddy Current (PEC)
Corrosion under insulation
PEC sensors mounted on aerial platforms detect corrosion under insulation and subsurface material loss without requiring insulation removal. Critical for stacks with jacketed sections or coated shells where visual inspection alone will miss the actual problem. Non-contact measurement of thickness and corrosion levels at elevation.
The Real Comparison
Traditional Flare Inspection vs. Drone Mission — Line by Line
The pitch for drone inspection is easy to overstate. Here is the honest side-by-side, based on a 200-foot in-service flare inspection documented at a California refinery in a widely-cited case study, and the wider industry data on scaffolded and rope-access alternatives. Every row below reflects data operators have publicly reported or figures that appear consistently across multiple vendor case studies in the 2024 to 2026 window. Individual results vary by stack height, coating type, and inspection scope, but the direction and order of magnitude are consistent across the industry.
Line Item
Traditional Method
Drone Mission
Stack shutdown required
Yes — full cooldown
No — inspect in service
Setup time
3 to 8 days scaffolding
30 minutes mission planning
Inspection duration
3 to 5 weeks total
2 hours
Crew size
Riggers, crane operator, technicians
Pilot plus optional NDT operator
Fall exposure
Every technician, every shift
Zero
Cost per stack
$150K to $250K+
$3K to $8K
Production downtime
Weeks of lost flare capacity
None
Coverage completeness
Only what technicians can reach
Full 360° surface, every zone
Model the Savings on Your Own Flare Portfolio
iFactory will build a stack-by-stack cost model from your current inspection contracts and turnaround schedule. Most operators recover the drone program cost inside the first flare inspection replaced.
Mission Workflow
What Happens Between "Schedule Inspection" and "Work Order Approved"
A live-flare inspection is not a hobbyist drone flight. It is a regulated mission with specific safety envelopes, pre-flight checks, and AI-driven post-processing. Here is the honest, sequential picture of what happens from mission scheduling to defect handoff. The timings below are drawn from actual documented inspections and reflect what a well-run program looks like on a mature flare portfolio — first-time inspections take somewhat longer while the baseline 3D model and defect registry are being established, but the steady-state cadence lands in the ranges shown.
08:00
Pre-flight and Airspace Clearance
Weather API confirms flight window. Airspace clearance verified against real-time restrictions. Flight path uploaded to the drone. Ground crew briefed on mission zones, communication protocol, and safety envelope around the live flare.
08:30
Thermal and Visual Sweep
Drone flies concentric passes around the stack at decreasing standoff. RGB and thermal frames captured at consistent altitude and angle for cycle-over-cycle comparison. Tip, upper refractory, and shell surveyed in a single continuous flight.
09:15
Contact NDT (If Scheduled)
UT probe drone deployed for thickness measurements at pre-determined grid points. Omnidirectional platform makes stable contact at each measurement location. Data streams live to the ground station for integrity verification.
10:00
Mission Complete, Data Uploaded
Aircraft returns to launch. Raw imagery and NDT data uploaded to the processing pipeline. Ground crew debriefs and confirms coverage. Total flight and setup time from arrival to mission complete: approximately two hours.
Overnight
AI Defect Analysis
Computer vision models run across every frame. Defects classified by type, severity, and location on the 3D stack model. Change detection compares against the prior inspection cycle. Confidence scores flag ambiguous findings for human review the next morning.
Day 2
Report, Triage, Work Orders
Ranked defect list surfaced with imagery, 3D location, severity, and recommended action. Maintenance lead reviews and approves. Approved defects push directly to CMMS as prioritized work orders — same-day handoff to the maintenance queue.
Documented Outcomes
What Operators Are Reporting After the First Live Flare Mission
The two cases below are drawn from publicly documented industry deployments. They matter because they establish the outer envelope of what is possible on a live flare stack with current drone and payload technology — the first captures the cost side of a routine in-service inspection, and the second captures the pure duration compression on an extreme-height stack. Both are consistent with the wider operator data collected across 2024 and 2025.
3 days to 2 hours
California refinery, 200-foot flare stack
Ultrasonic thickness measurements collected in-service using a drone-mounted UT probe. Reduced necessary crew size, eliminated crane operator requirement, and closed the mission in about two hours versus the typical three-day scaffolded window. Documented savings around $150,000 on a single stack.
160m stack in 1 day
One of the world's tallest flare stacks
Traditional inspection method required 3 to 5 weeks of manual labor including cooldown, scaffolding, and rope-access climbing. A single drone equipped with RGB and thermal payload completed the survey in one day, capturing multi-angle high-resolution data across the entire stack elevation.
Defect Library
What the AI Is Actually Trained to Find on Your Flare Stack
A drone that just captures pretty images is a photography service. What makes a flare inspection program valuable is the defect library — the trained classification engine that turns raw imagery into a ranked, actionable list of findings. iFactory's AI is trained on flare-specific defect classes across four categories, each one drawn from thousands of labeled examples across live refinery operations. This is what shows up on a first-cycle inspection report, and it is what separates a mature industrial drone platform from a generic aerial photography service. The four categories below cover every failure mode the API 510 and API 653 inspection standards ask you to track.
Structural
Cracks, Weld Discontinuities, Shell Deformation
Longitudinal and circumferential weld crack detection, stress corrosion cracking, shell out-of-roundness, and structural deformation caused by thermal cycling. Detected at sub-millimeter resolution using high-magnification visual imagery combined with ultrasonic thickness data at grid points. Ranked by severity and mapped to the 3D stack model with historical trend lines.
Corrosion
External Corrosion, Pitting, and Corrosion Under Insulation
External corrosion patches, deep pitting, coating breakdown, and CUI on jacketed sections. Visual and thermal imagery flag surface corrosion; PEC payloads quantify subsurface metal loss under insulation without removing the jacket. AI classifies severity per API 653 categories and compares against the prior cycle to measure corrosion rate.
Refractory
Erosion, Spalling, and Thermal Damage
Refractory erosion in the upper stack, spalling patterns, thermal shock damage, and lining separation. Cool-spot patterns in thermal imagery reveal refractory failure that visual inspection alone would miss. Severity ranked against remaining refractory thickness and prioritized against next planned turnaround window.
Ancillary
Tip Wear, Pilot Failures, Ancillary Systems
Flare tip erosion and burner wear, pilot ignition assembly condition, windshield damage, guy-wire tension anomalies, ladder cage integrity, and lightning protection continuity. The small-parts findings that used to only surface during turnaround inspection but drive most incident reports when left untracked between cycles.
Turnkey AI Deployment
How iFactory Ships a Flare Inspection Program
Standing up a flare inspection drone program is not something you install from a package. It is aircraft, high-temperature payloads, certified pilots, AI defect models trained on refinery imagery, and integrations to your CMMS and turnaround planning stack. iFactory delivers this as a turnkey system so your first live-flare mission runs inside eight weeks, not the following fiscal year. The four cards below cover the actual scope of the deployment — what ships, what integrates, when it goes live, and how your team interacts with the system once it is running.
01
Hardware and Software Together
Pre-configured NVIDIA AI server for defect processing ships racked and ready. Drone fleet configured with the right thermal, UT, and PEC payloads for your flare portfolio. AI vision models pre-trained on flare stack defect libraries. Rack it, plug power and Ethernet, and the AI is live.
02
Full Integration Scope
Network cabling, PLC and SCADA hookup, CMMS connector setup, operator training, and 24 by 7 remote monitoring. Everything between the drone landing pad and the maintenance planner's screen — no separate integrator scope required.
03
Live in 6 to 12 Weeks
Three-phase rollout — pilot mission on one flare in six weeks, full portfolio coverage by week ten, autonomous inspection loop live by week twelve. Trusted by 1,000+ clients with 99.9 percent uptime across the platform stack.
04
Operator-Friendly AI
Your maintenance lead types: "Show me new refractory erosion on flare two since last inspection." The system returns imagery, coordinates on the 3D stack model, and severity ranking. No computer vision expertise required to run the program.
Buyer Questions
Flare Stack Drone Inspection — Common Questions
Can a drone really inspect a flare stack while it is actively burning?
Yes, and this is the highest-value use case for drone inspection in oil and gas. Thermal-payload drones capture RGB and infrared imagery of flare stacks operating at temperatures near fifteen hundred degrees Fahrenheit without any human exposure to heat or emissions. High-temperature UT probes make contact measurements on the stack shell below the combustion zone during active operation. A documented California refinery case study collected ultrasonic thickness measurements on an in-service 200-foot flare in about two hours, replacing a three-day scaffolded process and saving roughly one hundred fifty thousand dollars on a single mission.
Book a demo to see the live-flare workflow on your own stacks.
Does drone NDT actually satisfy API 510, API 570, and API 653 inspection requirements?
Drone-mounted ultrasonic thickness probes deliver contact NDT measurements that meet the same measurement standards as handheld UT gauges — the standard tools used to satisfy API 510 for pressure vessels, API 570 for piping, and API 653 for storage tanks. What changes is the delivery method, not the measurement quality. Regulatory bodies increasingly recognize drone-collected NDT data when it is generated by certified operators using calibrated payloads and preserved in an auditable registry with imagery, timestamps, and 3D location. The compliance envelope is fully covered as long as your provider follows the same qualification and documentation practices required for traditional NDT.
How do drone inspections handle corrosion under insulation on jacketed stacks?
Corrosion under insulation is the exact use case pulsed eddy current payloads are built for. PEC sensors mounted on aerial platforms detect subsurface material loss and thickness changes without removing insulation or coatings, which was previously the only way to access CUI data at elevation. This eliminates the enormous scaffolding and insulation-removal cost that made routine CUI monitoring impractical on tall stacks. The measurement is non-contact from the sensor perspective but stable enough to produce actionable thickness data across insulated sections.
Contact support for the PEC coverage envelope on your specific stack configuration.
What is the honest weather envelope for a flare stack drone inspection?
Industrial-grade drones handle winds up to twenty to twenty-five knots and light drizzle without compromising imagery quality or safety envelope. Heavy rain, dense fog, or sustained high winds will pause a flight. Because flare stacks sit at elevation and are already surrounded by combustion updraft, mission planning always includes local weather modeling around the stack itself, not just the ground-level forecast. The iFactory platform integrates live weather APIs and historical climate data to identify optimal inspection windows before the mission is scheduled, which is why weather-driven cancellations are rare and rescheduling happens in hours rather than the days a rope-access reschedule would take.
Can we integrate drone flare inspection into our existing turnaround planning process?
This is often the biggest process win, larger than the per-inspection cost savings. Because drone inspections happen in-service, defect data is available months before the turnaround planning cycle, so scope is set from actual condition rather than assumed condition. Refractory replacement, weld repairs, and shell interventions get scheduled against real thickness trends and severity progression. Turnaround budgets tighten, scope surprises drop, and post-turnaround inspection can happen the same week the flare goes back into service to verify repairs. Drone inspection data flows into iFactory's CMMS integrations and directly into the planning tools your turnaround team already uses.
Stop Cooling Down Flares Just to Inspect Them
AI drone inspection for flare tips, refractory linings, structural welds, and full vent systems — with in-service missions, NDT-grade thickness data, CMMS integration, and zero climbers at height. Book a demo to see it running on your flare portfolio, or contact support to get a stack-by-stack cost model built from your current inspection contracts and turnaround schedule.