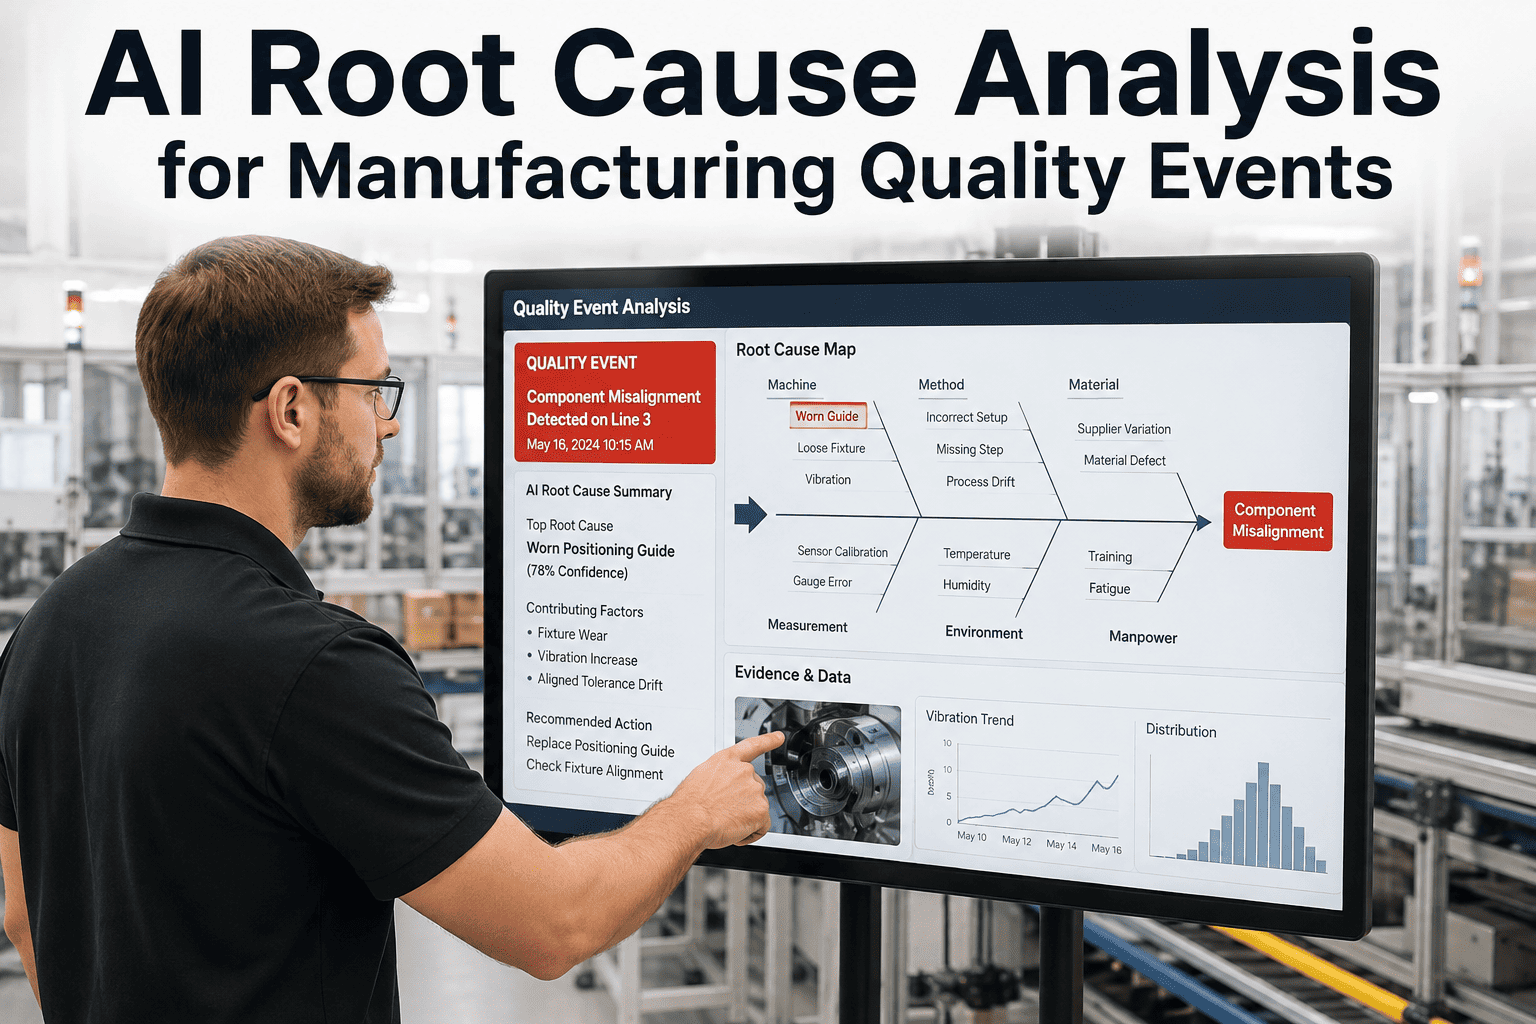
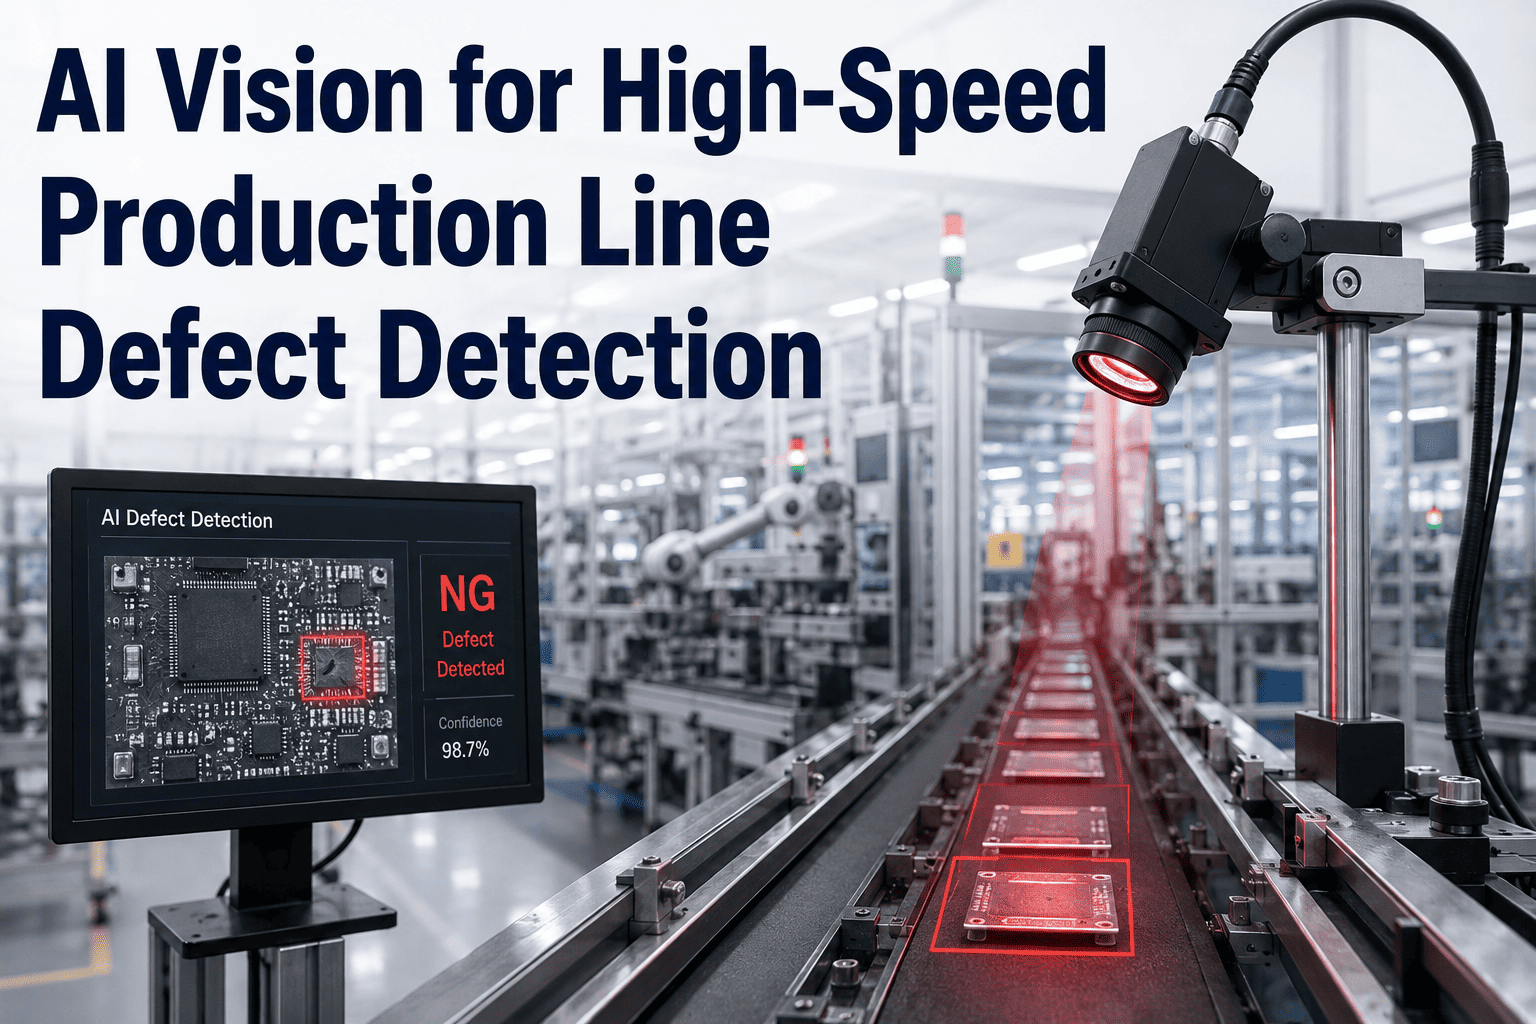
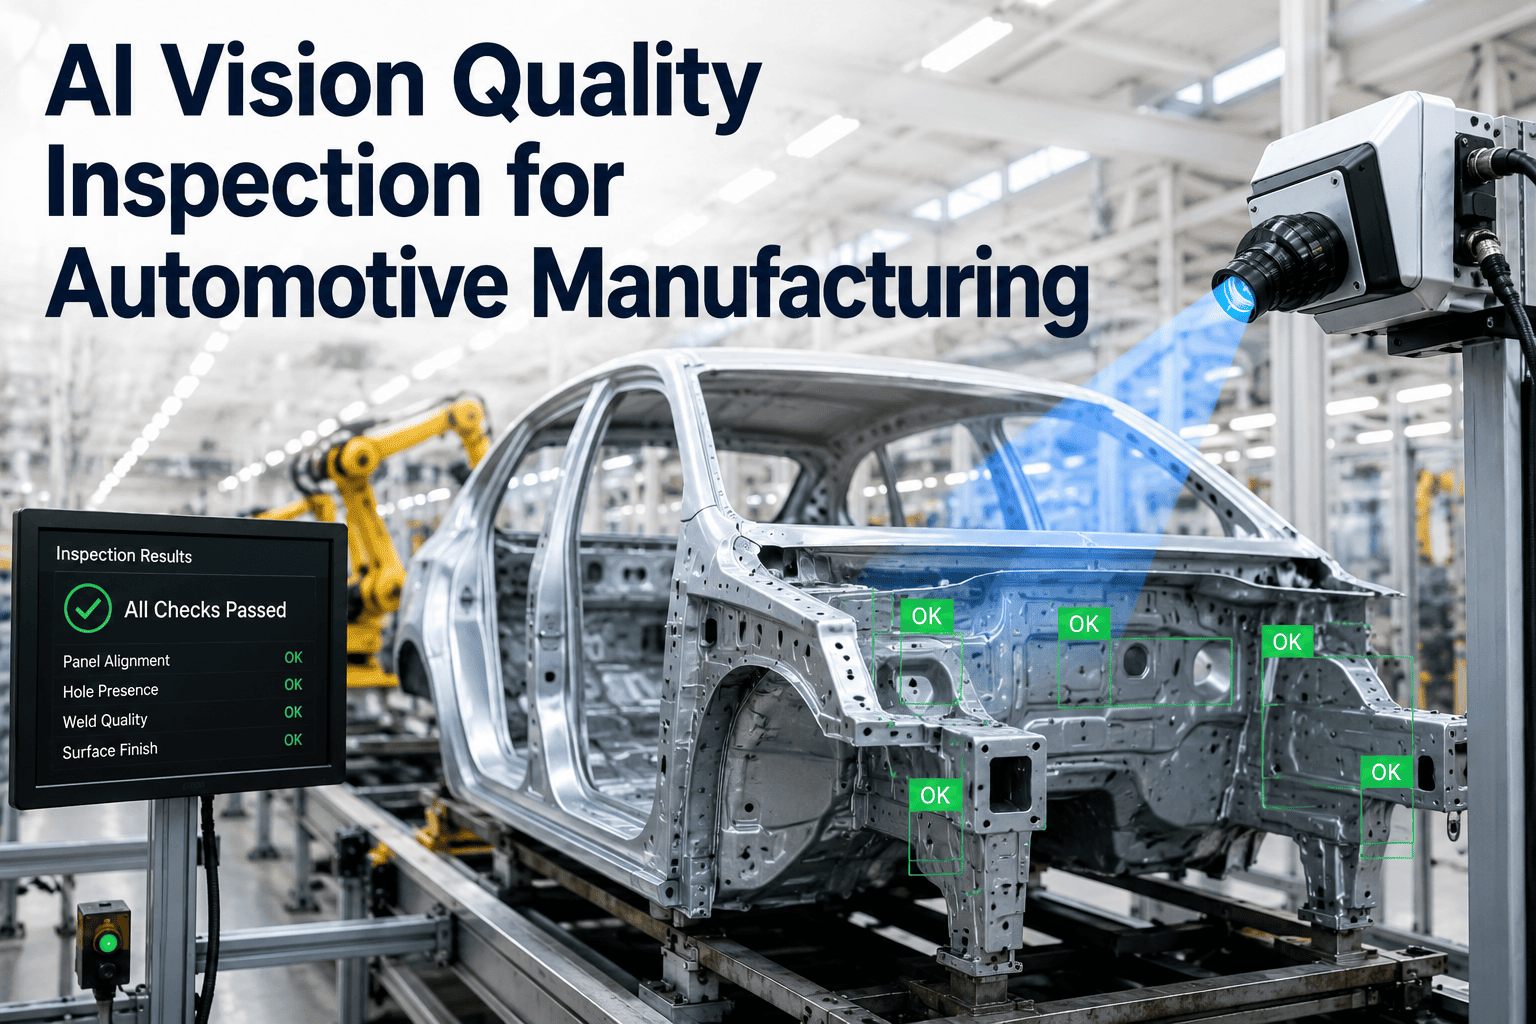
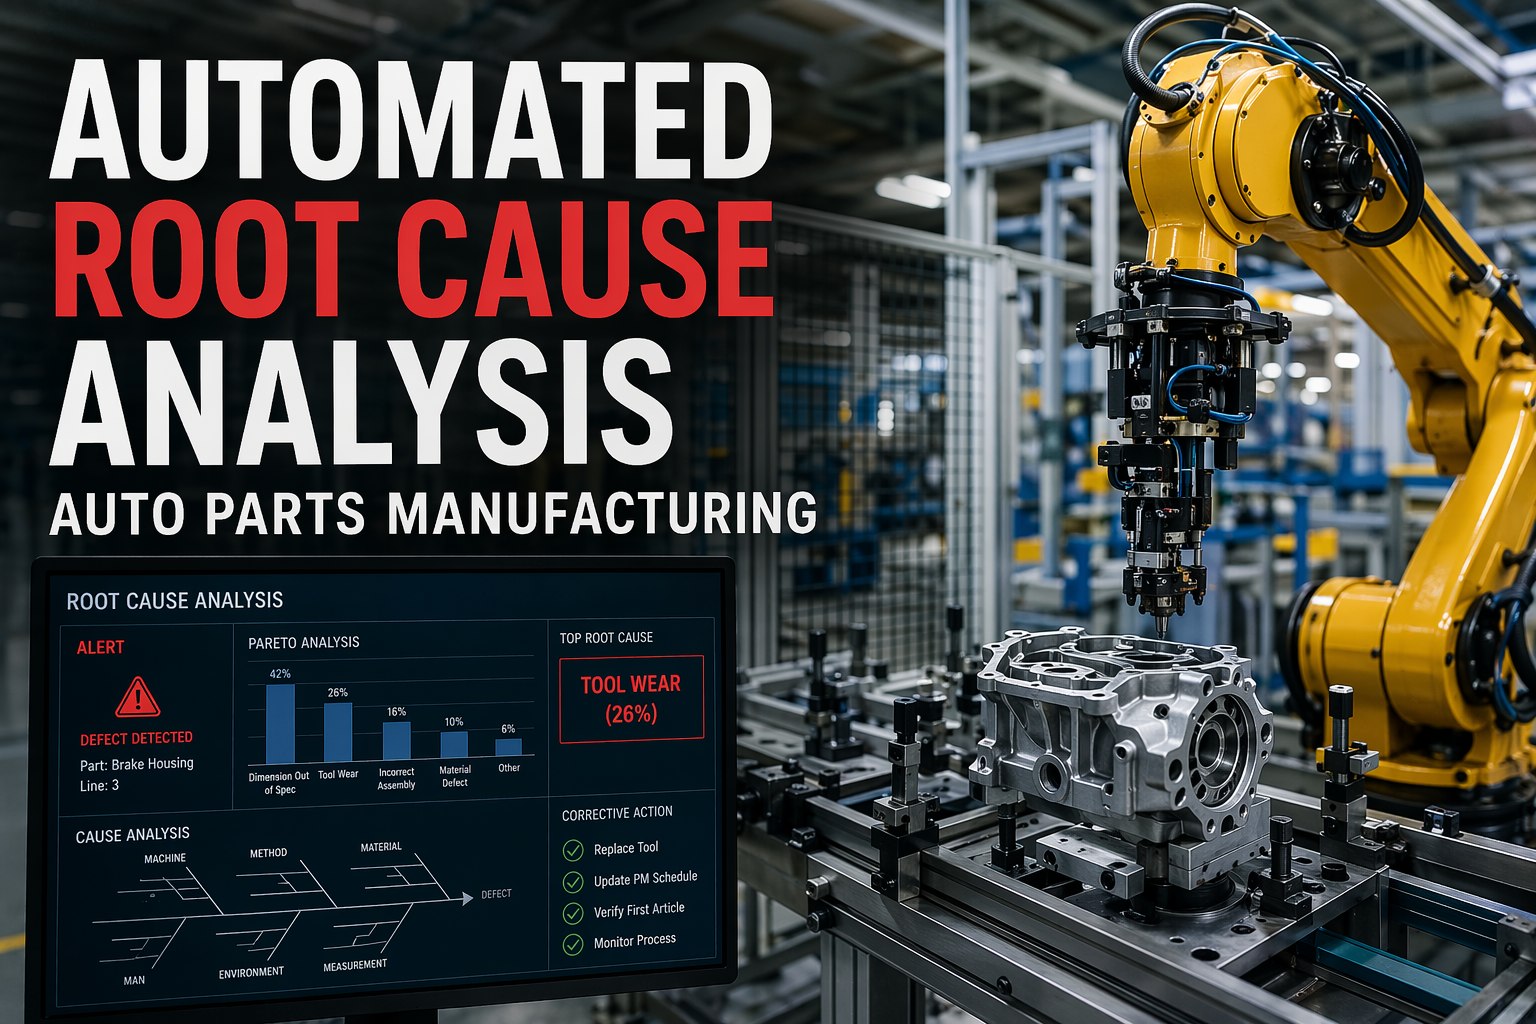
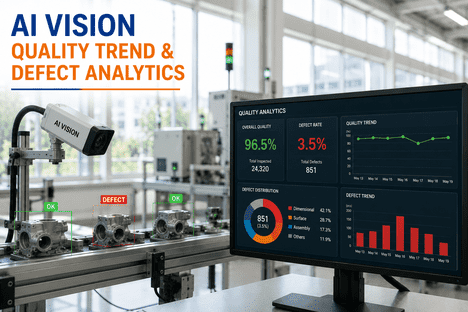
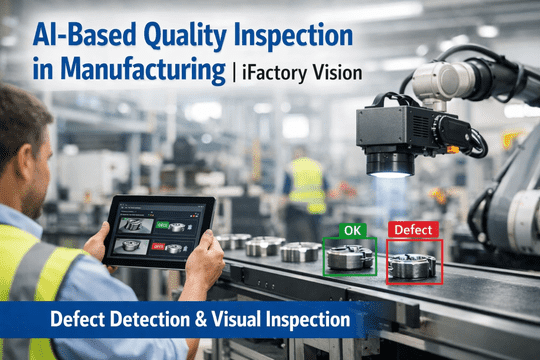
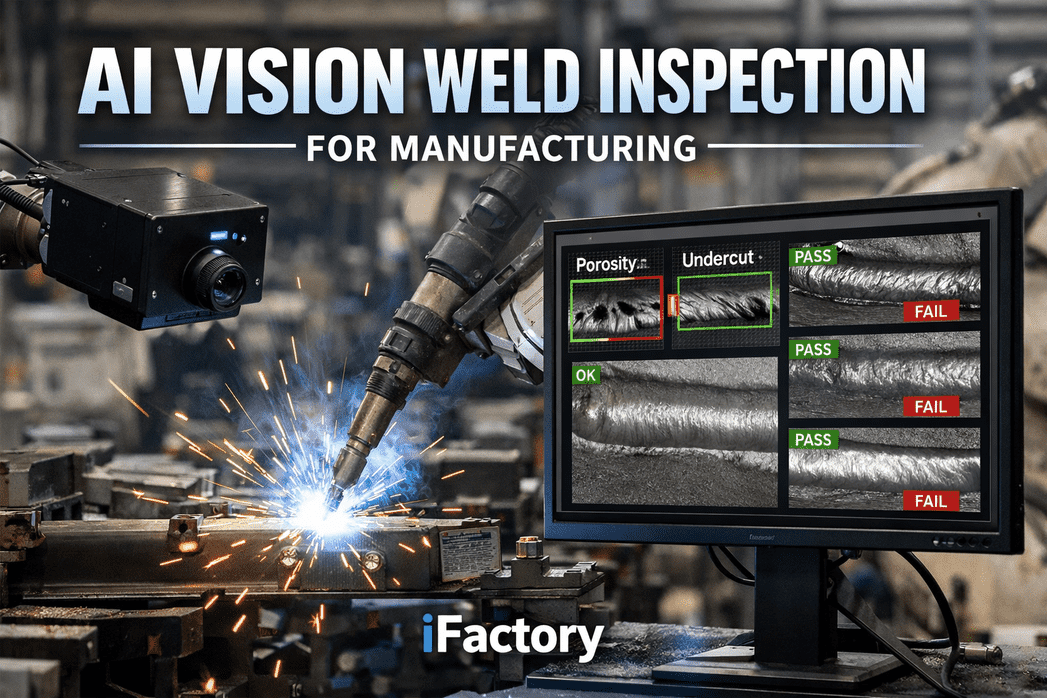
When a defect appears on a manufacturing line, the real cost is not the scrap part itself, it is the days or weeks the plant spends guessing why it happened. Quality engineers pull spreadsheets, maintenance argues with process, and the shift log tells a different story than the SCADA export. Meanwhile the same defect keeps repeating because nobody has connected the actual sequence of upstream events to the moment quality failed. AI root cause analysis compresses that entire investigation into minutes by continuously correlating sensor data, machine logs, quality inspection results, and operator actions, then narrating exactly which upstream signals preceded each defect. iFactory turns fragmented process data into a ranked list of probable causes with confidence scores, so the engineer starts the day knowing where to look, not guessing. You can book a demo to walk through your own defect history and see the correlations already sitting in your data.
AI RCA · QUALITY EVENTS · MANUFACTURING INTELLIGENCE
Turn Every Defect Into a Timestamped, Explainable Story
iFactory ingests every sensor reading, PLC signal, inspection result, and operator action across your line, then automatically reconstructs the narrative behind each quality event, ranked by confidence and ready for corrective action.
14 days
Typical manual root cause investigation time
2 hours
Time to root cause with continuous AI correlation
up to 20%
Share of total sales revenue lost to defect-related costs
10x
Data processing speed vs traditional RCA methods
THE PROBLEM WITH TODAY'S QUALITY INVESTIGATIONS
Why the Same Defect Keeps Coming Back After Every Kaizen Event
The reason repeat defects persist in most plants is not a lack of effort, it is a structural gap in how investigation data is collected. Quality engineers get the defect record. Maintenance gets the machine log. Process engineering gets the SCADA history. Each team analyzes their slice, writes a report, and closes the ticket, but nobody has assembled the full sequence of upstream events into one timeline. The defect recurs because the actual causal chain, which may span three shifts, two operators, one silent sensor drift, and a coolant temperature swing at 3 AM, was never reconstructed end to end. Kaizen events surface plausible contributing factors, but plausibility is not proof, and without continuous data joining every sensor stream to every quality outcome the team is essentially picking the most confident-sounding hypothesis in the room and hoping the defect stops repeating. When it repeats anyway, the cycle begins again with a fresh investigation that ignores what the last one found because none of that evidence was captured in a form the next engineer can query.
Siloed Data Sources
Quality, maintenance, and process data live in separate systems that are rarely joined on a common timeline for the exact minute a defect occurred.
Sample-Based Inspection
Quality checks cover a small percentage of production, so most defect events are logged in aggregate without the granular context that would reveal the cause.
Human Memory Limits
By the time a repeat defect is escalated for RCA, the operators and conditions from the original event window are days or weeks in the past.
Multivariate Blindness
Manual investigation typically tests one variable at a time, while the actual cause is often an interaction between three or four parameters within a narrow window.
HOW AI RCA WORKS END TO END
The Five-Stage Pipeline That Turns Sensor Data Into a Ranked Cause List
An AI root cause analysis engine is not a black box that guesses. It is a defined analytical sequence that moves from raw data ingestion to a ranked, explainable output that a quality engineer can act on within the same shift.
01
Continuous Data Ingestion
Every sensor value, PLC state change, inspection result, MES transaction, and operator log entry is streamed into a unified time-series store with millisecond precision.
02
Quality Event Detection
The system marks the exact timestamp of each defect from inspection systems, machine vision, or manual entry, and defines a lookback window of relevant upstream signals.
03
Multivariate Correlation
Machine learning models score every candidate variable in that window against the defect outcome, isolating the parameters whose deviation most strongly precedes failure.
04
Ranked Cause Narrative
The engine outputs a plain-language quality event narrative naming the top contributing factors, each with a confidence interval and the exact time window of deviation.
05
Corrective Action Loop
Recommended actions are dispatched to maintenance or quality, executed, and the outcome is fed back so the model refines its confidence for the next similar event.
See a Quality Event Reconstructed From Your Own Data
Bring a single recurring defect from your line to the demo. iFactory will show how the platform would reconstruct the causal chain and produce a ranked cause list from your existing sensor and inspection history.
ANATOMY OF A QUALITY EVENT NARRATIVE
What the AI Actually Writes When a Defect Is Logged
A quality event narrative is the human-readable output of the correlation engine. Instead of dropping a spreadsheet on the engineer's desk, the system assembles the causal chain into a paragraph that answers the four questions every RCA has to answer: what happened, when the contributing conditions started, which upstream variables deviated, and how confident the model is in the ranking.
Event
Dimensional out-of-tolerance flagged on Line 3, Station 4 at 14:22 UTC. Batch 8841, unit 217 of 400.
Primary cause
Coolant supply temperature drifted 3.2 degrees above setpoint starting 42 minutes before first out-of-spec unit. Confidence 87 percent.
Secondary factor
Spindle load variance increased 18 percent in the same window, consistent with reduced coolant effectiveness. Confidence 71 percent.
Ruled out
Operator changeover, tool wear cycle, and material batch variance showed no significant deviation in the event window.
Recommended action
Inspect chiller unit CH-02 for capacity degradation. Similar signature preceded the recurring event on 12 March.
MANUAL VS AI-DRIVEN RCA
What Actually Changes When Correlation Runs Continuously
The comparison below is drawn from the two workflows side by side on the same recurring defect. The difference is not that AI is faster at doing the same thing, it is that AI performs a class of analysis, continuous multivariate correlation across every unit, that manual methods cannot reasonably attempt.
WHERE AI RCA CHANGES THE ECONOMICS
Four Outcomes That Show Up Directly in the P&L
The value of continuous root cause analysis is easy to intuit but easier to justify when it is broken into the specific line items it moves. Each of the four outcomes below has been documented across discrete and process manufacturing deployments, and each maps to a budget line that a plant controller or operations director already tracks month over month. The pattern that shows up most consistently is that the largest single gain is not in any one category but in the compounding effect of faster investigations feeding into cleaner CAPAs feeding into fewer recurrences, so the total impact typically outpaces what any individual line item would predict on its own.
01
Scrap Reduction
Once the causal chain of a repeat defect is identified and corrected, scrap rates on that specific defect typically drop by 60 to 90 percent within the first two production cycles after the fix.
02
Investigation Labor
Quality engineering hours spent on RCA drop sharply because the initial hypothesis is delivered by the system, so engineers move directly to validation and corrective action rather than data collection.
03
Line Uptime
Precursor signatures of past defects can be flagged before scrap accumulates, converting reactive line stoppages into planned interventions during a shift changeover or scheduled break.
04
CAPA Effectiveness
Corrective and preventive actions are grounded in ranked, quantified causes rather than the strongest opinion in the meeting room, which reduces the rate of failed CAPAs and repeat findings.
WHICH MANUFACTURING ENVIRONMENTS BENEFIT MOST
Where the Data Density Justifies Continuous Correlation
AI root cause analysis returns the largest gains in operations that produce enough units per day that manual sampling misses meaningful patterns, and where quality events carry material cost consequences per occurrence.
Automotive Parts & Assembly
Dimensional tolerances, weld integrity, and surface finish defects driven by multivariate process interactions across machining, stamping, and joining operations.
Electronics Assembly
Solder joint failures, component placement accuracy, and functional test failures where reflow profile, humidity, and paste viscosity interact in narrow windows.
Food & Beverage Processing
Fill volume variance, seal integrity, contamination events, and cook or CIP parameter deviations that cascade into batch quality holds.
Pharma & Life Sciences
Deviation investigations, batch record anomalies, and environmental excursions where regulatory traceability makes documented, defensible RCA essential.
Metals & Machining
Diameter, roundness, and surface roughness variance driven by coolant, spindle, tool wear, and material batch interactions in high-mix machining cells.
Injection Molding & Plastics
Short shots, flash, sink marks, and dimensional drift correlated to melt temperature, cavity pressure, cycle time, and material moisture content.
WHAT DATA THE SYSTEM ACTUALLY NEEDS
The Signal Inventory Most Plants Already Have
One of the more common blockers to starting AI RCA is the assumption that a new sensor rollout has to precede any value. In practice, the correlation engine begins producing useful narratives with the data most production environments are already generating and simply not joining together.
01
Machine Sensor Streams
Temperature, pressure, vibration, current, flow, and cycle-time signals already pulled by PLCs, SCADA, or historians on the equipment.
02
Quality Inspection Records
Automated inspection results, CMM measurements, machine vision outputs, and manual QC log entries with timestamps and unit identifiers.
03
MES & Batch Records
Recipe parameters, batch genealogy, changeover events, operator IDs, and material lot data that provides context for every production event.
04
Maintenance History
Work order records, calibration events, and equipment condition logs that anchor quality events against maintenance state.
05
Environmental & Utility Data
Ambient temperature, humidity, compressed air pressure, coolant temperature, and power quality that often drive subtle process shifts.
Start With the Data You Already Have
Most plants have three to five years of untapped sensor and quality data sitting in historians and inspection systems. iFactory can begin producing correlation results from that history within the first two weeks of a pilot.
ROLLOUT REALITY
What the First 12 Weeks of an AI RCA Deployment Looks Like
A realistic deployment does not require a plant-wide rebuild before the first insight lands. The pattern below is what iFactory teams have refined across manufacturing verticals to move from signed contract to defensible root cause outputs on a single production line inside a quarter.
Weeks 1 to 4
Data Connection & Historical Load
Connect existing historian, MES, and inspection systems. Load 12 to 24 months of historical data. Confirm data quality and timestamp alignment across sources.
Weeks 5 to 8
Model Training on Priority Defects
Select two or three high-cost recurring defects. Train correlation models on historical event windows and validate against known past causes to establish confidence.
Weeks 9 to 12
Live Narrative Delivery & Handoff
Begin generating live quality event narratives to the quality team. Tune alert thresholds, integrate with CAPA workflow, and train engineers on interpreting confidence scores.
FREQUENTLY ASKED QUESTIONS
What Quality and Operations Leaders Ask Before Committing
How does AI root cause analysis differ from traditional five-why or fishbone methods?
Traditional five-why and fishbone analysis are structured human reasoning tools that depend on the investigator already having a hypothesis about which categories of cause to explore. AI RCA inverts the process by starting from the full set of measured variables and letting the data itself surface which parameters preceded the defect, then presenting those findings in ranked form for the engineer to interpret. The two approaches are complementary in practice, with AI providing the ranked candidate list and the engineer using structured reasoning to validate the mechanism. You can
book a demo to see the outputs delivered alongside a structured investigation template.
Do we need clean, labeled data before AI RCA can produce useful results?
The system produces its first useful correlations from the data that most plants already have, even when that data is imperfect or unevenly labeled. What matters most in the first phase is timestamp alignment across systems and reliable defect event marking, since those two elements anchor every downstream correlation. Data cleanup and richer labeling improve confidence over time but are not blockers to starting. Our team can
assess your current data readiness before any commitment and describe what the first correlations would look like on your existing history.
How do we validate that the AI's ranked cause is actually correct?
Every ranked cause is delivered with a confidence interval, the specific time window of the deviation, and the underlying signal trace, so an engineer can inspect the evidence rather than accepting a black-box output. In the pilot phase, models are trained on historical events where the root cause is already known, so the accuracy of the ranking can be measured directly before the system is trusted with live events. Over time the corrective action outcomes feed back into the model, which continues to refine its confidence scoring. You can
book a demo to walk through a worked validation example.
What happens when the true root cause is a variable we are not measuring?
In that situation the system will still surface the strongest correlated proxy variables it does have visibility into, and it will typically flag lower confidence scores across all candidates as a signal that the true cause may lie outside the current instrumentation scope. This itself is a valuable output because it identifies exactly where additional sensing would close a blind spot. From there a targeted, low-cost sensor addition can be scoped rather than a plant-wide instrumentation project. Our support team can
help identify likely sensing gaps in a specific process area.
How does this integrate with our existing CAPA and quality management workflow?
The AI-generated quality event narrative is designed to feed directly into an existing CAPA record as the initial investigation output, with the ranked causes, confidence scores, and evidence traces attached as supporting documentation for auditors and quality reviewers. Integrations are available for common quality management systems so the narrative and its evidence chain flow into the CAPA workflow without duplicate data entry. The engineer retains full authority over which cause is accepted and which corrective action is taken. You can
book a demo to review the CAPA integration on a live workflow.
Stop Investigating the Same Defect Every Quarter
Every repeat defect has a signature buried in your existing sensor and inspection data. iFactory finds it, ranks it, and hands your team the narrative to close the CAPA for good. Bring one recurring quality problem to the demo and see the answer.