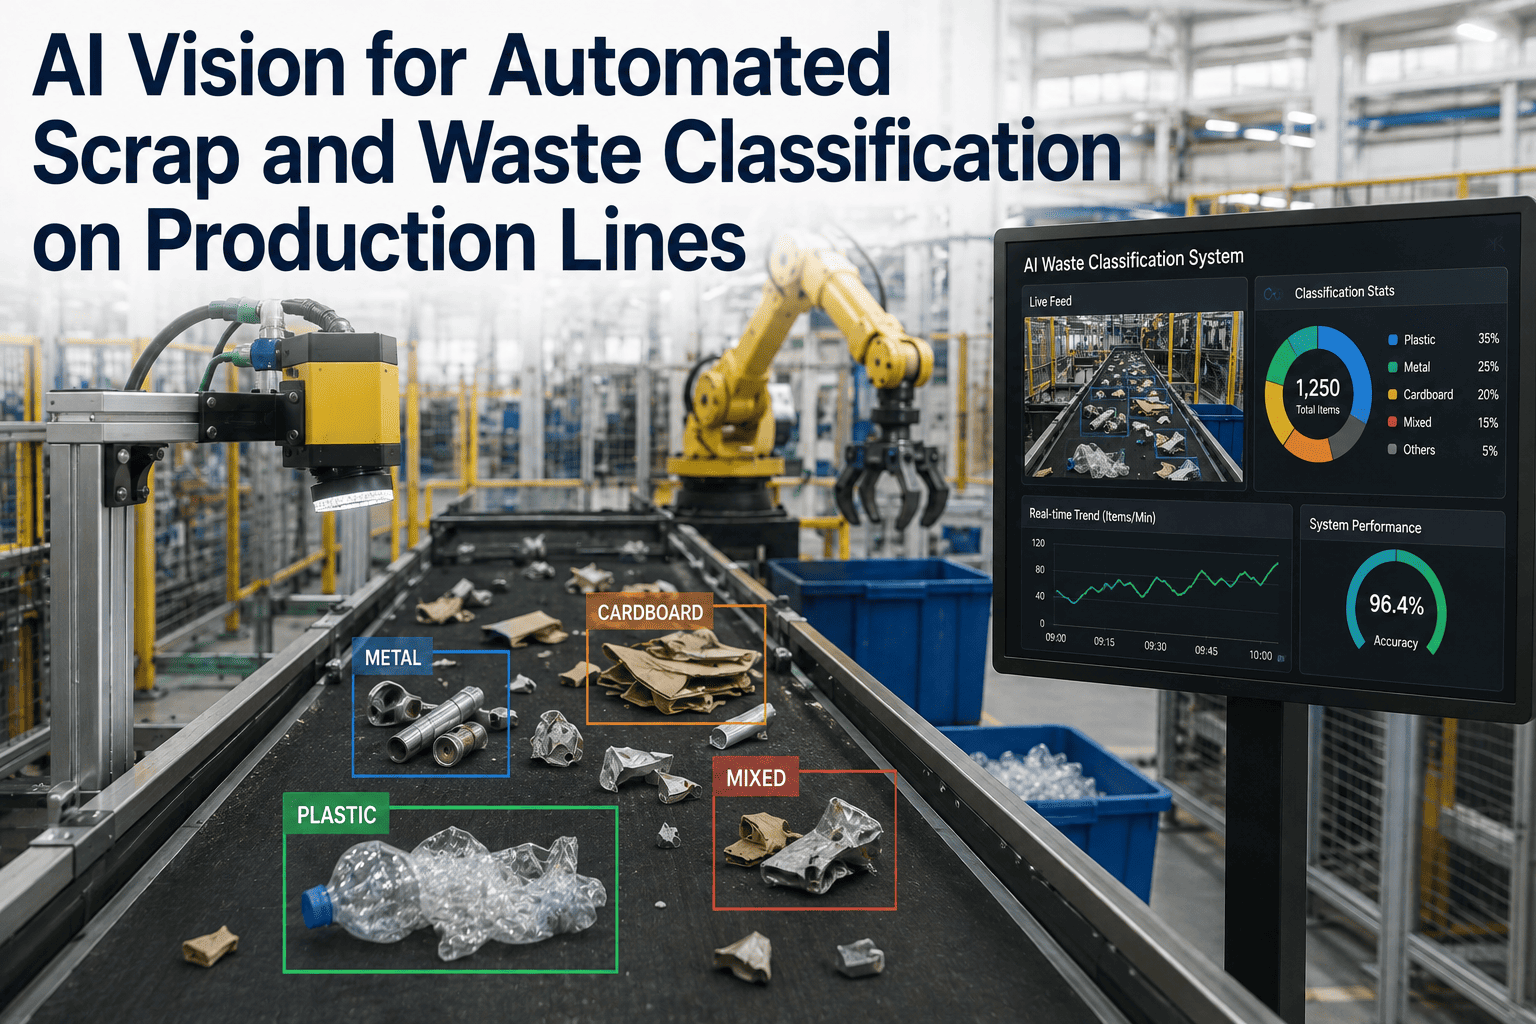
Most plants know their scrap rate. Almost none know why the scrap happened — because a rejected part gets pulled off the line, dropped in a bin, and its story ends there. The scrap rate reported by most plant ERPs is typically 30 to 50% lower than the actual quality loss on the floor, and the gap is not dishonesty — it is simply that nobody is capturing defect type, location, and cause at the moment of rejection. AI vision changes that. A camera at the reject station classifies every scrapped part by defect type automatically, timestamps it against the machine and shift that produced it, and feeds that structured data into root cause analysis that finds your top scrap drivers in days instead of quarters. Book a demo to see automated scrap classification running on a live production feed.
Every Scrapped Part Has A Story. Stop Throwing It Away Unread.
iFactory's AI vision cameras classify rejected parts by defect type the instant they hit the reject bin — no manual tagging, no end-of-shift paperwork. That classification data feeds directly into root cause analysis, so your top three scrap drivers surface in days, not quarterly audits.
The Real Cost Of Scrap Nobody Is Measuring Correctly
A part scrapped at the fourth of five operations does not just cost its raw material — the material cost typically represents only 25% of the true scrap cost. The other 75% is invisible in most accounting systems: applied labor across every completed operation, machine time, energy, and the opportunity cost of running a defective part through capacity that could have made a good one. Industry benchmarks put general industrial scrap-to-sales in the 1.5% to 2.5% range, medical device manufacturing at 2.5% to 4.0% due to zero-tolerance rework restrictions, and top-quartile shops below 1.0% — but the number your ERP reports is rarely the honest one.
The reason the honest number stays hidden is not deliberate underreporting — it is a measurement gap. Rework, which is often booked separately from scrap because the part eventually shipped, quietly absorbs cost that never shows up in the scrap line. Downgrades, where a part fails Grade A specification but still sells at a lower margin as Grade B, represent real revenue and quality loss that the scrap rate metric never captures at all. A plant measuring scrap honestly for the first time — counting parts scrapped, rework hours at fully-loaded rate, and re-runs displacing other revenue work — routinely finds the real number is 1.5 to 2 times what the management report shows. That gap is exactly what structured, automated classification data closes.
Why "We Have A Scrap Problem" Never Gets Fixed
Every plant manager knows the scrap rate number. Almost none can answer the next question — which defect type, on which machine, during which shift, is driving most of it. The reason is structural, not a lack of effort. Manual scrap logging depends on an inspector writing a defect code on a tag, and that single point of failure breaks down predictably.
Defects Are Discovered Hours Late
In most factories, defects aren't caught when they start — they surface at end-of-line inspection, hours after the root cause has already produced hundreds of bad parts. The root cause isn't people or materials; it's timing.
Human Classification Accuracy Has A Ceiling
Documented human defect-classification accuracy sits around 60 to 70% under normal inspection volume, and manual inspection error rates of 20 to 30% are common once fatigue and subjectivity are factored in across a full shift.
Defect Codes Get Simplified Under Pressure
Under production pressure, a tired inspector tags a part "reject — misc" instead of the specific defect subtype. The category exists in your system, but the data that would make it useful never gets captured.
Root Cause Analysis Becomes A Quarterly Project
Without structured, timestamped defect data, tracing a scrap spike back to a specific tool or process drift means searching inspection logs and shift notes by hand — a process that can consume days for a single multi-stage failure.
How AI Vision Classifies Every Rejected Part Automatically
The camera at your reject station is already watching every part that gets pulled off the line — it just isn't structured data yet. iFactory's AI vision classification layer turns that raw footage into a defect taxonomy your quality team already uses, captured automatically at the moment of rejection with zero manual tagging.
Image Classification
Categorizes the entire rejected part as defective or non-defective and assigns a top-level defect class — the fastest classification method, well suited to clear-cut, single-defect rejections at high line speed.
Object Detection
Localizes the defect with a bounding box, identifying exactly where on the part the flaw appears — adding the spatial context that traceability and rework routing decisions actually need.
Image Segmentation
Isolates the defect region down to the pixel level, enabling precise measurement and classification of irregularly shaped anomalies — the method root cause analysis needs when defect severity itself matters.
iFactory's deep learning classification models handle 10 to 50 distinct defect categories per model, with multi-output architectures that classify both defect type and severity simultaneously — trained on your actual production images, typically in under an hour. Book a demo to see the taxonomy built against your real defect history.
From Rejected Part To Root Cause: The Closed-Loop Data Flow
Classification alone does not reduce scrap — it is what happens after classification that closes the loop. Every rejected part carries defect type, location, timestamp, machine ID, and shift data the moment the camera captures it, and that structured record is what turns "we have a scrap problem" into "Line 3, Tool 7, second shift, tolerance drift starting Tuesday."
Part Rejected At The Line
The reject signal fires from existing line control — no change to your current pass/fail logic required.
AI Camera Classifies The Defect
Defect type, severity, and location are captured automatically at the moment of rejection.
Record Tagged To Machine & Shift
Classification links to asset ID, batch, camera view, and shift — full traceability with zero manual entry.
Trend Analytics Surface Patterns
Recurring defect types and severity distributions correlate against production parameters automatically.
Root Cause Identified, Fed Back To Process
The top scrap driver gets a work order or process adjustment — closing the loop at the source, not the reject bin.
Manual Scrap Logging vs. AI Vision Classification
The gap between the two approaches is not a marginal efficiency gain — it is the difference between having a scrap rate number and having the data that actually reduces it.
| Dimension | Manual Tag & Log | AI Vision Classification |
|---|---|---|
| Classification Accuracy | 60–70% under normal volume, degrading with fatigue | Consistent, model-driven accuracy every part |
| Defect Detail Captured | Simplified codes under production pressure | Full defect subtype, location, and severity |
| Time To Root Cause | Days to weeks, manual log searching | Hours — pattern surfaces automatically |
| Machine / Shift Traceability | Dependent on manual entry discipline | Automatic, tied to camera view and asset ID |
| Coverage | Sampled or fatigue-limited | Every rejected part, every shift |
| Documented Scrap Reduction | Baseline | 20–30% reduction in published deployments |
See Your Actual Top Three Scrap Drivers In One Demo
30 minutes. We show automated scrap classification running against a production feed similar to yours, and walk through what the root cause analysis view looks like once your reject data is structured.
Common Defect Categories AI Vision Classifies On A Production Line
The exact taxonomy is always built against your specific product and process, but most production lines converge on a similar shape of defect categories once classification is automated. These six categories cover the majority of scrap across discrete manufacturing.
Surface Defects
Scratches, dents, color deviations, and texture anomalies on cosmetic or functional surfaces — the highest-volume category on most painted, machined, or molded parts.
Dimensional Deviation
Parts outside tolerance on critical dimensions — often the earliest signal of tool wear before it shows up as a full-blown structural defect.
Structural Faults
Cracks, voids, and internal faults in metal, glass, or composite components — frequently invisible to a visual pass/fail check without AI-assisted imaging.
Assembly & Alignment Errors
Missing fasteners, misaligned components, incorrect orientation — categories that map directly to a specific station or operator step in the process.
Contamination & Foreign Material
Particulates, residue, or foreign objects introduced during handling or a specific process stage — critical for food, pharma, and electronics lines.
Weld & Joint Quality
Bead geometry, alignment, and toe-angle variation on welded assemblies — a defect family where subtle geometric variation is easy to miss by eye at speed.
Turning Classification Into Actual Scrap Reduction
The Pareto pattern shows up almost everywhere once scrap gets properly categorized — the top three to five causes typically account for 70 to 80% of total scrap. That means the path to a meaningfully lower scrap rate is not a hundred small fixes, it is finding and fixing the two or three causes carrying most of the weight, which is exactly what classification data makes visible for the first time.
This is also where vision data earns its keep beyond the immediate reject bin. A camera that logs which machine produced each inspected unit reveals machine-specific defect patterns that a plant would otherwise never separate from general process noise — enabling condition-based maintenance triggered by actual defect trends instead of arbitrary calendar schedules, which cuts both scrap and unnecessary maintenance spend at the same time. The same data quantifies something quality teams have always suspected but rarely proven: some products are inherently harder to manufacture than others. Classification data shows exactly which SKUs carry elevated defect rates and what specific defect types they generate, turning a vague engineering hunch into a ranked, fundable improvement backlog.
Classify Every Rejected Part
AI vision tags defect type, severity, and location automatically at the reject station — no change to your existing reject logic.
Rank Causes By Frequency And Cost
Trend analytics surface which defect types are most frequent and which carry the highest true scrap cost, not just unit count.
Correlate Against Machine & Shift
Classification data tagged to asset ID and shift reveals machine-specific defect patterns — enabling condition-based maintenance instead of arbitrary schedules.
Fix The Top Cause, Re-Measure
Address the single largest contributor first, then re-run classification trend analysis to confirm the fix moved the number before chasing the next cause.
Turnkey AI Vision Deployment For Scrap Classification
iFactory ships scrap classification as a bundled hardware-plus-software deployment — no separate vendor for cameras, no separate vendor for the AI model, no custom integration project to connect classification data to your existing systems.
Pre-Configured NVIDIA AI Vision Server
Ships racked and ready with the classification model pipeline pre-loaded, GPU-accelerated for real-time inference at your reject station's actual line speed.
Rack It, Plug Power And Ethernet, AI Is Live
No custom infrastructure build. The camera at your existing reject station becomes the data capture point — classification starts on day one of deployment.
MES / CMMS Integration & Operator Training
Classification results connect to Siemens, Allen-Bradley, Schneider Electric, ABB, and GE SCADA/PLC systems via OPC-UA and Modbus — logged against lot numbers, shift data, and equipment IDs automatically.
24×7 Remote Monitoring & Model Tuning
iFactory's team monitors classification accuracy, tunes defect thresholds against your outcomes, and expands the taxonomy as new defect types appear in production.
Frequently Asked — AI Scrap Classification & Root Cause Analysis
No. The AI vision classification layer sits at the point where a part is already being pulled off the line — it does not change what triggers a reject, only what happens to the classification data once a part is rejected. Your existing pass/fail thresholds, reject gates, and line control logic stay exactly as they are. The camera and AI model observe the rejected part and generate the structured defect record that manual tagging used to attempt inconsistently. For a walk-through of exactly where the camera integrates against your specific line, book a demo.
iFactory's deep learning classification models handle 10 to 50 distinct defect categories per model, with multi-output architectures capable of classifying both defect type and severity simultaneously. The right number of categories depends on how granular your quality team needs the data to be for root cause work — too few categories and you lose the specificity that makes a Pareto analysis useful, too many and you risk diluting each category below a statistically meaningful sample size. Taxonomy design is part of the deployment scoping process.
Once classification is live and generating structured data, trend analytics typically surface clear patterns within the first two to four weeks of production volume — enough classified rejects across enough shifts and machines for a statistically meaningful ranking. Before that, the deployment itself runs on the standard 6 to 12 week timeline covering camera install, model training, and system integration. The honest baseline scrap number is often higher than what your ERP currently reports — that gap closing is itself useful information for the business case.
It changes what they spend time on rather than replacing the role. Instead of manually tagging every rejected part with a defect code under production pressure — the exact workflow that produces the 60 to 70% classification accuracy ceiling documented across manual inspection — your quality team reviews AI-flagged patterns, validates ambiguous cases, and spends their time on the root cause investigation the data now makes possible instead of on repetitive tagging. Most customers report the shift is toward higher-value work, not toward fewer people.
Published deployments document 20 to 30% scrap reduction after implementing AI-driven classification and root cause workflows, largely by catching problems mid-run rather than at final inspection and by directing improvement effort at the top two or three causes instead of spreading it thin. The specific number depends heavily on how far your current process is from measuring scrap accurately in the first place — plants discovering their honest baseline for the first time often see the biggest early gains simply from finally seeing where the losses concentrate. Contact support for a reduction estimate specific to your defect profile.
Turn Your Reject Bin Into Your Best Source Of Process Data
Book a 30-minute walk-through with iFactory's team. We map AI vision classification against your reject station and show what your top scrap drivers actually look like once the data is structured.