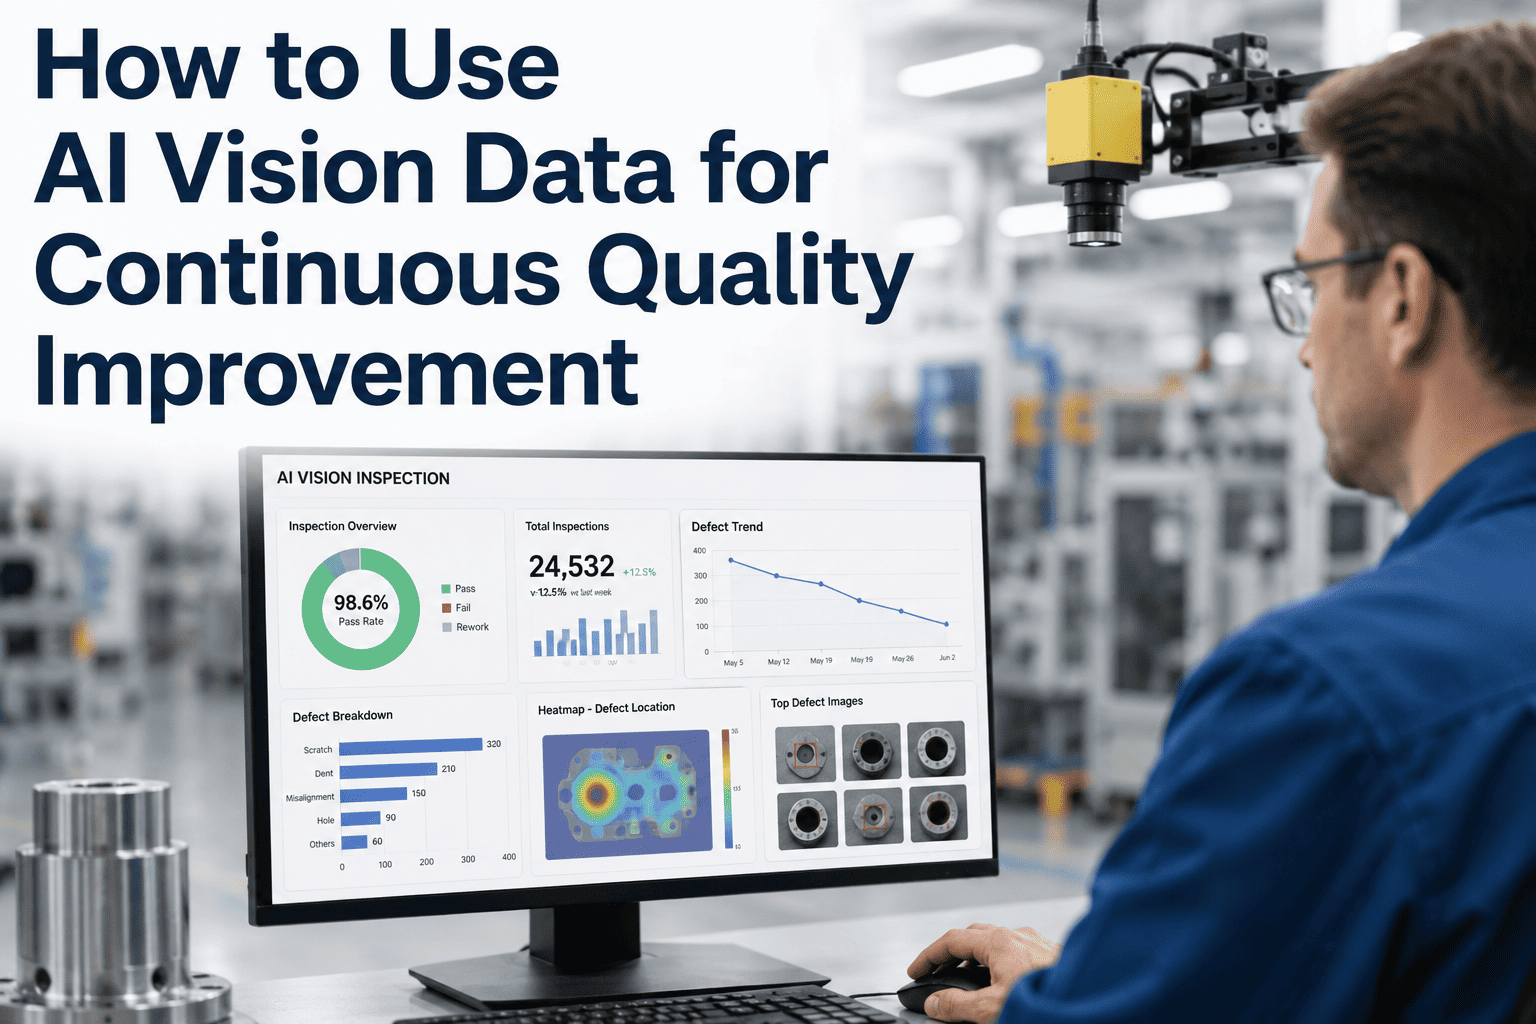
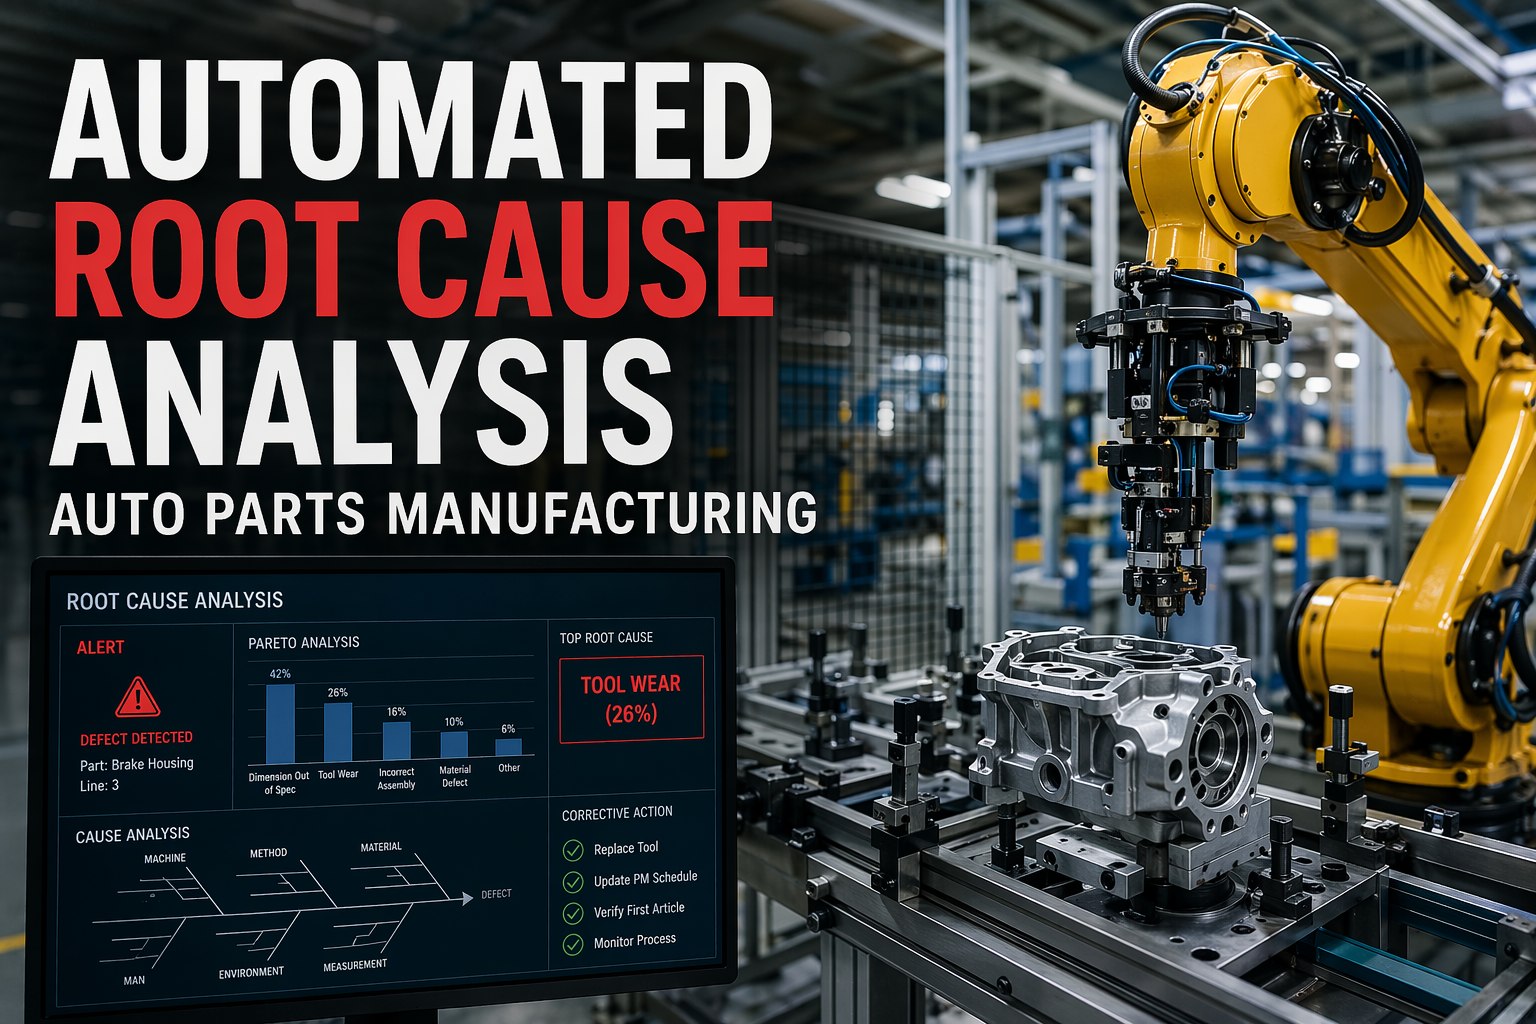
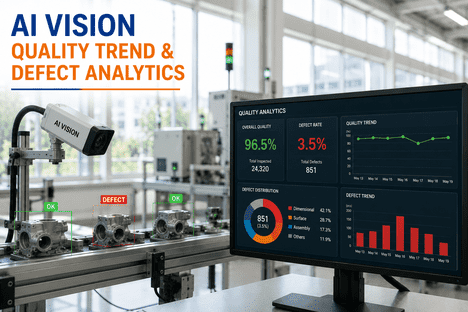
Every kaizen event opens the same way: someone pulls a whiteboard, someone else digs through weeks of paper inspection logs, and the team spends the first half hour just agreeing on what the defect rate actually was last month. DMAIC's Measure and Control phases are supposed to run on data, but most manufacturers are still collecting it by hand, which is exactly where Six Sigma projects stall. AI vision replaces memory and spreadsheets with a continuous, timestamped defect record already sorted by type, station, and shift. Book a demo to see what a vision-fed DMAIC project looks like from Measure through Control.
STRATEGY · CONTINUOUS IMPROVEMENT & LEAN
Your Kaizen Team's Biggest Time Sink Isn't the Problem. It's Finding the Data.
DMAIC lives or dies on the Measure and Control phases, and both depend on data most plants still collect by hand. AI vision turns every inspection point into a continuous, structured data source built for exactly this.
15-25%
Typical first-pass yield gain reported from kaizen events
100%
Inspection coverage vs. sampled manual checks
Weeks
Not months, for Measure phase once data is automatic
THE PHASE THAT KILLS MOST PROJECTS
DMAIC's Two Weakest Links Are Both Data Problems
Six Sigma practitioners consistently point to the same two phases as where projects lose momentum: Measure, because establishing a reliable baseline takes far longer than anyone budgets for, and Control, because sustaining the improvement requires ongoing monitoring that manual processes rarely keep up. Both weaknesses trace back to the same root cause, that most plants are still gathering quality data through paper checklists, spreadsheets, and end-of-shift summaries rather than continuous, automatic capture. When defect data is already structured and timestamped at the point of inspection, Measure accelerates from months to weeks, and Control stops being an aspiration and becomes something the system does by default.
Define
Usually goes fine. The problem statement is clear before the team ever sits down.
Measure
Where projects stall. Establishing a real baseline from manual data can eat weeks the team doesn't have.
Analyze
Runs well once Measure produces a trustworthy dataset to actually analyze.
Improve
The team's expertise and creativity carry this phase, largely independent of data infrastructure.
Control
Where gains erode. Without continuous monitoring, the improvement quietly drifts back within months.
WHAT VISION DATA ACTUALLY LOOKS LIKE
From "We Think It's the Afternoon Shift" to a Number
The difference between a kaizen event powered by memory and one powered by vision data isn't just accuracy, it's the kind of question the team can even ask. A structured defect record lets a team query by station, shift, defect type, and time in ways a stack of paper inspection sheets simply can't support.
01
Quantified Defect Counts
Feeds: Measure phase baseline
Every defect is logged with a type, timestamp, and location rather than estimated from a sample. A kaizen team walks in with an actual DPMO figure instead of a rough guess pulled from memory or a partial paper log.
02
Trend Analysis by Shift, Station, and Time
Feeds: Analyze phase pattern-finding
Because every inspection is timestamped and tagged to a station, patterns that would take weeks of manual cross-referencing to surface, like a defect rate that spikes specifically on the third shift or after a tool change, become visible in a filtered chart.
03
Root Cause Image Evidence
Feeds: Analyze phase 5 Whys and fishbone
Every flagged defect has an actual image attached, not a written description reconstructed from memory hours later. A 5 Whys session grounded in real images of the actual defect surfaces root causes faster than one built on secondhand descriptions.
04
Continuous Post-Fix Monitoring
Feeds: Control phase sustainment
After a countermeasure goes in, the same camera keeps watching. If the defect rate creeps back up three months later, the system flags the drift automatically instead of waiting for someone to notice on the next audit.
MANUAL DATA VS VISION DATA, PHASE BY PHASE
What Changes at Every Stage of a DMAIC Project
The comparison isn't about whether manual inspection catches defects, experienced inspectors often catch plenty. It's about whether the resulting data can actually support the statistical rigor DMAIC depends on, and how long it takes to assemble a dataset a team can trust.
| DMAIC Phase | Manual Data Collection | Vision-Fed Data |
| Define |
Problem statement from anecdote/complaints |
Problem statement backed by baseline numbers |
| Measure |
Weeks of sampling to estimate a baseline |
Baseline available from existing historical data |
| Analyze |
Manual cross-referencing of logs and shift notes |
Filterable trends by shift, station, defect type |
| Improve |
Countermeasure tested against a rough estimate |
Countermeasure tested against exact before/after data |
| Control |
Periodic audits, drift caught late if at all |
Continuous monitoring flags drift automatically |
FROM CAMERA TO KAIZEN BOARD
How Vision Data Actually Reaches the Improvement Team
The value of vision data isn't the camera itself, it's the path from a captured defect to something a kaizen team can act on in the room. This is what that path looks like end to end.
1
Every unit inspected, not sampled. Vision inspects continuously at full line speed, replacing the AQL-style sampling most manual QC relies on out of necessity.
2
Defects tagged and timestamped. Each flagged unit is logged with defect class, station, shift, and an image, building a structured dataset automatically as production runs.
3
Trends surface without manual work. Dashboards filter by any dimension the team needs, turning weeks of spreadsheet cross-referencing into a few clicks.
4
Kaizen team pulls a real baseline. The event opens with actual numbers already agreed on, so the first thirty minutes go to problem-solving instead of data archaeology.
5
Countermeasure tracked automatically. The same system that measured the baseline measures the result, closing the Control loop without a separate audit process.
WHERE THIS SHOWS UP IN PRACTICE
Four Ways Plants Use Vision Data in Improvement Work
These aren't hypothetical use cases, they're the recurring patterns of where a continuous, structured defect record changes how a lean or Six Sigma team actually works day to day.
Kaizen Event Prep
The facilitator pulls a filtered dashboard the morning of the event instead of chasing down last month's paper logs the week before.
DMAIC Measure Phase
Historical vision data often already covers the baseline period, cutting the Measure phase from weeks of new sampling to a data pull.
5 Whys Root Cause Sessions
Actual defect images replace secondhand verbal descriptions, keeping the root cause discussion anchored to what actually happened.
Control Phase Sustainment
The same camera that flagged the original problem keeps watching after the fix, catching any drift back toward the old defect rate.
Stop Losing the First Hour of Every Kaizen Event to Data
We'll show you what continuous, structured defect data looks like for your specific line, ready before the team ever sits down.
MISTAKES THAT UNDERMINE THE PROJECT
Six Ways Data Gaps Sink Continuous Improvement Work
None of these are exotic failures, they're the routine, well-documented ways a lean or Six Sigma initiative loses momentum once the data behind it can't keep pace with the questions the team is asking.
Starting Measure without a real baseline
A rough estimate treated as a baseline means the team can't actually tell if the fix worked or if the numbers just moved on their own.
Sampling instead of full coverage
A defect pattern that only shows up in 5% of units can hide entirely inside an AQL sample size, leaving the team solving the wrong problem.
No Control-phase monitoring
A fix that isn't tracked after implementation tends to quietly erode back toward the original defect rate within a few months.
Root cause sessions built on memory
A 5 Whys discussion working from someone's recollection of a defect from three shifts ago drifts toward guesswork fast.
Treating every kaizen event as a fresh start
Without a persistent data record, each event re-derives context the last event already established, wasting the team's time.
Data too aggregated to be useful
A single monthly defect rate can't tell a team whether the problem is one shift, one station, or one recurring root cause.
BEFORE YOU START
Readiness Checklist for Vision-Fed Continuous Improvement
A vision deployment supports lean and Six Sigma work well when these basics are in place before the first kaizen event depends on it.
Defect classes and taxonomy agreed with the quality team, matching how DMAIC projects will actually categorize problems
Historical baseline period identified so Measure phase can pull from existing data rather than starting from zero
Dashboard access defined for kaizen facilitators, not just the quality department, so the team can self-serve during events
Alert thresholds set for Control-phase drift monitoring on any process the team has already improved
TURNKEY AI DEPLOYMENT
iFactory Ships Vision Hardware Built to Feed Improvement Work
iFactory's turnkey deployment is built with lean and Six Sigma teams as a direct downstream user, not an afterthought. A pre-configured NVIDIA AI server ships racked and ready, with the vision software pre-loaded and dashboards structured around DMAIC's own vocabulary of defect class, station, and shift. Rack it, plug power and Ethernet, and the AI is live, building a Measure-phase-ready dataset from day one.
Pre-configured NVIDIA edge AI hardware, racked and shipped ready to install
Defect taxonomy configured to match your quality team's existing categories
Dashboards filterable by shift, station, and defect type for kaizen and DMAIC use
Cabling, network integration, and PLC or MES connection
Facilitator and quality-team training on pulling data for improvement events
Twenty-four seven remote monitoring from day one of production
DEPLOYMENT TIMELINE
Live in 6 to 12 Weeks From Contract to Production
Deployment is structured so the system is generating usable Measure-phase data well before your next scheduled kaizen event or Six Sigma project kickoff.
Weeks 1-4
Ship, Network, and Taxonomy Setup
Hardware ships pre-racked. Network integration completed, defect taxonomy configured to match your existing quality categories.
Weeks 5-8
Model Training and Baseline Build
Model trained on your specific defect classes. Runs in pilot mode building a real baseline dataset while validated against manual checks.
Weeks 9-12
Go-Live and Dashboard Handoff
System takes over full inspection with dashboards handed to facilitators and quality team, plus twenty-four seven remote monitoring active.
FREQUENTLY ASKED QUESTIONS
Questions Lean and Six Sigma Teams Ask Before Deploying
Does this replace our Six Sigma black belts or kaizen facilitators?
No, it gives them better material to work with rather than replacing their judgment or facilitation skill. The statistical analysis, root cause reasoning, and countermeasure design in a DMAIC project still depend entirely on the team's expertise; what changes is how quickly and reliably they can get to a trustworthy baseline and how confidently they can verify a fix actually held. Facilitators who've run kaizen events on paper logs and then on structured vision data consistently describe it as spending the event solving the problem instead of reconstructing what the problem even was.
Book a demo to see how the dashboard fits into an actual kaizen event workflow.
Can vision data replace manual inspection entirely for DMAIC purposes?
For most defect classes that are visually detectable, yes, and the shift from sampled manual inspection to full-coverage vision inspection is itself a meaningful upgrade for DMAIC's statistical requirements, since a DPMO calculation is only as good as the sample it's based on. Some defect types, particularly those requiring destructive testing or measurements vision can't capture, still need manual or instrumented checks, and a well-scoped deployment identifies which defect classes fall into each category upfront rather than assuming vision covers everything.
How quickly can we get a usable Measure-phase baseline?
If the system has been running for even a few weeks before a project starts, that historical data often already covers the baseline period a Measure phase needs, cutting what would be weeks of dedicated sampling down to a data pull and a validation check. For a brand new deployment with no historical run-time, the pilot period itself doubles as baseline collection, so the timeline depends more on how soon the hardware goes live than on how long Measure itself takes once data is flowing.
Contact our support team to scope a deployment timeline against your next project's target start date.
What happens to the Control phase after a kaizen event ends?
The same inspection system that measured the original problem keeps running after the fix, which means Control stops being a manual audit schedule someone has to remember to run and becomes something the system does continuously by default. Alert thresholds can be set specifically for a process the team just improved, so if the defect rate starts drifting back toward the pre-fix baseline months later, that drift gets flagged automatically rather than discovered at the next scheduled audit.
Can our facilitators pull the data themselves, or does it go through the quality department?
Dashboard access is built for direct use by kaizen facilitators and Six Sigma project leads, not gated exclusively behind a quality department request queue, since one of the biggest time costs in a typical improvement event is exactly that back-and-forth for data. Facilitators can filter by shift, station, and defect type directly, which is what turns a kaizen event's first thirty minutes from a data hunt into an actual problem-solving discussion.
Book a demo to see the dashboard from a facilitator's point of view.
Give Your Next Kaizen Event a Real Baseline to Work From
iFactory ships vision hardware that builds a continuous, DMAIC-ready defect record automatically. Book a demo and see what your next improvement event looks like with the data already waiting.