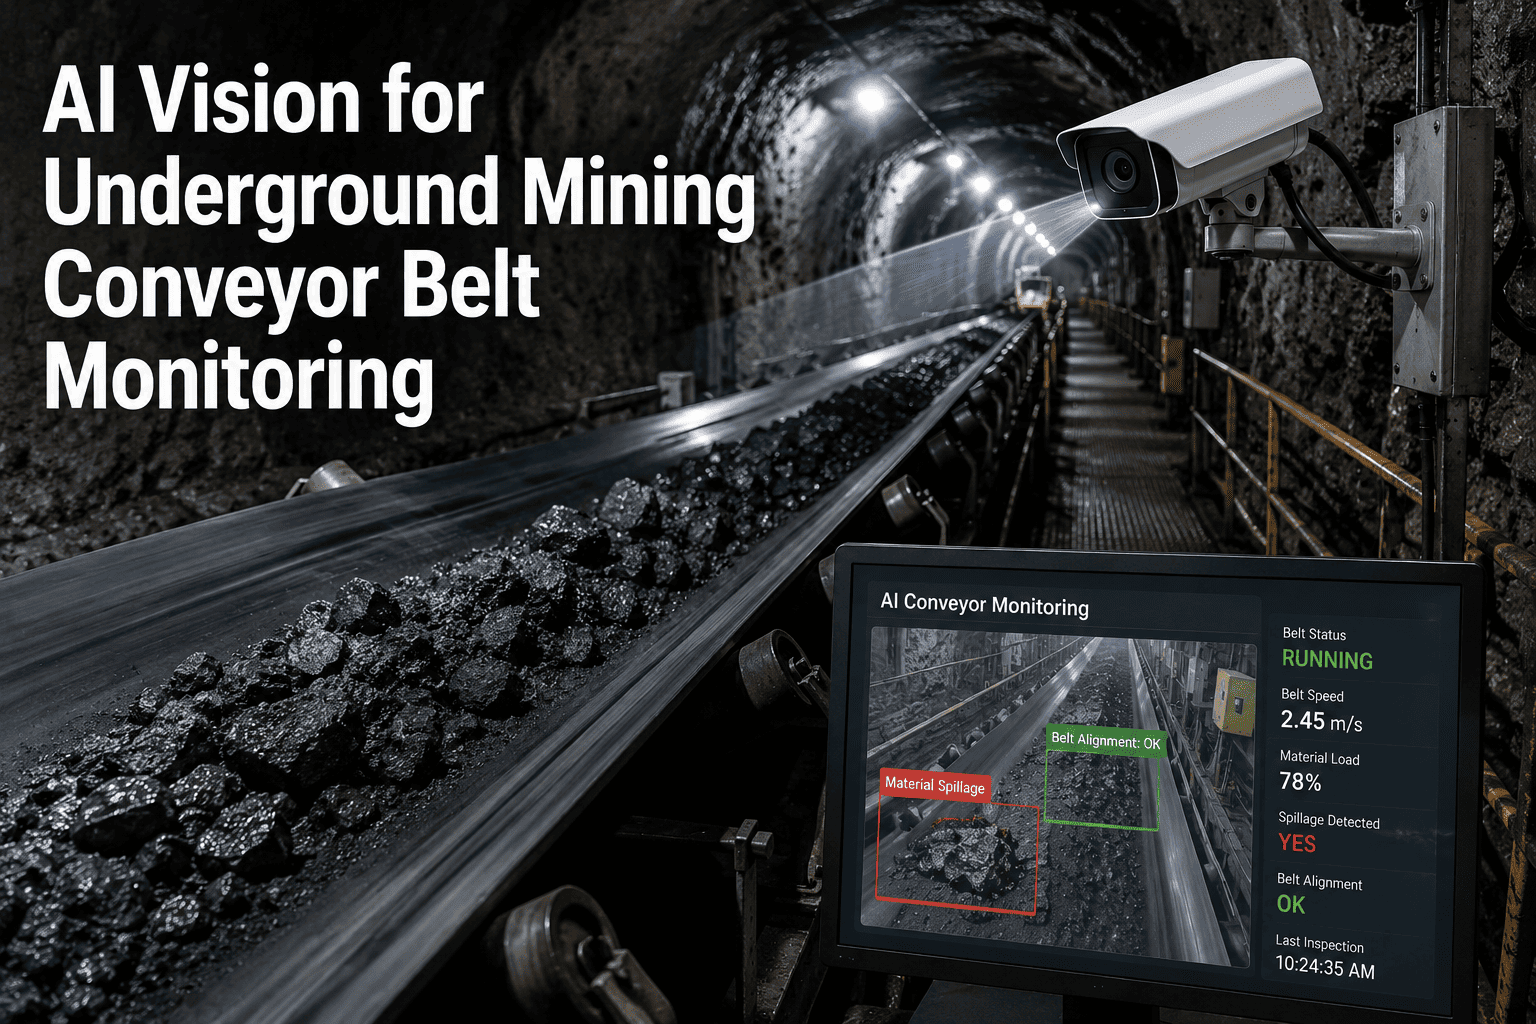
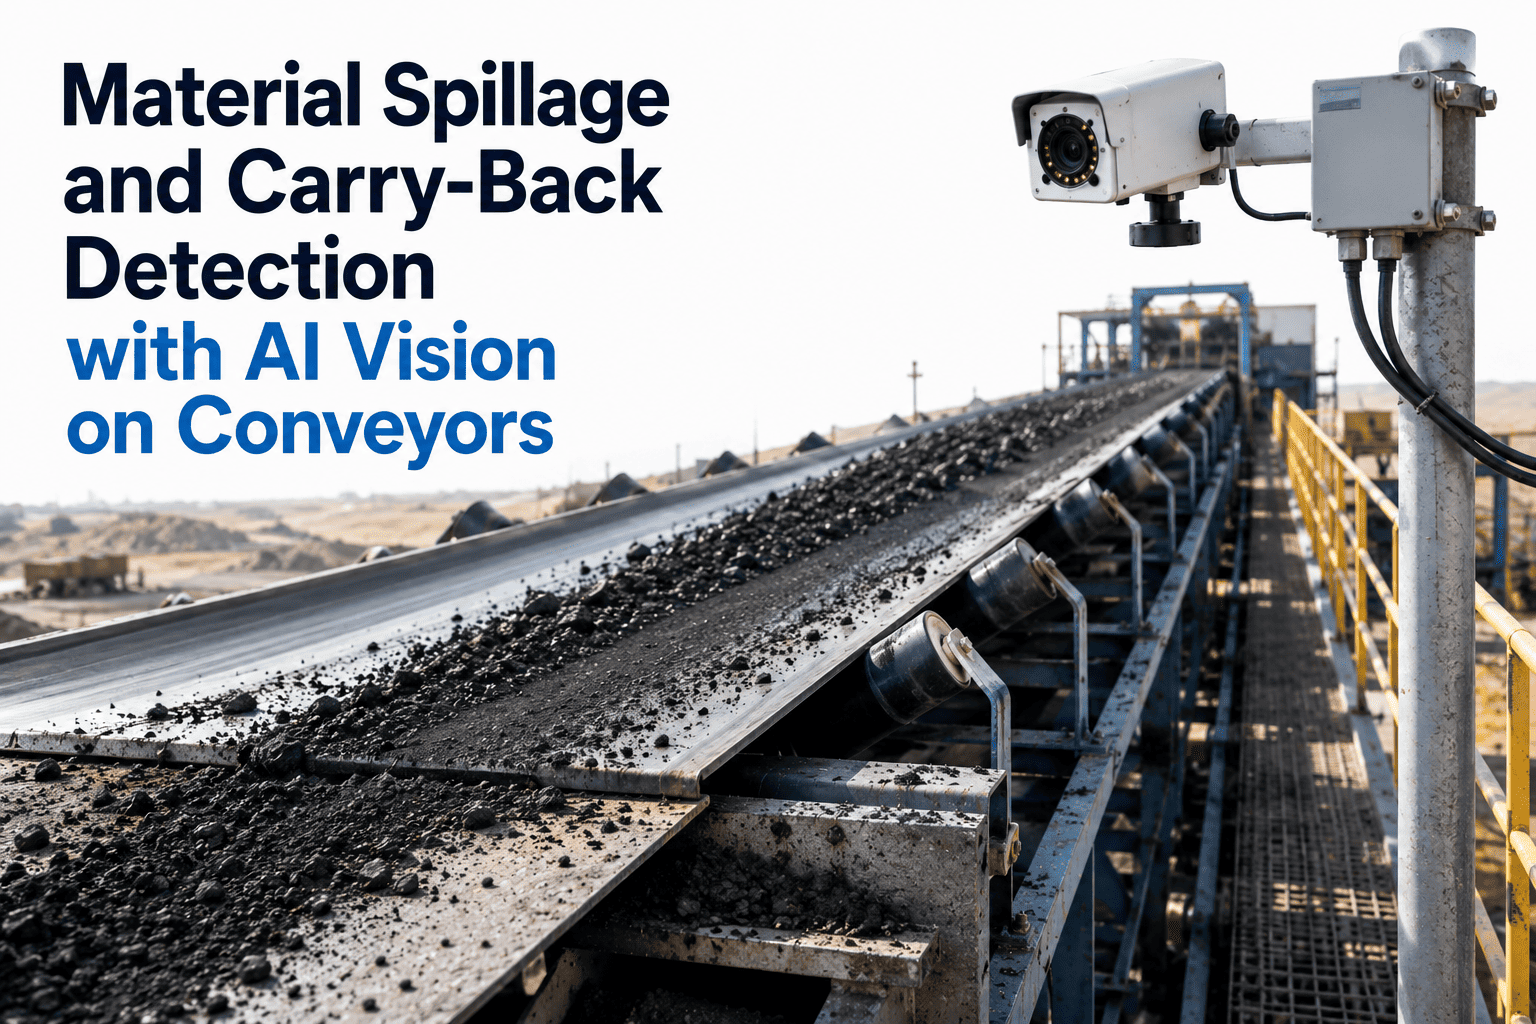
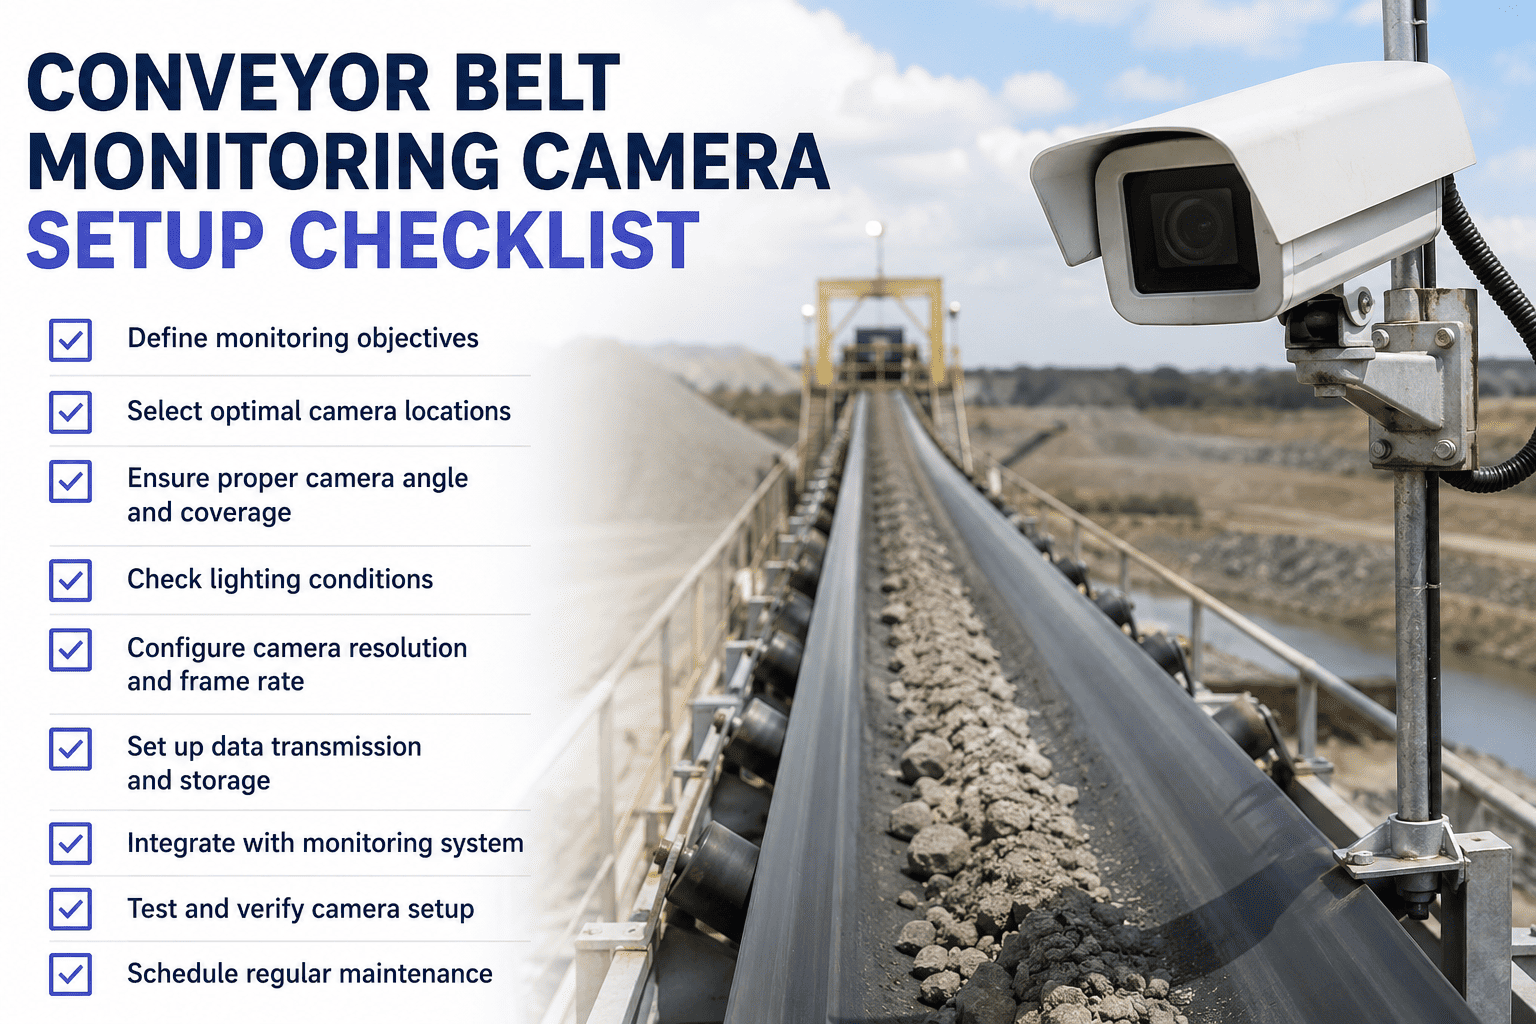
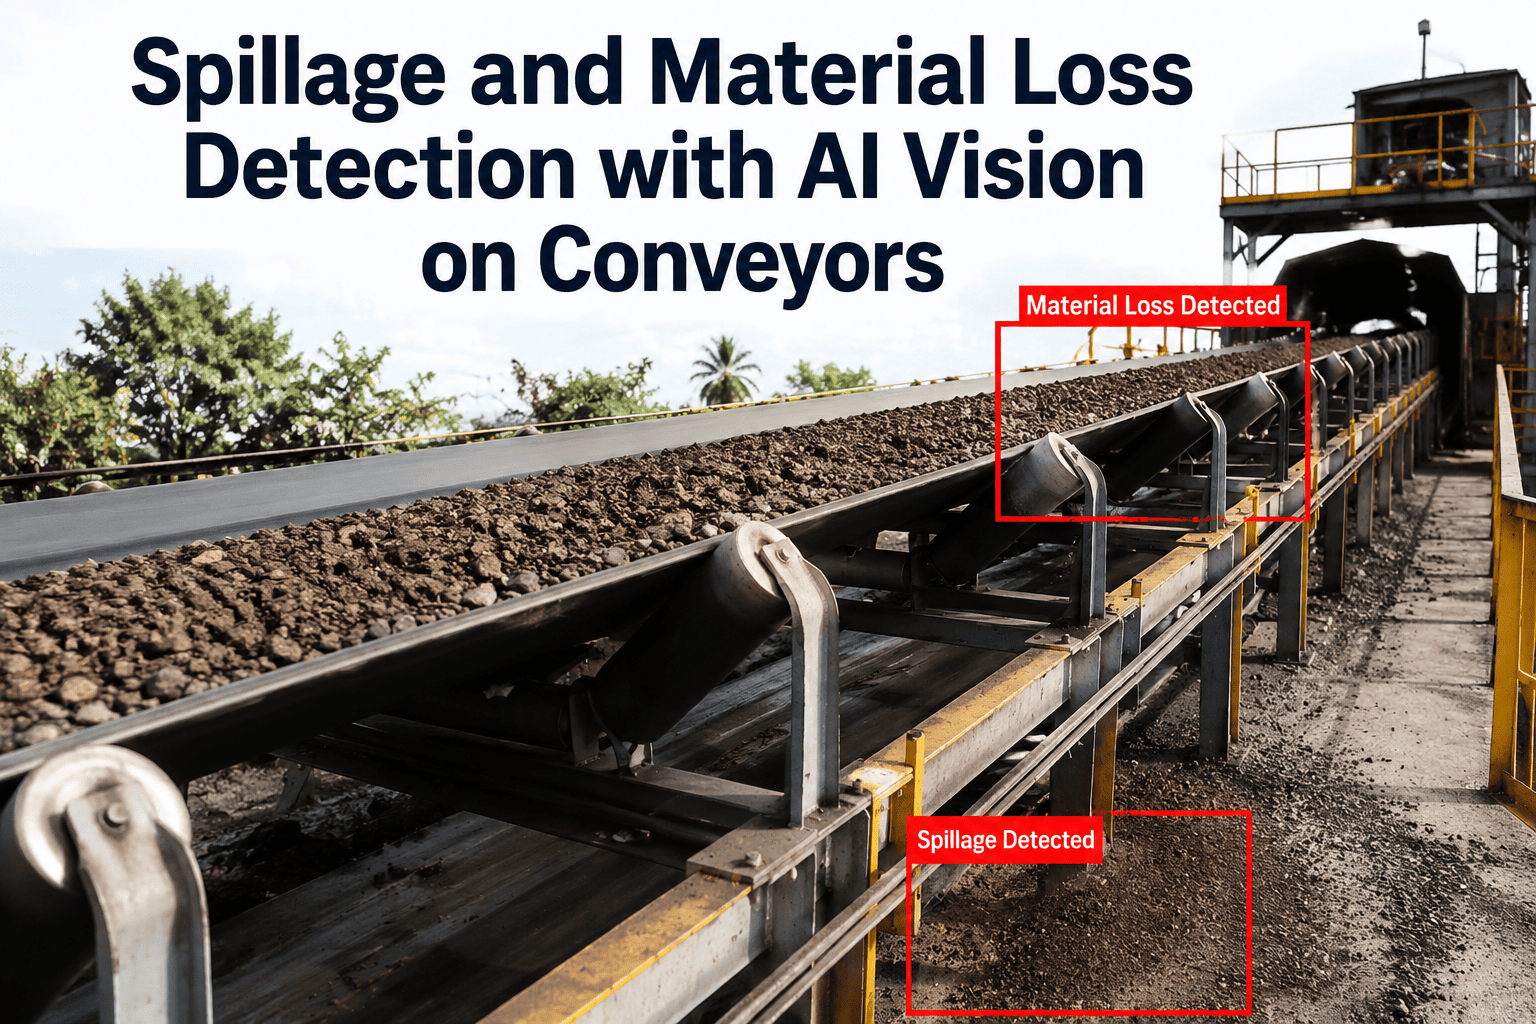
The paradox at the heart of conveyor throughput management is that the belt is the most instrumented piece of equipment in most plants — motor current, weigher load cell, encoder speed pickup, drive telemetry — and yet operators still argue about whether the reported throughput number is real. Contact-based instruments drift as belt slip develops. Belt weighers need calibration cycles that shut the line down. Speed encoders read the pulley, not the belt, so they miss the difference between drive speed and actual belt travel when slip occurs. Meanwhile the material load profile — the shape of the burden across the belt cross-section, where volume is actually concentrated — is invisible to any point-load measurement. Vision changes the arithmetic. A single camera looking at the belt can measure speed via optical flow, load profile via cross-section reconstruction, and throughput as the direct product of the two — with published accuracy identical by 99.927% to reference flow sensors, without touching the belt, without a calibration shutdown, and without any of the wear that contact instruments accumulate. Plant operators building non-invasive belt telemetry into their control-room stack typically work with iFactory's conveyor monitoring engineering team to map camera placement, existing infrastructure reuse, and PLC/MES integration against their specific belt topology.
Non-Contact · Vision-Based Belt Telemetry
AI Vision for Conveyor Speed, Load and Throughput Monitoring
Measure belt speed, material load profile, and throughput volume from a single camera view — without contact sensors, without calibration shutdowns, without touching the belt. Retrofit onto existing camera infrastructure, integrate with PLC/SCADA in weeks, and give your control room the throughput number that finally matches what the plant is actually moving.
Live Measurement Panel
Belt Speed
3.42 m/s
Optical flow · vector tracking · updated every frame
Cross-Section Load
0.187 m²
Burden profile reconstruction from side view
Instantaneous Throughput
2,301 t/h
Speed × cross-section × density · continuous
The Throughput Equation, Visualised
Three Measurements, One Number — And Why Getting Each One Right Matters
Throughput is a product, not a measurement. It's belt speed multiplied by the cross-section of material on the belt, multiplied by material density. Every conveyor tonne per hour ever quoted is that product, computed from three underlying numbers. If any one of the three is wrong, throughput is wrong — and traditionally each one has been measured by a different piece of instrumentation, with different failure modes, different calibration cycles, and different drift patterns. Vision replaces three brittle measurement chains with a single non-contact camera view.
Belt Speed
v
metres per second
Vision: Optical flow between successive frames
×
Cross-Section Area
A
square metres
Vision: Burden profile reconstruction from side view
×
Material Density
ρ
tonnes per cubic metre
Material property · calibrated per feed grade
=
Throughput
Q
tonnes per hour
Published research on cement industry deployment reports vision-based throughput measurement identical by 99.927% to the reference flow sensor already installed on the plant — meaning the vision system reproduces the calibrated flow sensor reading within a rounding error, without touching the belt and without needing shutdown for calibration.
The Three Measurement Pillars
Speed, Load Profile, And Throughput — What Each Vision Model Actually Does
Vision-based belt telemetry isn't one algorithm — it's three purpose-tuned measurement pipelines running against the same camera stream. Each pillar handles one term of the throughput equation, with its own model, its own accuracy characteristics, and its own operational value even before the numbers get multiplied together.
P1
Belt Speed Measurement
Method: Optical flow between adjacent frames, tracking natural belt texture or applied speckle pattern. Feature-matching algorithms compute pixel displacement per frame, converted to physical velocity via camera calibration.
Reported accuracy: RMSE 0.018 m/s on laboratory horizontal belt tests. Captures true belt speed, not drive-pulley speed — the difference matters when belt slip develops.
Operational value: Detects slip before it becomes throughput loss. Baseline speed telemetry feeds every downstream calculation.
P2
Load Profile Reconstruction
Method: Side-angle camera captures the burden cross-section shape. Edge detection isolates the material surface against the belt; geometry model reconstructs the area under the burden curve and its lateral position.
Reported accuracy: Cross-section area measurement matches integrated belt weigher within measurement tolerance, with the added dimension of showing where on the belt the material sits.
Operational value: Reveals off-centre loading that causes edge wear, chute plugging, and belt tracking drift — the causes belt weighers cannot see.
P3
Instantaneous Throughput
Method: Direct multiplication of speed and cross-section area with material density. Continuous per-frame calculation aggregated to per-second, per-minute, and per-hour throughput values transmitted to SCADA and historian.
Reported accuracy: 99.927% identical to reference flow sensor in published cement plant deployment — the throughput number the vision system produces matches the calibrated instrument the plant already trusts.
Operational value: Removes belt weigher calibration downtime, provides throughput visibility on belts that never had weighers, and cross-checks existing measurement chains.
See Vision Measurement Against A Reference Weigher · Live
Watch A Camera Match A Calibrated Belt Weigher To Within A Fraction Of A Percent — In Real Time
Book a walkthrough with iFactory's conveyor engineering team. See side-by-side speed, load profile, and throughput measurement on real belt footage — with SCADA integration, historian tie-in, and edge inference on standard NVIDIA hardware. 30 minutes, your specific belt geometry, real deployment architecture.
Camera Placement Anatomy
Where The Cameras Sit, What They See, And Why It Works From Existing Infrastructure
Vision-based belt telemetry doesn't require a specialised measurement instrument — it requires a camera positioned with the right field of view of the belt, feeding a properly tuned model. In many cases, cameras already installed for security or safety monitoring can be repurposed, dramatically compressing the deployment timeline. Below is the placement anatomy for the three measurement pillars on a typical bulk-handling belt.
Belt Travel Direction
Head End · · · · · · · · · · · · · · · · · · · · · Discharge End
Camera A
Top-down · Speed
Mounted overhead looking straight down at the belt surface. Optical flow tracks natural texture or applied pattern. Field of view sized to give sufficient pixel motion between frames at maximum belt speed.
Camera B
Side view · Cross-section
Mounted perpendicular to belt travel, looking at the burden profile. Angle and distance calibrated for the specific belt width. Backlighting or structured lighting improves edge definition against the material.
Camera C
Loading zone · Profile shift
Positioned at chute discharge or loading point to observe how material distributes as it lands on the belt. Detects off-centre loading and lateral bias before it propagates downstream as edge wear.
All three views feed a single edge inference unit running the speed, cross-section, and throughput models in parallel — one hardware footprint per belt zone, three continuous measurement outputs.
Business Outcomes
Six Places Where Vision-Based Belt Telemetry Shows Up On The Plant P&L
Non-contact measurement isn't just a nicer version of the same telemetry — it moves numbers on the plant scorecard that contact instrumentation was structurally incapable of touching. The six outcomes below are what iFactory's conveyor engineering team consistently sees on deployments across cement, mining, aggregates, and bulk handling.
01
Belt Weigher Calibration Downtime
Vision throughput can shadow or replace the belt weigher, removing periodic calibration shutdowns from the maintenance calendar. Every avoided calibration run is production time recovered directly.
Edge Wear And Belt Life Extension
Off-centre loading is the leading cause of belt edge wear. Load profile visibility reveals which loading points bias the burden, and reported edge wear reductions reach up to 40% on optimised loading profiles.
Chute Plugging And Spillage Reduction
Load profile and throughput variance combined reveal chute restriction conditions before they escalate to full plug. Housekeeping labour and belt cleaner wear both drop with fewer overload events.
Belt Slip Detection
Vision speed measured on the belt, compared to drive encoder speed on the pulley, reveals slip conditions immediately. Drive tuning corrections happen before slip-related throughput loss accumulates across the shift.
Throughput Visibility On Un-Weighed Belts
Many plants have belts without weighers because installation cost couldn't be justified. Vision provides throughput telemetry on those belts at a fraction of the weigher deployment cost, closing measurement gaps in the material balance.
Historian Data Density For Analytics
Vision telemetry runs at frame rate — orders of magnitude denser than typical belt weigher polling. Downstream analytics for material balance, downtime attribution, and throughput optimisation gain resolution that contact instrumentation never provided.
Where This Concentrates
Five Industries Where Non-Contact Belt Telemetry Pays Back Fastest
Vision-based belt monitoring produces value across most bulk-handling operations, but the payback concentrates in industries where throughput visibility, belt asset value, or calibration downtime carries specific pain points. The five scenarios below are where iFactory's deployment programme most often starts on the conveyor telemetry conversation.
01
Cement And Aggregate Plants
The environment where the 99.927% reference-match study was published. Multiple belts feed clinker, gypsum, and additive streams into cement grinding — every one benefits from continuous throughput visibility without adding weigher hardware to each.
Iron Ore And Coal Mining
Long overland belts moving thousands of tonnes per hour where a single calibration shutdown costs hundreds of tonnes of lost throughput. Vision telemetry replaces the calibration cycle and adds slip detection on drive pulleys under high load.
02
03
Steel Plants And Bulk Metallurgical Feed
Blast furnace and sinter plant feed belts where throughput accuracy directly drives burden model accuracy. Off-centre load detection prevents edge wear on high-value steel-cord belts that cost seven figures to replace.
Ports And Bulk Handling Terminals
Ship-loading and stockpile-transfer belts where throughput measurement is contractually tied to ship demurrage and terminal fee calculation. Vision provides a continuous non-invasive reference to cross-check calibrated weighers.
04
05
Grain, Food, And Agri-Bulk Handling
Environments where hygiene rules and product contact restrictions make contact instrumentation harder to justify. Non-contact vision measurement avoids product contamination concerns while providing full throughput and load profile telemetry.
Integration Architecture
From Camera Frame To Control Room Dashboard In A Standard Industrial Stack
The vision measurement chain terminates at the same historians, PLCs, and control-room dashboards the plant already uses. No parallel data infrastructure, no separate operator interface, no data silo. The integration path below is the standard architecture iFactory deploys against the industrial systems every plant already has.
1
Camera Capture
Existing or newly installed IP camera streams to the edge inference unit at the belt zone. Standard Ethernet backhaul. No parallel imaging network required.
2
Edge Inference
NVIDIA-class edge GPU runs speed, cross-section, and throughput models in parallel. Full video stays local; only measurement outputs and alert imagery transmitted upstream.
3
PLC Integration
Speed, cross-section, and throughput values delivered over OPC-UA, Modbus TCP, or EtherNet/IP to the existing conveyor PLC — available for interlocks and control loops.
4
SCADA + Historian
Measurement tags published to the plant SCADA and archived in the historian at native frame rate — belt telemetry becomes queryable across shifts, campaigns, and material types.
5
SAP PM / CMMS
Trend-based work orders auto-generated when measurement drift, slip patterns, or load profile bias cross configured thresholds — routed into the plant's existing maintenance workflow.
Field Perspective
"
The way I frame vision-based belt telemetry with plant reliability leaders is that we have been asked to trust throughput numbers for decades that came from measurement chains no one would design fresh today. A belt weigher is a beautiful piece of engineering when it is freshly calibrated, but its calibration decays with idler bearing wear, and the calibration run itself costs the plant production time it never gets back. A drive encoder measures the pulley, not the belt, so when belt slip develops, your throughput number stays wrong in a way that only shows up in downstream material balance discrepancies weeks later. Neither of those was ever a good answer — they were the answers available. Vision changes the character of the measurement. It is non-contact, so it does not wear. It measures the belt itself, so slip is detected as a differential rather than an unreported error. And it sees the load profile, which no point-load instrument ever could. The other conversation I find myself in with operations directors is that the value of load profile visibility is bigger than they expect going in. Belt edge wear, chute plugging, and belt tracking drift all trace back to loading pattern issues that were invisible in the historian. Once you can see the profile, you start correcting loading points, and the belt asset lifecycle numbers move in a way that pays back the whole monitoring programme on its own. That is usually the point at which the conversation shifts from a pilot on one belt to a rollout across the site.
Aditi Volkov-Erasmus
Bulk Handling Reliability Programme Lead · 20 years across cement, iron ore, and port terminal conveyor asset management, with deployment experience of vision-based belt telemetry across seven-figure-asset belt systems in three continents
Frequently Asked Questions
What Plant Engineers Ask Before Deploying Vision-Based Belt Telemetry
Can vision throughput measurement actually match a calibrated belt weigher for accuracy?
Yes — published research in cement industry deployment reports vision-based throughput measurement identical by 99.927% to the reference flow sensor already installed on the plant, meaning the vision system reproduces the calibrated flow sensor reading within a rounding error. Speed measurement accuracy is documented at RMSE of 0.018 m/s on horizontal belt tests. On real production deployments, accuracy is site-specific and depends on camera positioning, lighting, and material characteristics, but the technology consistently reproduces weigher-grade throughput without weigher-grade calibration overhead.
Talk to conveyor engineering about accuracy benchmarking against your specific reference instruments.
Can we use our existing camera infrastructure or do we need to install new cameras?
In many cases, cameras already installed for security or safety monitoring can be repurposed for speed and load profile measurement if their field of view and resolution meet the requirements — which compresses deployment timeline and cost significantly. Where existing cameras are not positioned appropriately, new IP cameras are installed at the specific viewpoints needed for each measurement pillar. The deployment engineering phase surveys existing camera assets against the measurement requirements and produces a hybrid plan that reuses what fits and adds what's needed. Standard industrial IP cameras are sufficient — no specialised measurement hardware required.
How does the system handle changing material types, moisture, or feed variance?
Speed and cross-section area measurement are material-agnostic — the models measure belt travel and burden geometry regardless of what's on the belt. The density term in the throughput calculation is where material characteristics enter, and the system supports per-material-type density profiles that operators can switch as the feed changes, either manually or via signals from upstream feeder controls. Moisture variance affects density and is handled through the same density-profile mechanism. For plants with continuously variable feed characteristics, density can be inferred from correlation with a reference belt weigher during a calibration window, then continuously tracked by vision without further weigher intervention.
Does the vision system integrate with our SCADA, historian, PLC, and CMMS without a parallel infrastructure?
Yes — vision measurement outputs are delivered through the same industrial protocols the plant already uses. OPC-UA, Modbus TCP, and EtherNet/IP handle PLC integration for interlocks and control loops. Historian tag ingestion runs at native frame rate, giving downstream analytics measurement density that contact instrumentation never provided. Trend-based work orders are auto-generated into SAP PM or the plant CMMS when measurement drift, slip patterns, or load bias cross configured thresholds. No parallel dashboard, no separate operator interface, no data silo.
Book a demo to walk through the integration architecture for your specific control room stack.
What does deployment look like from purchase order to full measurement telemetry?
Standard deployment runs 6–12 weeks depending on the number of belts and existing camera infrastructure available for reuse. Weeks 1–3 cover site survey, camera placement engineering against the three measurement pillars, and edge inference hardware pre-configuration. Weeks 4–8 cover installation of new cameras where needed, edge unit racking and network integration, PLC and SCADA commissioning, and initial model calibration against site material characteristics. Weeks 9–12 cover go-live tuning, reference-instrument correlation on belts with existing weighers, operator training, and dashboard configuration. Post go-live, 24×7 remote monitoring maintains model accuracy as material and belt conditions evolve.
Talk to the engineering team about a phased pilot on your highest-value belt before scaling to full site coverage.
Retire The Calibration Shutdown · Replace It With A Camera
Bring Speed, Load Profile, And Throughput Into The Control Room From A Single Non-Contact View
iFactory's conveyor vision platform is engineered for the specific realities of bulk-handling operations — belts that cannot afford calibration downtime, weighers that drift with idler wear, drive encoders that miss belt slip, and load profile insights that no contact instrument was ever built to see. Optical flow speed, burden reconstruction, throughput calculation, edge inference, and standard-protocol integration come together into a single non-invasive telemetry layer that turns the throughput number from a contested reading into a live measurement chain the whole control room can trust.