The procurement conversation about supplier quality usually starts the same way: one team claims a supplier's defect rate is 800 PPM, another team's spreadsheet says 1,400, and the supplier's own report says 350. All three numbers come from the same shipments over the same quarter. They differ because each team is counting a different set of defects with a different sampling approach against a different acceptance criterion — and none of the three has a defensible way to prove the others wrong. AI vision at incoming inspection ends that argument by generating one objective number per part, per lot, per supplier — every inspection logged with imagery, classification, and time stamp — and rolling those numbers into a scorecard that finally reflects what actually happened rather than what someone remembered. Procurement and quality teams evaluating this can Book a Demo to see how iFactory turns incoming inspection data into supplier ratings that hold up in quarterly business reviews.
AI VISION · SUPPLIER SCORECARD · DATA-DRIVEN RATING
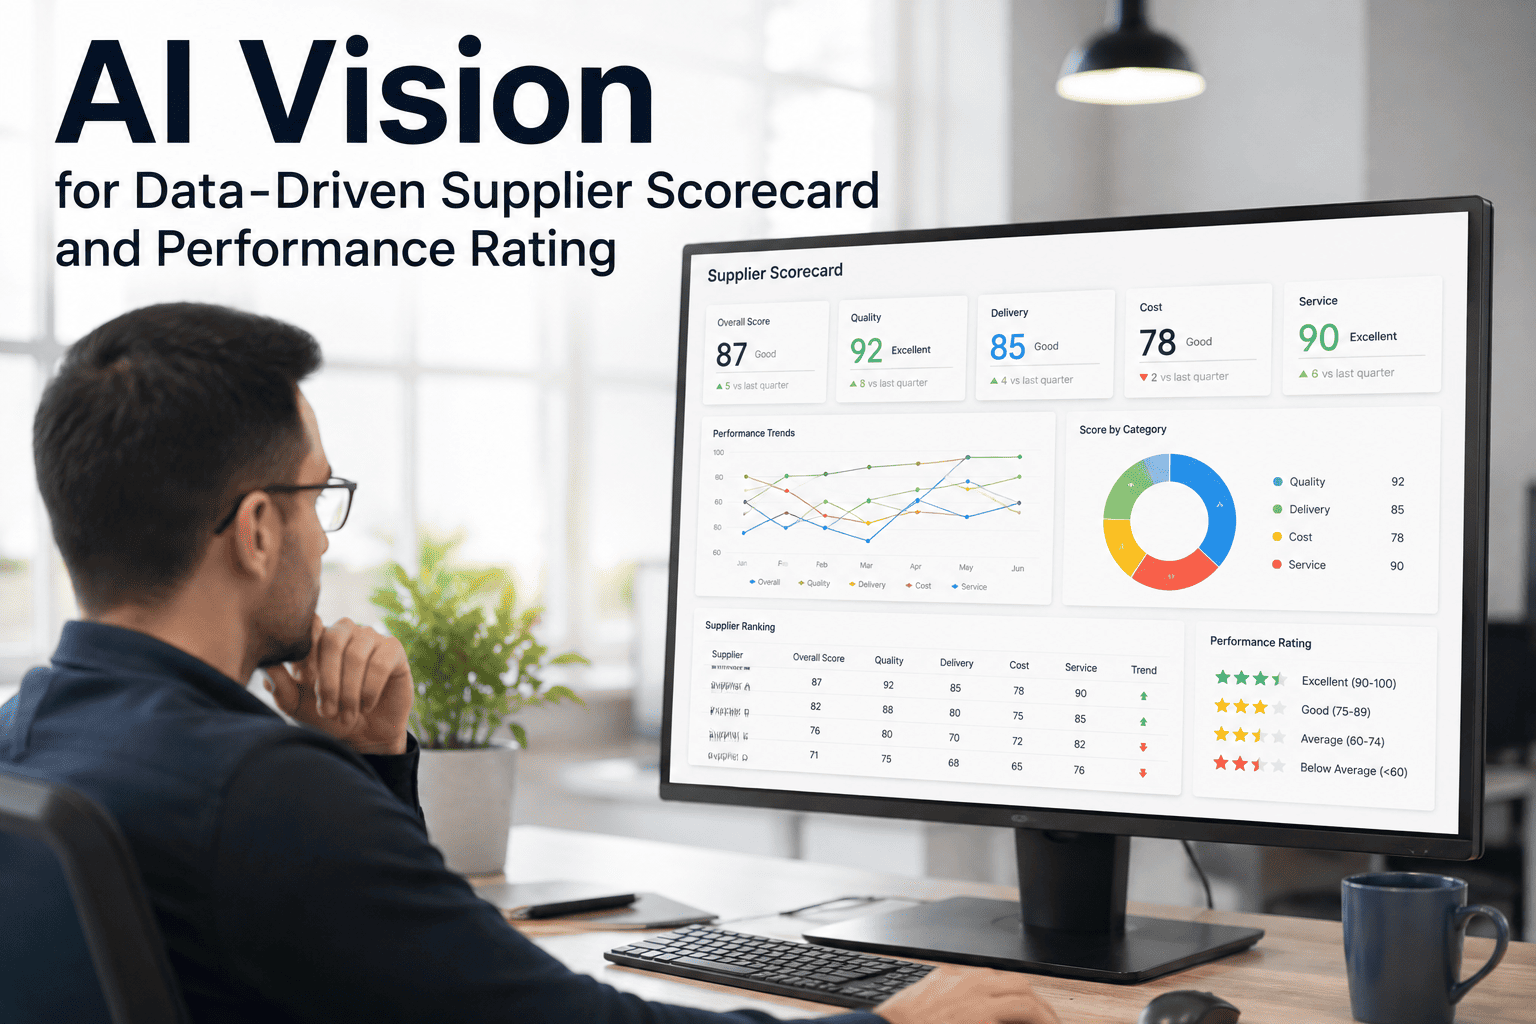
AI Vision for Data-Driven Supplier Scorecard and Performance Rating
How AI-powered incoming inspection data feeds objective PPM defect rates, part-level trend tracking, and lot-by-lot performance evidence into supplier scorecards — replacing the monthly spreadsheet exercise with a live rating system procurement and quality both trust.
Why Most Supplier Scorecards Fail Before the First Review
Supplier scorecards fail for three specific reasons, and they fail the same way in almost every organization that runs them from a spreadsheet. The first reason is data lag: the scorecard reports quality performance from the previous month or quarter, so by the time procurement raises an issue in the quarterly business review, the supplier's response is "we already fixed that." The second reason is disputed data: the buyer's defect count, the supplier's defect count, and the incoming inspection log all disagree because none of them are grounded in the same underlying inspection record. The third reason is dilution: the scorecard tracks 15 to 20 metrics, most of them soft or aspirational, so no single metric has enough weight to drive supplier behavior change.
The fix for all three is the same underlying capability — an objective, high-frequency, part-level inspection record that both parties can look at and neither can argue with. AI vision at incoming inspection generates exactly that record. Every part inspected produces a captured image, a classification output from the trained model, a defect type where applicable, and a time stamp. Roll those records up by supplier, by part number, by lot, and by defect category, and the resulting scorecard shows what actually happened rather than what someone summarized. When a supplier disputes a defect count, the conversation stops being he-said-she-said and becomes "here is the image of each of the 47 rejected units, here is the classification, here is the time it was inspected, and here is the aggregate showing your PPM at 620 for this part number over the last 30 days."
The shift is not just about better data — it is about a different kind of conversation with the supply base. When the scorecard is grounded in evidence, supplier reviews stop being defensive posturing and start being working sessions on specific defect modes with specific root causes. Suppliers whose internal quality processes are strong actively welcome the evidence-grounded approach because it lets them investigate rejects at their end rather than negotiating over summary numbers. Suppliers whose processes are weak find it harder to hide the weakness, which surfaces capability gaps that had been masked by dispute-friendly reporting for years. In both cases, the underlying capability of the supply base becomes visible in a way that spreadsheet-based scorecards never allowed.
The Grade Tier System: What Supplier Ratings Actually Mean
Supplier grade tiers convert the raw score into a category that procurement can act on. The specific thresholds vary by industry — automotive holds suppliers to tighter PPM standards than food and beverage, and regulated industries such as pharmaceutical and medical device apply their own weights — but the tier structure below reflects what most manufacturing scorecards converge on. What matters is not the exact PPM cutoff for each tier but the fact that the tiers translate into different business actions: which suppliers get new business, which suppliers need corrective action closure, and which suppliers are on the disqualification path.
A
Preferred Supplier · PPM < 50
World-class defect performance, first-pass yield above 99 percent, corrective actions closed within committed cycle time. Preferred status for new business allocation, reduced inspection frequency permitted under skip-lot programs, first candidate for strategic supplier development investment.
B
Qualified Supplier · PPM 50-500
Standard performance for most manufacturing supply base, meets contractual quality requirements, corrective actions closed within reasonable time. Full inspection maintained, eligible for continued business at current volumes, development conversations focus on incremental improvement toward tier A.
C
Conditional Supplier · PPM 500-2000
Elevated defect rate, corrective action backlog developing, quality risk to receiving operations. Increased inspection intensity, hold on new business allocation, formal supplier development plan required with measurable milestones and quarterly review of scorecard trajectory.
D
Probationary Supplier · PPM > 2000
Defect performance outside acceptable range, corrective actions overdue or ineffective, active risk to production continuity. Second-source qualification initiated, containment inspection at 100 percent, disqualification review if scorecard does not improve within defined recovery window.
The important discipline is that tier assignment must be automatic from the scorecard rather than negotiated in the review meeting. When tier assignment becomes a negotiation, the whole rating system becomes political — suppliers with strong commercial relationships stay on tier B despite tier C performance, and the scorecard loses credibility with the operations teams whose incoming reject rates prove the rating is wrong. Automatic tier assignment based on the underlying inspection data removes that failure mode.
Tier movement itself is another discipline worth designing intentionally. A supplier that spikes into tier C for a single bad month should not be treated the same as a supplier that has drifted from tier B to tier C over six months of gradual defect-rate increase. The first is a lot-specific issue that may already be contained; the second is a systemic capability decline that needs supplier development attention. Building the tier system with rolling windows — 30 day, 90 day, and year-to-date scores visible side by side — makes the difference between these two cases obvious and lets procurement respond appropriately to each. Suppliers whose year-to-date score is tier B but whose 30-day score is tier C need a conversation; suppliers where both are tier C need a formal development plan.
INCOMING INSPECTION · SUPPLIER RATING · PROCUREMENT DECISIONS
End the Argument Over Whose Defect Count Is Right
iFactory generates one objective inspection record per part, per lot, per supplier — with imagery, classification, and time stamp — and rolls those records into supplier scorecards that hold up in quarterly reviews and drive procurement decisions that stick.
KPI Weighting: The Five Metrics That Actually Change Supplier Behavior
A well-designed scorecard uses 3 to 5 primary KPIs plus a small number of secondary indicators. More than that, and no single metric carries enough weight for suppliers to focus on. The weighting distribution below reflects what most manufacturing scorecards converge on for general industrial supply, with variations for regulated industries where quality weight increases at the expense of delivery or cost. The point is not that these exact percentages are right for every supply category — the point is that weights need to be locked in the scorecard system rather than adjusted meeting to meeting.
Quality Performance
30-40%
PPM defect rate at incoming inspection, first-pass yield, non-conformance rate, escape rate to production floor. This is the metric AI vision directly generates from every inspection event.
Delivery Performance
30-40%
On-time in-full delivery rate, lead-time variance against committed schedule, schedule flexibility on demand changes. Sourced from ERP receipt data and purchase order history.
Purchase order variance, invoice accuracy, total cost of ownership, cost of poor quality attributable to the supplier. Combines procurement and quality cost data.
Responsiveness & CAR
10-15%
Corrective action response time and closure rate, communication responsiveness, 8D report quality, containment effectiveness. Sourced from quality management workflow.
Certification status against required standards, audit finding severity and closure, regulatory compliance track record. Baseline qualification rather than continuous performance metric.
The Data Flow: How AI Vision Turns Inspection Into Scorecard
The gap between "we do incoming inspection" and "we have a data-driven supplier scorecard" is usually a data-plumbing gap rather than an inspection gap. Most facilities generate inspection data — the problem is that the data lives in log books, spreadsheet exports, or an inspection module that does not connect to the supplier rating system. AI vision closes the plumbing gap by writing every inspection event as a structured record from the moment it happens, then propagating that record through defined layers into the scorecard where procurement actually reads it.
A concrete example makes the flow tangible. A stamped bracket supplier ships a lot of 12,000 units against purchase order PO-4471. The lot arrives at incoming inspection, AI vision inspects each part on the conveyor, and the model flags 18 units with visual defects — 12 with a burr classification, 4 with dimensional out-of-tolerance, and 2 with surface contamination. The lot record shows 12,000 inspected, 11,982 accepted, PPM for the lot at 1,500. That single lot record aggregates into the supplier's 30-day rolling PPM (currently 890 across 8 lots), which feeds the composite scorecard where quality is weighted 35 percent, delivery 30 percent (this supplier's OTIF is 94 percent), cost 20 percent, corrective actions 10 percent, and compliance 5 percent. The composite score is 76 out of 100, which puts this supplier at tier B — and because their trend is upward from 68 three months ago, they are already in a supplier development conversation with clear improvement targets and quarterly review milestones.
01
Inspection Event Capture
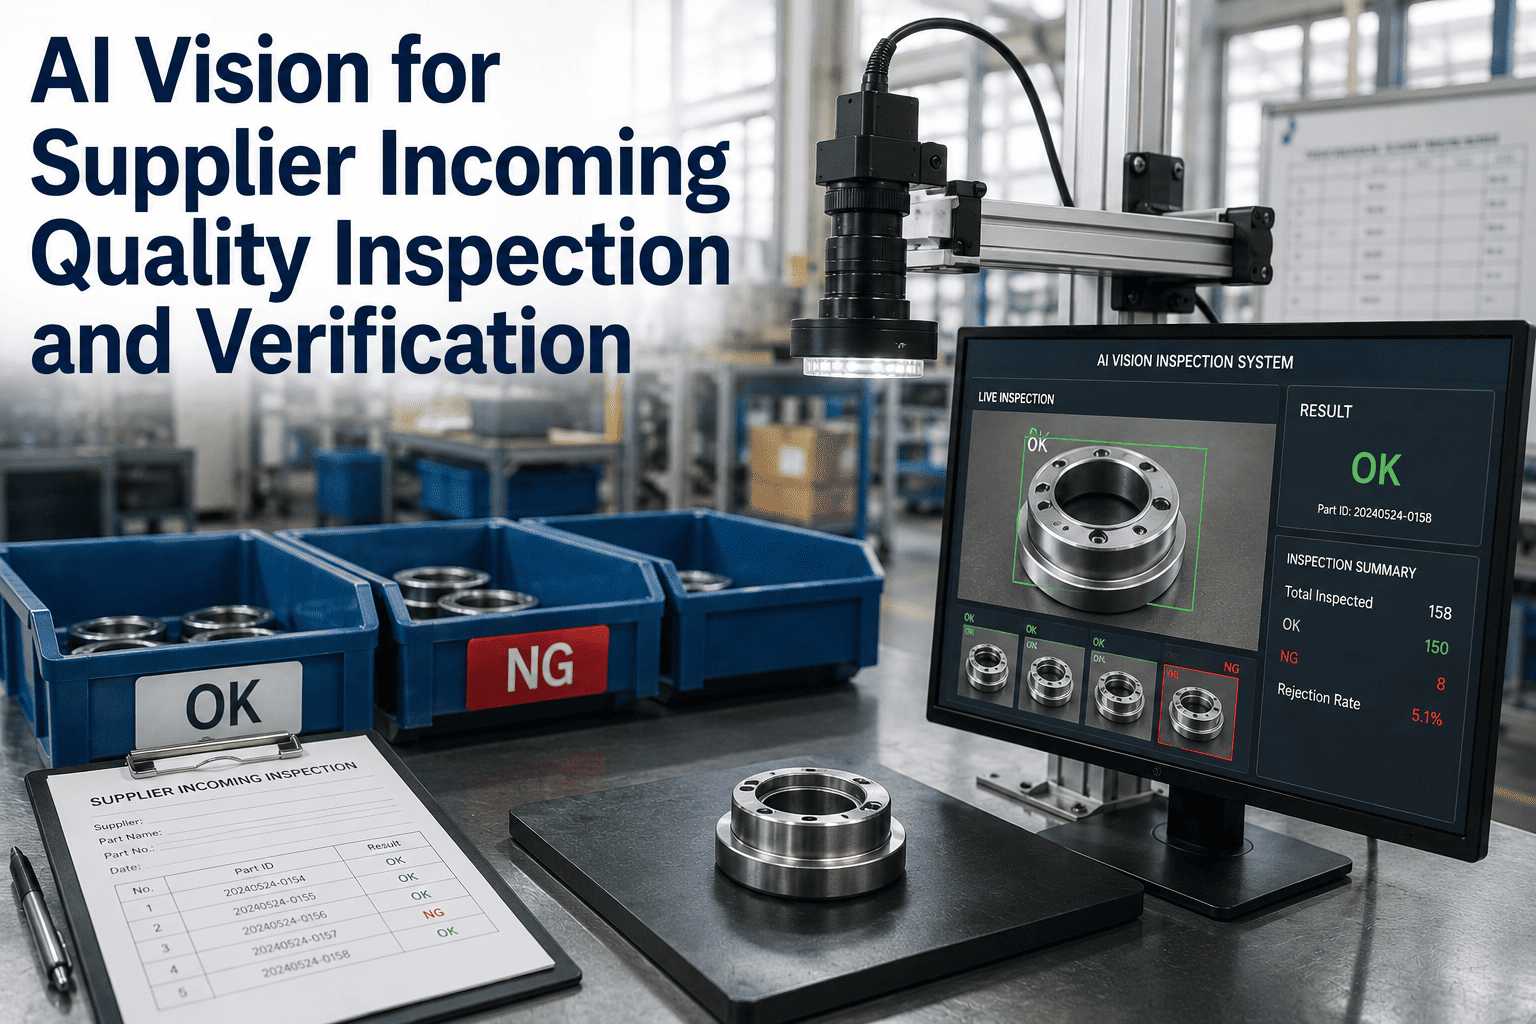
AI vision inspects each incoming part, generates classification output (accept, defect type A, defect type B), captures reference imagery, and writes the record with supplier, part number, lot number, and time stamp attached.
↓
02
Lot-Level Aggregation
Records aggregated per lot: total inspected, total accepted, defect count by type, PPM calculation for the lot. Lot disposition (accept, sort, reject) triggered from tolerance rules with full inspection evidence attached to the disposition.
↓
03
Supplier & Part-Number Rollup
Lots aggregated per supplier and per part number across rolling windows — 7 day, 30 day, 90 day, year to date. Trend calculation identifies suppliers whose PPM is improving, stable, or degrading over each window.
↓
04
Weighted Scorecard Calculation
Quality metric from inspection combined with delivery metric from ERP, cost metric from procurement, and corrective action metric from quality system. Weights applied per configured scorecard methodology, one composite score generated per supplier.
↓
05
Tier Assignment & Action Trigger
Composite score maps to tier A through D by pre-configured thresholds. Tier changes trigger workflow actions: preferred supplier promotion, corrective action requirement, second-source qualification, or disqualification review as appropriate.
The Action Matrix: What Each Scorecard Signal Should Trigger
A scorecard without connected actions is a report. A scorecard with clearly defined actions per signal is a management system. The matrix below maps common scorecard signals to the procurement or quality action they should trigger — not as rigid rules, but as the default starting point that keeps the scorecard from becoming an information exercise disconnected from supply base decisions. When exceptions to these actions get taken, they should be exceptions logged with reasoning, not the general pattern.
The other principle worth locking into the action matrix is that repeated signals from the same supplier should escalate automatically rather than restart at the base action every time. A supplier that trips a PPM alert three times in six months should not receive the same "please investigate" letter three times — the third instance should trigger a formal supplier development plan even if the individual events look similar to the first. Escalation logic built into the scorecard system removes the manual judgment that lets suppliers slip through by staying just under whatever threshold triggers hard action, and it builds the audit trail that shows procurement acted proportionately when the underlying performance called for it.
PPM trending up 30% over 90 days
Trigger supplier development conversation, request root-cause investigation, verify no process change on supplier side that explains the trend
Repeat defect same type across 3+ lots
Formal 8D corrective action request, containment inspection at 100% until CAR effectiveness verified, root cause must reach systemic level
PPM below 50 sustained over 12 months
Promotion to preferred tier, consideration for skip-lot inspection program, invitation to strategic supplier development track
Corrective action overdue > 30 days
Escalation to supplier quality leadership, hold on new business allocation, formal warning letter with recovery plan deadline
Defect rate spike from single lot only
Investigate lot-specific root cause, verify not systemic before rating action, retain full inspection evidence for supplier discussion
Delivery slip combined with quality slip
Supply risk review, initiate or accelerate second-source qualification, contingency planning for production continuity
Industry Benchmarks: What Good Looks Like By Sector
Supplier quality expectations are not universal — a defect rate that qualifies as world-class in one industry is entry-level in another. The benchmarks below reflect where mature supply bases in each sector actually operate, based on published supplier quality standards and observed practice across manufacturing supply chains. Setting scorecard thresholds without industry-appropriate benchmarks either lets underperforming suppliers stay in preferred tiers or holds every supplier to standards none can practically meet, both of which erode the credibility of the rating system with the internal teams who have to act on it.
Automotive Tier 1
Below 50 PPM preferred · Below 500 PPM standard
Standards effectively required by IATF 16949 certification and OEM supplier programs including VW Formel Q, BMW QMT, and Toyota TSSC. Quality and delivery weighted roughly equally at 30-35 percent each.
Precision Manufacturing
Below 100 PPM preferred · Below 500 PPM standard
Aerospace, medical device manufacturing, and precision components hold suppliers to automotive-adjacent standards with additional emphasis on process capability (Cpk above 1.33 for critical-to-quality characteristics).
Food & Beverage
Below 1000 PPM standard · Category-specific SLAs
PPM tolerance varies by product category and food safety criticality. Quality weight often elevated for suppliers of ingredients tied to allergen or contamination risk, with GMP compliance as baseline qualification.
Pharmaceutical & Medical Device
Quality weighted 40%+ · Zero-defect targets for critical components
Regulatory environment (FDA, GMP, ISO 13485) drives quality weighting above delivery. A single quality deviation can trigger a regulatory non-conformance, so the scorecard treats quality as a gate rather than a comparable metric.
Frequently Asked Questions
Our supplier disputes our defect counts. How does AI vision resolve that argument?
The core capability is evidence — every reject is logged with the image the AI captured, the classification the model produced, the time it was inspected, and the operator confirmation where applicable. When a supplier disputes a count, procurement pulls the evidence pack for the disputed lot and the conversation moves from opinion to fact. Suppliers with strong quality processes generally welcome this evidence because it lets them investigate specific rejects at their end rather than working from a summary number. Facilities can
Book a Demo to see the evidence pack format used in live supplier reviews.
What PPM threshold should we use for our suppliers?
Threshold varies by industry — automotive and precision manufacturing hold suppliers below 500 PPM as standard, with tier-one automotive OEMs commonly targeting 25 to 75 PPM for preferred suppliers. Food and beverage typically holds around 1,000 PPM depending on category. Pharmaceutical and medical device apply their own thresholds tied to regulatory quality expectations. The right threshold for a specific supply category is set by benchmark against comparable suppliers, aligned with contractual service level agreement, and locked in the scorecard system rather than negotiated per quarterly review meeting.
How does this integrate with our existing ERP and quality management systems?
The inspection layer generates structured records that feed the scorecard, but the composite score requires data from adjacent systems — ERP for delivery performance and receipt records, quality management for corrective action tracking, procurement systems for cost variance and commercial compliance. Integration happens through standard interfaces to each source system, so the composite scorecard reflects data everyone in the organization can trace back to their operating system. Teams building this integration can contact
iFactory Support for connector guidance across common ERP and QMS platforms.
How often should scorecards refresh, and how often should we review with suppliers?
The scorecard itself should refresh continuously — every inspection event updates the underlying data and the current score reflects the last 30 or 90 days depending on the window chosen. Formal supplier reviews typically happen quarterly for tier B suppliers, monthly for tier C, and weekly or per-lot for tier D suppliers on containment. Preferred tier A suppliers may only need semi-annual reviews since their scores are stable and their corrective actions are minimal. The refresh cadence and review cadence are different things — one is data-driven, the other is relationship-driven, and both need to be defined.
Should quality weighting increase for regulated industries?
Yes — pharmaceutical, medical device, and other regulated industries typically weight quality at 40 percent or more at the expense of delivery or cost weight, because a single quality deviation can trigger a regulatory non-conformance with consequences far beyond the immediate lot. Automotive typically stays balanced between quality and delivery because both feed directly into line-stop risk. The weighting decision is a governance question that involves procurement, quality, operations, and often regulatory affairs — but once agreed, the weights need to be locked in the scorecard system rather than adjusted by individual reviewers on a case-by-case basis.
SUPPLIER SCORECARD · AI VISION · DATA-DRIVEN PROCUREMENT
Turn Every Incoming Inspection Into Evidence That Drives Procurement Decisions
iFactory generates objective supplier scorecards from live incoming inspection data — PPM by supplier, defect trends by part number, lot-level evidence packs for review meetings, and automatic tier assignment that ends the negotiation over supplier ratings.