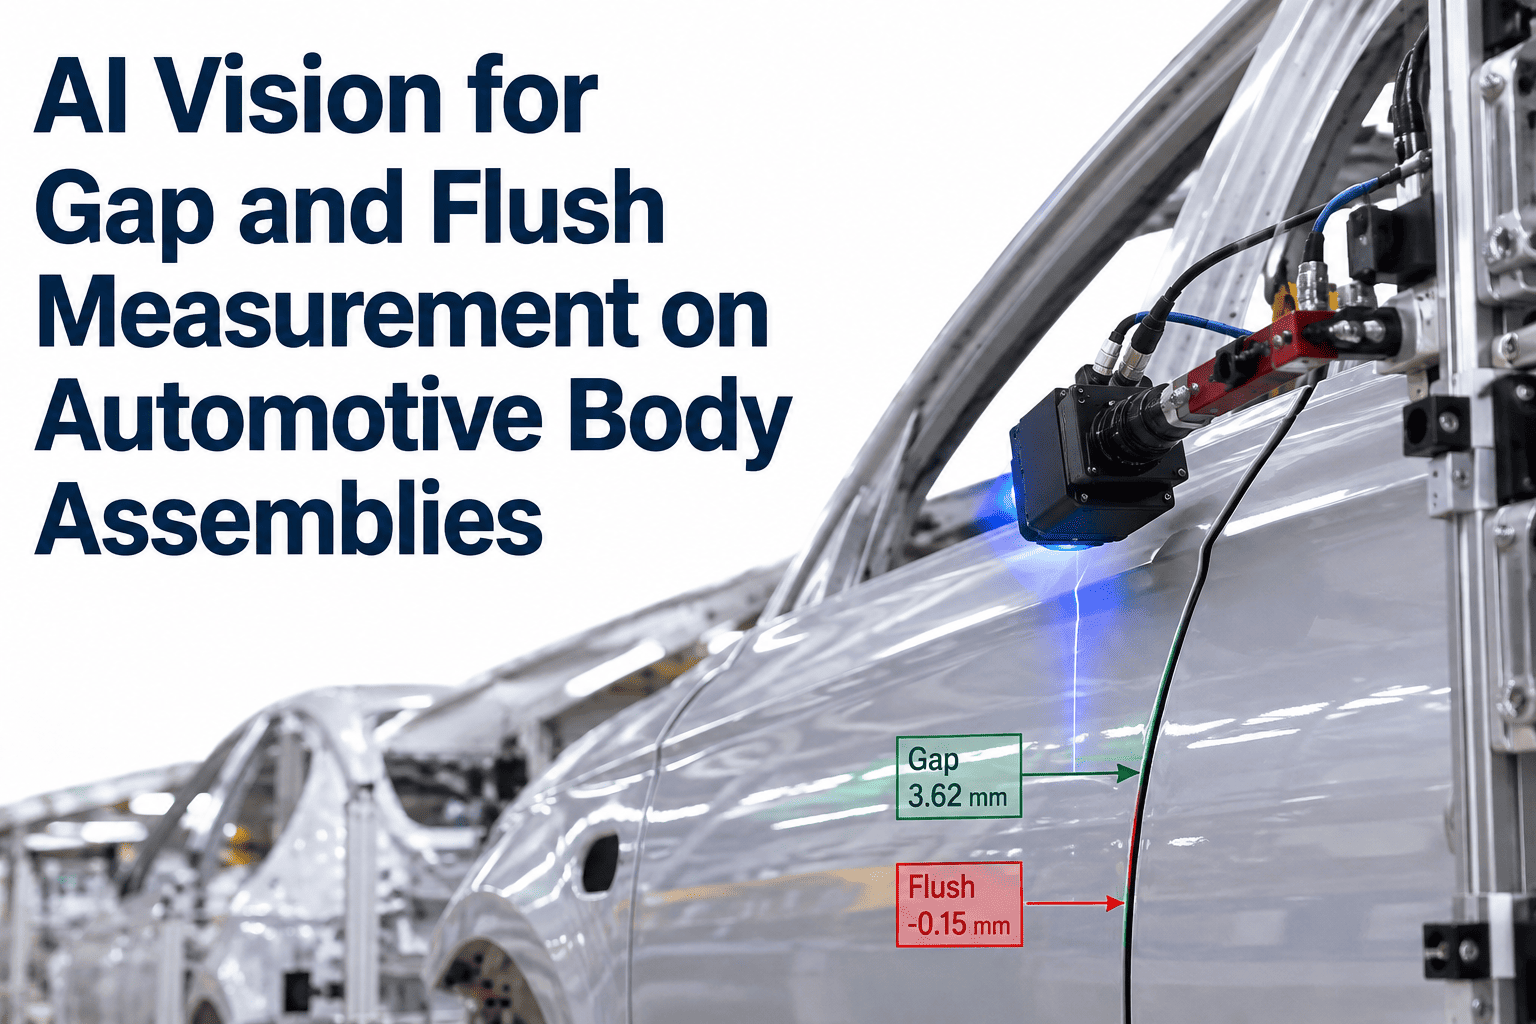
Gap and flush is the first thing a customer's hand and eye register when they walk up to a vehicle — long before they open a door, sit in a seat, or start the engine. A door sitting a millimeter proud of the fender, a hood that dips at one corner, a trunk lid with an uneven shut line — these are the details that quietly shape the perception of build quality on every OEM's showroom floor, and they're the details that final assembly plants have historically struggled to measure at line speed with any repeatability. Manual gauging with feeler gauges and flush gauges at fifty-plus inspection points around every body simply cannot keep up with a line running sixty vehicles per hour, and traditional 2D vision technology is fundamentally the wrong instrument for a measurement that is inherently three-dimensional. AI-powered 3D vision changes the economics — every body, every measurement point, sub-millimeter tolerance, at line speed. iFactory's dimensional inspection engineering team maps the sensor layout, CAD tolerance stack, and measurement point library to each vehicle program.
Automotive · Dimensional AI Vision
AI Vision for Gap and Flush Measurement on Automotive Body Assemblies
3D stereo and laser triangulation cameras measure every panel gap and flush deviation on every body against the vehicle's own CAD tolerances. No feeler gauges, no sampling, no inspector-dependent judgment — just sub-millimeter dimensional verification at line speed, feeding real-time SPC back to body-shop robotics before drift becomes rework.
Body Assembly Measurement Points
50+
Measurement points per body
±0.5mm
Typical tolerance requirement
100%
Bodies inspected at line speed
<60s
Full body measurement cycle
Why Gap and Flush Matters
The Perception Metric That Drives Warranty, Wind Noise, and Water Leaks
Gap and flush is one of a small number of vehicle quality dimensions that a customer notices without being told what to look for. A misaligned door, an uneven hood shut line, a trunk lid that reads asymmetric at a glance — these register in a customer's assessment of the vehicle within seconds of walking up to it, and they shape J.D. Power initial quality scores and long-term brand perception in ways that upstream OEMs measure in tenths of millimeters across every measurement point on the body.
Beyond perception, gap and flush deviations drive functional failures that cost the manufacturer real money. Uneven panel gaps produce wind noise that surfaces as customer complaints and dealer diagnostic hours. Non-flush shut lines produce water leak paths that trigger warranty repairs on seals, weatherstripping, and interior water damage. Poorly aligned doors pinch at the base, wear seals prematurely, and require dealer adjustment that gets billed back to the plant. Every one of these downstream costs traces back to a dimensional measurement that either was never taken or was taken with an instrument too imprecise or too slow to catch the deviation while it could still be corrected upstream.
The economic pressure is why modern OEMs have moved gap and flush measurement from a sampled end-of-line audit into a hundred-percent inline verification tied directly to body shop robotics. When every body is measured and the deviation data feeds back to the framing station, hemming line, and door hanging station in near real time, the root cause of drift gets identified within hours instead of days, and the plant catches robot programming errors, tooling wear, and framing variability before they produce a train of misaligned bodies that all need rework. That closed-loop dimensional control is the actual product of modern gap-and-flush AI vision, not just the measurement itself.
Measurement Method Comparison
Why 3D AI Vision Replaces Everything That Came Before
Every previous generation of gap and flush measurement has been limited by a specific technical constraint that made hundred-percent inline verification impossible. Understanding what those constraints were — and how 3D AI vision resolves them — is how quality leaders build the internal case for moving off legacy inspection methods.
| Method |
Speed |
Coverage |
Accuracy |
Data Output |
| Manual Feeler / Flush Gauges |
Slow — minutes per point |
Sampled bodies only |
Operator-dependent, ±0.2mm optimistic |
Paper or hand-entered log |
| Coordinate Measuring Machine (CMM) |
Very slow — offline audit only |
One body per shift or less |
Very high, ±0.05mm class |
Detailed but delayed by hours |
| Traditional 2D Vision |
Fast at line speed |
All bodies but limited views |
Gap width only — cannot measure flush |
Pass/fail on 2D dimensions |
| Handheld Laser Gauges |
Slow — one point per handling |
Spot check only |
High, ±0.1mm class |
Individual point readings |
| 3D AI Vision (Stereo / Laser Triangulation) |
Full body under 60 seconds |
Every body, every point |
Sub-millimeter, ±0.1mm class |
Live SPC feed to MES and robotics |
The pattern is clear. Manual methods have the flexibility but not the speed. CMM has the accuracy but not the throughput. 2D vision has the speed but cannot measure the flush dimension that matters most for perception and function. 3D AI vision is the first method to deliver full-body coverage, sub-millimeter accuracy, and line-speed throughput in one integrated system — which is why it has become the default choice for new body shops and the retrofit target for existing lines that need to close the gap-and-flush measurement loop.
See Live Dimensional Verification
Watch 3D AI Vision Measure Every Gap on a Full Body in Under a Minute
Book a walkthrough with iFactory's dimensional engineering team and see live gap-and-flush measurement running against real body footage — CAD-referenced tolerances, live SPC dashboards, and root-cause traceability back to specific framing station and door-hang parameters.
Measurement Zone Map
The Body Zones AI Vision Inspects on Every Vehicle
A full body gap-and-flush measurement covers between fifty and one hundred inspection points depending on vehicle program, distributed across the major panel interfaces. The AI vision system captures 3D stereo or laser triangulation data at each defined section, correlates it against the vehicle's CAD model, and computes gap width and flush deviation with sub-millimeter resolution. The zones below cover the standard measurement territory on a modern passenger vehicle.
Z1
Hood to Fender
Points: 6–10 per side · Tolerance: ±0.5mm typical
Front-end appearance interface visible from any angle in the showroom. Uneven hood shut lines are among the top customer perception complaints. Measured along the full length of the hood edge with paired gap and flush deviation at each section.
Z2
Front Door to Body
Points: 8–12 per side · Tolerance: ±0.5mm typical
A-pillar, roof rail, and rocker interfaces where door alignment drives both perception and function. Deviations here cause wind noise complaints and weatherstrip wear. Measured around the full door aperture with symmetry checks across left-right pairs.
Z3
Rear Door to Body
Points: 8–12 per side · Tolerance: ±0.5mm typical
Similar geometry to front door but with additional B-pillar interface and rear quarter panel interaction. Common site for shut-line asymmetry that becomes visible when both rear doors are closed side by side.
Z4
Front Door to Rear Door
Points: 5–8 per side · Tolerance: ±0.5mm typical
The B-pillar interface between the two doors — one of the most visible shut lines on the side of the vehicle. Asymmetry between front and rear door heights or gap widths at this interface is immediately obvious to any customer looking at the side profile.
Z5
Trunk Lid / Liftgate
Points: 8–15 total · Tolerance: ±0.5mm typical
Rear end panel interface with rear quarter panels and rear bumper. Water leak paths here trigger interior trunk damage warranty claims. Measured around the full aperture with symmetric gap requirements across the vehicle centerline.
Z6
Fuel Filler Door
Points: 4–6 total · Tolerance: ±0.5mm typical
Small aperture but highly visible from close range. Flush deviation here is the classic case where a customer notices a quality issue before the salesperson does. Measured as a full-perimeter check with pop-out actuation validation.
The Technology Stack
How the 3D AI Vision System Actually Measures
Gap-and-flush measurement is fundamentally a 3D metrology problem — a 2D image cannot distinguish between a flush interface and one where two panels are millimeters apart in the surface-normal direction. Modern 3D AI vision systems combine specialized sensing hardware with CAD-referenced software to deliver measurements that a decade ago required a CMM to produce.
01
Stereo Camera Pairs or Laser Triangulation Sensors
Calibrated stereo camera pairs capture paired images from known geometric offsets, or laser profilers project a structured line onto the panel surface. Either approach reconstructs 3D coordinates of the gap edges and adjacent panel surfaces with sub-millimeter accuracy.
02
Infrared Edge Highlighting
Glossy painted panels and chrome trim create specular reflections that defeat naive optical measurement. Calibrated infrared LED lamps highlight the edges of a gap through controlled reflection, tracing the panel edge reliably even on high-gloss finishes and glass interfaces.
03
Robot-Mounted or Fixed Rig Positioning
Sensors are either mounted on robots that travel a pre-programmed path around a stationary body, or arranged in a fixed multi-sensor rig that images a moving body as it passes through the measurement tunnel. Either configuration covers the full measurement point library within the takt time budget.
04
CAD Model Correlation
Measurement targets come directly from the vehicle's 3D CAD model. Real-world sensor data is correlated against the CAD at each defined measurement section to calculate gap and flush deviation against the specific engineering tolerance for that section — not against a generic industry default.
05
AI-Driven Edge Detection and Adaptation
Deep learning models identify panel edges under varying paint colors, lighting conditions, and panel geometries that would confuse rule-based edge detection. The AI adapts to new vehicle programs and paint codes without requiring full re-programming for every new variant that enters production.
06
SPC Feedback to MES and Robotics
Every measurement is logged with body ID, section coordinates, gap and flush values, and pass/fail against tolerance. Data streams into MES-integrated SPC dashboards where drift patterns identify root cause back to specific body shop stations, allowing corrective action within hours instead of days.
The Tolerance Cascade
Where Gap and Flush Deviations Actually Come From
A gap-and-flush deviation measured at the end of body assembly is almost never caused at that point — it's the accumulated result of upstream tolerance stack-up across framing, hemming, door hanging, and adjustment. Understanding the cascade is how the measurement data actually gets used to fix the process instead of just documenting the failure.
C1
Stamping Tolerance
Panel dimensional accuracy from the stamping press — die wear, springback variation, and material property drift all produce panels that are within stamping tolerance but at the outer edge of the acceptance envelope. This is where the cascade starts, and where in-die measurement upstream pays back downstream.
C2
Body-in-White Framing Variability
The framing station is where individual panels become a rigid body structure, and small variations in weld gun positioning, fixture wear, or clamp force produce structural offsets that carry through the entire downstream assembly. Framing drift is one of the most common upstream causes of gap-and-flush issues detected later.
C3
Hemming Line Alignment
Doors, hoods, and trunk lids are hemmed as sub-assemblies before being mounted to the body. Hemming variability produces panel edge conditions that then interact with framing variability, and the two combine to produce shut-line asymmetry that's hard to trace back to a single root cause without dimensional data at both stations.
C4
Door and Closure Hanging
Closure panels are mounted to the body at the door-hang station, and hinge position, latch alignment, and mounting bolt torque all affect final gap-and-flush position. Even a body and door that are both within their individual tolerances can produce a poorly aligned interface if the hanging process introduces its own drift.
C5
Final Adjustment Station
Historically the plant's last chance to fix upstream cascade issues — skilled adjusters manually shim, adjust, and re-torque closures to hit gap-and-flush targets. Reducing dependence on this station by fixing upstream causes is the actual long-term goal of AI vision measurement; the measurement data is what makes that shift possible.
Deployment Roadmap
From Kickoff to Live Body Measurement
A dimensional AI vision deployment for gap and flush measurement typically runs eight to fourteen weeks from kickoff to production go-live, driven primarily by CAD model preparation, measurement point library definition, and validation against baseline CMM data. The phases below are the standard sequence that mature deployments follow.
Phase 1
CAD Reference and Point Library
Vehicle CAD model imported into the measurement platform. Measurement point library defined by engineering — every gap, every flush section, every tolerance value. This phase determines what will be measured and against what target.
Phase 2
Sensor Rig Design and Install
Stereo camera pairs or laser profilers positioned to cover every measurement point within the takt time budget. Robot-mounted or fixed rig configuration selected based on line layout, cycle time, and existing infrastructure.
Phase 3
Calibration and CMM Correlation
System calibrated against known-good calibration bodies and correlated against CMM measurements of the same bodies at the same sections. This is where measurement accuracy is proven to engineering standards before production use.
Phase 4
Shadow Mode Production
System runs alongside existing inspection, measuring every body but not yet driving pass/fail routing. Data compared against manual gauges and CMM audits to validate consistency across the full production mix and paint code library.
Phase 5
Go-Live with SPC Integration
System takes over primary measurement responsibility. SPC dashboards go live to body shop supervisors, quality engineers, and process engineers. Manual gauging drops to audit-level sampling only.
Phase 6
Root-Cause Loop and Continuous Learning
Measurement data drives closed-loop correction at framing, hemming, and door-hang stations. AI models continuously improve as more measurement history accumulates across paint codes, model variants, and production shifts.
Field Perspective
"
The change I've watched over the last five years isn't just that gap-and-flush measurement got faster and more accurate — it's that the measurement finally became actionable in real time. When we measured with feeler gauges on sampled bodies, we found out we had a framing issue three shifts after it started, and by then we had a hundred bodies to rework. When 3D AI vision measures every body and pushes the data into an SPC dashboard, the framing supervisor sees the drift starting within the first ten bodies, and we fix the root cause before it produces a rework train. That's the shift that changes the economics — not the measurement itself, but the speed of the feedback loop from measurement to correction. Every plant I've deployed this in has seen the same pattern: the technology pays for itself on the rework it prevents, not on the labor it displaces. And once the data starts driving robot programming corrections at framing, the whole body shop reliability picture improves in ways nobody predicted at kickoff.
Anouk Delaney-Nakashima
Automotive Dimensional Quality Director · 21 years in body-in-white metrology, 3D vision deployment, and closed-loop process control
Common Questions
Frequently Asked Questions
How does the system handle specular reflection on glossy paint and chrome?
Specular reflection is the classic reason naive optical measurement fails on painted automotive panels, and it's addressed at the hardware level rather than through software correction. Calibrated infrared LED lamps and controlled lighting geometry trace the edges of a gap even on chrome, glass, and high-gloss paint by using specular reflection as a feature rather than fighting it. Laser triangulation and 3D stereo methods are both designed with automotive-grade reflective surfaces as a core use case, not an edge case. The system handles reflective panels reliably out of the box for standard automotive finishes.
Talk to dimensional engineering about your specific paint code library.
How does the system know what the "correct" gap and flush values are for each measurement point?
Measurement targets come directly from the vehicle's 3D CAD model. Real-world stereo camera or laser profiler data is compared against that CAD model at each defined measurement section to calculate the actual gap and flush deviation. This means acceptance criteria are specific to the vehicle program and body design rather than a generic industry default, and can be adjusted as engineering tolerances change across model years or as new variants enter the program. The CAD reference model is the source of truth, and the AI vision system measures the vehicle against its own engineering standards.
What is the actual accuracy of 3D AI vision compared to a CMM?
CMM accuracy is typically in the ±0.05mm class for the specific point being measured. Modern 3D AI vision systems for gap and flush deliver ±0.1mm class accuracy at line speed across the full body measurement point library. The gap between the two accuracies is real but is typically within the engineering tolerance envelope for gap and flush specifications, which are usually specified at ±0.5mm. The tradeoff of a small accuracy loss for a massive throughput gain is what makes AI vision the right choice for inline production measurement, while CMM remains the correct choice for offline capability studies and reference calibration.
Can the system handle multiple vehicle programs on the same line?
Yes, and this is one of the most common deployment scenarios. The system identifies the vehicle program from body ID or barcode at line entry, loads the corresponding CAD model and measurement point library, and executes the correct measurement sequence for that specific vehicle. Multi-program flexibility is standard for modern mixed-model body shops, and the AI models adapt to new programs without requiring full reconfiguration of the sensor rig. Adding a new vehicle program to an existing installation typically requires only CAD import and measurement point library definition, not new hardware.
Book a demo to walk through multi-program handling.
How does the SPC feedback actually drive body shop corrections?
Every measurement result feeds into an SPC dashboard segmented by measurement zone, body variant, and time period. When gap or flush values at a specific zone start drifting toward the tolerance limit, the trend is visible to body shop supervisors and process engineers within the first several bodies rather than after a full shift of accumulated rework. Root-cause analysis correlates the drift back to specific upstream stations — framing, hemming, or door-hang — and the correction is applied at that station within hours rather than days. This is the closed-loop control that turns measurement data from a documentation artifact into an active process control input, and it's where the ROI on 3D AI vision actually comes from.
Body Shop Ready for Closed-Loop Dimensional Control
Measure Every Body Against Its Own CAD Model at Line Speed
iFactory's 3D AI vision platform for gap and flush measurement is built for the specific demands of automotive body assembly — sub-millimeter accuracy against CAD tolerance, hundred-percent inline coverage, and SPC feedback that drives real corrections at framing, hemming, and door-hang stations. Eight to fourteen weeks from kickoff to live measurement, and the closed-loop control starts paying back from month one.