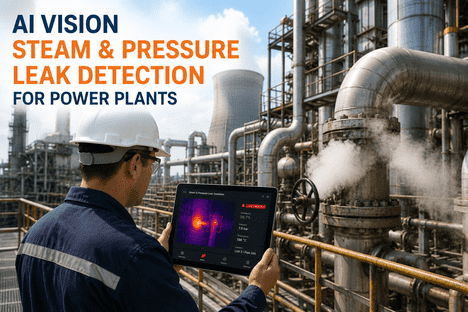
A modern combined cycle plant depends on its heat recovery steam generator to convert gas turbine exhaust heat into usable steam, and when a fin tube inside an economizer or evaporator bank quietly starts thinning from flow-accelerated corrosion, the plant does not usually find out until either an outage inspection catches it or a tube ruptures during operation. Industry data indicates that HRSG tube failures are the single largest contributor to combined cycle forced outages, with flow-accelerated corrosion alone driving a substantial share of those events, and cycling operation to follow renewable generation has only made the problem worse. iFactory brings AI vision to routine HRSG inspection — cameras and image analysis focused on fin tube condition, header connections, and casing integrity across the sections most vulnerable to FAC, sagging, and thermal fatigue — with the full workflow explained at iFactory support.
AI Vision Inspection · Heat Recovery Steam Generator
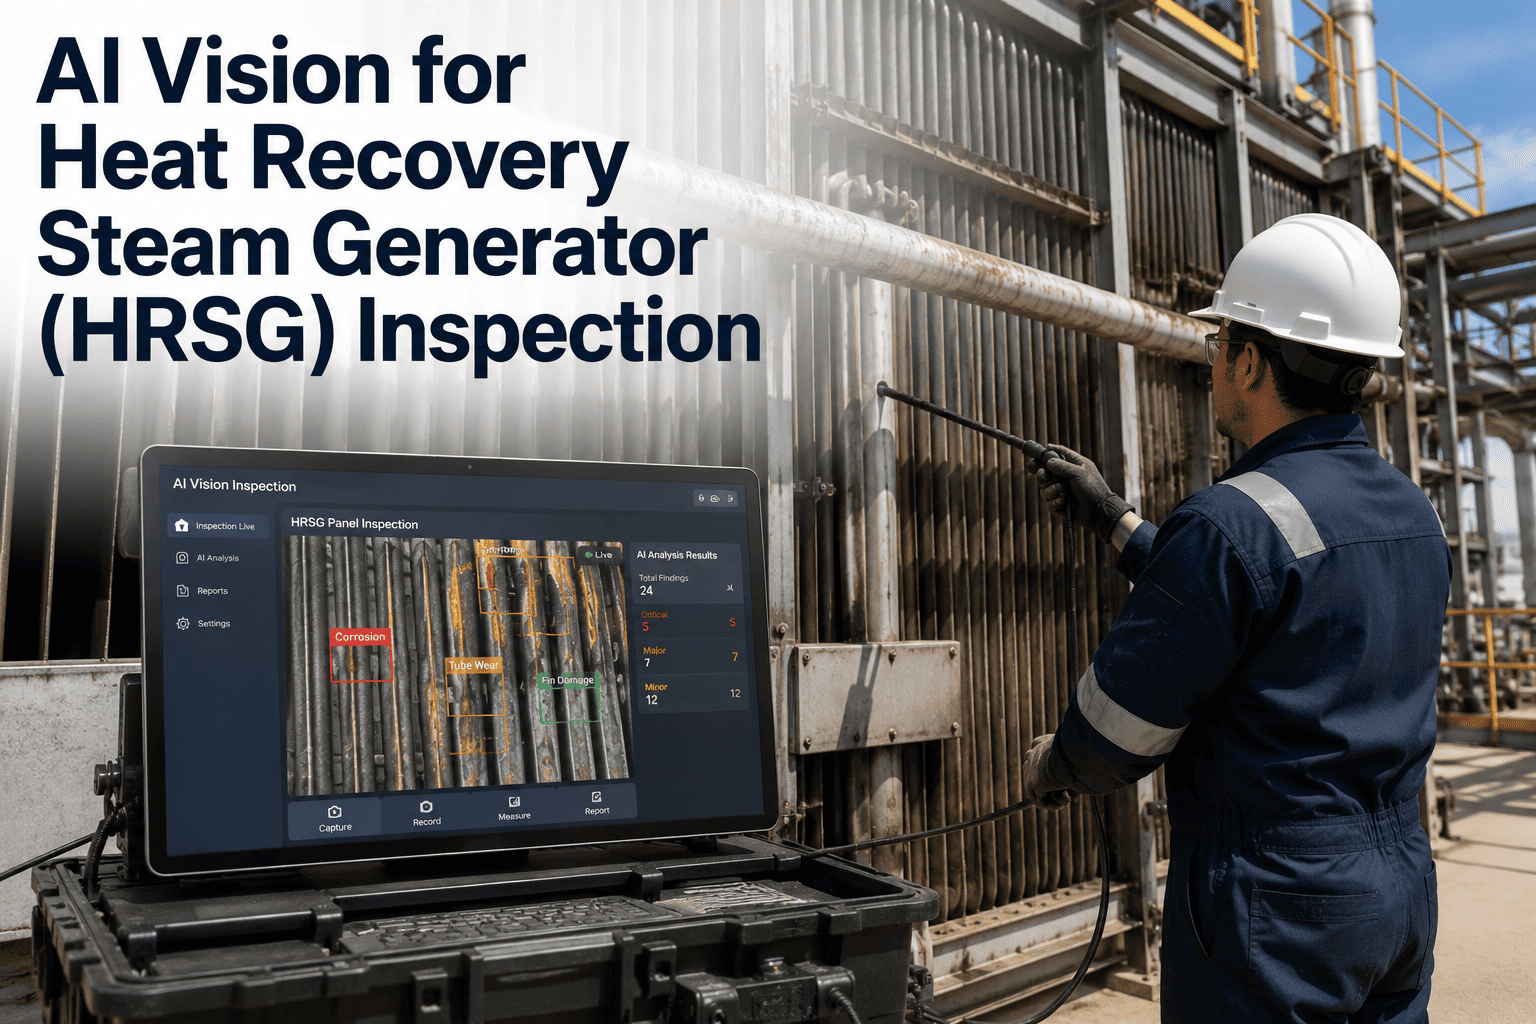
AI Vision for Heat Recovery Steam Generator (HRSG) Inspection
iFactory deploys camera-based inspection across HRSG fin tube banks, header connections, and casing surfaces, detecting flow-accelerated corrosion, tube sagging, and structural degradation before they impact combined cycle output.
6+
Forced outage events per unit-year from tube failures across the industry
70%
Of HRSG tube failures influenced by cycle chemistry conditions
25,000 hrs
FAC wall thinning detectable within, on susceptible components
4
HRSG sections continuously covered by camera analytics
HRSG Section Anatomy
Where Combined Cycle Reliability Actually Gets Won or Lost
An HRSG is not one uniform vessel — it is a stack of tube banks in series, each doing a different thermodynamic job, and each with its own dominant failure mode. Camera-based inspection has to know which section it is looking at to interpret what a defect actually means.
01
Superheater
Highest steam temperature, thermal fatigue and creep dominate
Sagging, oxidation, thermal fatigue
↓
02
Evaporator
Two-phase flow, FAC and under-deposit corrosion active zone
FAC wall thinning, deposits
↓
03
Economizer
Single-phase FAC on elbows and bends, feedwater chemistry sensitive
Single-phase FAC, elbow thinning
↓
04
Casing & Ducting
Acid dewpoint corrosion, thermal insulation gaps, structural fatigue
Dewpoint attack, casing distortion
The Failure Mode Landscape
What Actually Goes Wrong Inside an HRSG, and How Often
Root cause analysis across hundreds of HRSG units over the past decade points to a small set of dominant failure mechanisms. Cycle chemistry is the single largest influence, but the specific mode that ends up cracking or thinning a tube depends on section, operating regime, and how aggressively the unit is being cycled.
~40%
Flow-Accelerated Corrosion (FAC)
Widely reported as one of the most damaging HRSG failure mechanisms. Single-phase FAC attacks economizer elbows and bends; two-phase FAC attacks evaporator sections. Wall thinning can progress rapidly under adverse water chemistry.
Cycling
Thermal Fatigue & Corrosion Fatigue
Rapid thermal gradients from two-shift starts induce cyclic strain in tubes, headers, and structural steel. Chemistry excursions during startups compound the damage.
Local
Under-Deposit Corrosion
Oxide scale and impurity deposits from poor cycle chemistry create local corrosion sites under the deposit, hidden from external inspection until wall breach.
Cold End
Acid Dewpoint Corrosion
Exhaust gas moisture condenses with sulfur compounds on cold-end tubes, forming acid that wastes metal over time. Visible as staining, pitting, and casing corrosion.
Support
Tube Sagging & Bowing
Progressive deformation from thermal cycling, support failure, or creep. Sagging tubes create flow maldistribution that accelerates other damage mechanisms.
Casing
Insulation & Structural Distortion
Casing panel bulging, insulation slumping, and duct deformation from repeated thermal loading. Visible externally but often ignored until a hot spot appears on thermography.
Camera Coverage Map
Where Vision Systems Actually Watch Inside the HRSG
Zone A
Fin Tube Bank Surfaces
Cameras positioned at inspection ports capture fin tube rows across economizer, evaporator, and superheater banks. The vision model identifies discoloration patterns, deposit buildup, and geometric changes in tube spacing that indicate sagging.
Discoloration and staining from FAC precursors
Fin deformation, damage, and bridging
Tube-to-tube spacing drift indicating sagging
Deposit accumulation between fin gaps
Zone B
Header Connections
Header stubs, welds, and tube-to-header transitions are the highest-stress geometric features in the HRSG. Vision monitors these for cracking, leakage indicators, and mechanical distortion.
Weld condition and cracking indicators
Stub deformation and misalignment
Leakage stains and salt deposits
Zone C
Casing & Insulation
External cameras cover casing panels, duct joints, and insulation surfaces. Combined with periodic thermal imaging, the system identifies hot spots that indicate internal insulation collapse or refractory failure.
Casing bulging and panel distortion
External hot spot detection via thermal fusion
Duct joint gaps and seal degradation
Cold end tube sections and stack interior surfaces are the acid dewpoint corrosion zone. Cameras track surface condition changes and dripping indicators associated with condensate formation.
Acid stain progression on cold-end tubes
Dripping and condensate track patterns
Stack liner corrosion and metal loss
Inspection Workflow Timeline
From Camera Capture to Actionable Maintenance Priority
Continuous
Camera Capture
Fixed cameras at inspection ports and mobile inspection cameras during outages feed images and video into the platform. Existing plant CCTV coverage of casing and stack areas can also be incorporated.
Real Time
Zone Identification
Each incoming frame is tagged with the HRSG section and bank it corresponds to, so a fin tube in the low-pressure economizer is analyzed against a different reference than the same tube geometry in a superheater bank.
Real Time
Vision Analysis
Trained detection models flag discoloration patterns, geometry changes, deposit buildup, weld defects, casing distortion, and dewpoint stains, with each detection bounded and classified against the zone-appropriate defect library.
Per Detection
Severity Ranking
Each finding is ranked by severity and rate of change against prior captures of the same location, so a stain that has been stable for two years is treated differently from one that emerged in the last inspection interval.
Automatic
Work Order Trigger
High-severity or fast-progressing findings automatically generate a maintenance task with location, image evidence, severity grade, and recommended follow-up inspection method attached for the reliability team to action.
Outage Prep
Inspection Planning
Findings accumulated between outages are compiled into a prioritized inspection scope, so the outage window is spent on locations vision analytics has already flagged rather than a blanket sweep.
Cycling Duty Is Making HRSG Failure Modes Faster and More Aggressive. Blanket Outage Inspection Alone Is Not Keeping Up.
Vision analytics runs continuously between outages, building a trended condition record so the outage plan focuses on what has actually changed.
Traditional Outage-Only vs. AI Vision Between Outages
Where the Two Approaches Diverge in Practice
Aspect
Outage-Only Inspection
iFactory AI Vision Coverage
FAC Detection Speed
Only visible during scheduled outages, often after significant wall loss has occurred
Discoloration and surface signatures flagged as they progress between outages
Tube Sagging Recognition
Judged visually during outage walkdown against inspector memory of prior condition
Geometric spacing drift measured against captured baseline of the same bank
Header Weld Monitoring
Selective NDE during outages based on prior failure history
Continuous vision monitoring for cracking indicators and leakage stains
Casing Distortion
Noticed by operators walking the unit, often reported informally
Panel geometry compared frame-by-frame against baseline reference imagery
Outage Planning Depth
Scope built from generic checklists and known problem history
Scope built from actual detections and severity trends across the interval
Historical Record
Written reports and selected photographs stored per outage
Full searchable image and detection history tied to unit, section, and date
Outcomes Reported by Combined Cycle Reliability Teams
What Changes in the First Two Years After Deployment
Weeks
Earlier Detection of Progressing FAC
Discoloration and surface signature changes indicative of active FAC are typically visible on camera weeks to months before the next scheduled internal inspection would identify them.
30 – 45%
More Targeted Outage Scopes
Outage inspection scopes shift from blanket coverage toward locations vision analytics has already flagged, meaningfully reducing outage inspection labor hours.
100%
Coverage of Visible Surfaces
Every fin tube surface visible through an inspection port, every visible header weld, and every accessible casing panel is analyzed against the same standard, every time.
Trended
Rate-of-Change Awareness
Every finding is compared against prior captures of the same location, so growth rate — not just presence — informs the maintenance priority ranking.
Full History
Searchable Defect Record
Every detection stays queryable by section, defect class, and severity across years, surviving inspector turnover and shift changes without institutional knowledge loss.
Zero
Manual Log Entries Required
Findings flow into the plant maintenance system automatically as tasks with images attached, removing the manual step of transcribing inspector notes into work orders.
Field Example
Catching an Economizer FAC Signature Six Months Before the Next Scheduled Outage
A combined cycle plant running two-shift cycling duty to follow renewable generation had a documented FAC susceptibility on its low-pressure economizer bends, with the next planned internal inspection scheduled roughly a year out. Vision cameras at the inspection ports for that bank had been capturing weekly stills into iFactory for six months when the model flagged a progressive discoloration pattern developing on one elbow group, consistent with active single-phase FAC.
The reliability team pulled forward a targeted eddy current inspection of the flagged elbows during the next mini-outage window and confirmed measurable wall loss consistent with the vision finding. The affected elbows were scheduled for replacement at the following planned outage rather than reactively during a forced outage, and the rate-of-change signature is now used as a reference case for that specific failure mode across the fleet's other cycling units. The plant estimated that catching the FAC site through the vision workflow, rather than through a rupture during operation, avoided one likely forced outage event and the associated combined cycle unavailability, lost dispatch revenue, and emergency repair mobilization. The vision baseline captured during the six-month interval before detection is now retained as the reference the site uses to evaluate similar discoloration patterns emerging on other economizer bends in the same bank, and the reliability team has extended dedicated camera coverage to the corresponding sections on the plant's second combined cycle unit as well.
6 months
Lead time versus next scheduled inspection
1 elbow group
Localized to the specific FAC site
Planned
Replacement, not forced outage repair
Frequently Asked Questions
What HRSG Reliability Engineers Ask First
Can camera-based vision actually detect flow-accelerated corrosion, since FAC is a wall-thinning phenomenon?
Vision analytics does not measure wall thickness directly — for that, eddy current, ultrasonic, or pulsed eddy current NDE remain the accepted methods. What vision does detect are the visible surface signatures associated with active FAC, including characteristic discoloration patterns, orange-peel surface texture, and localized deposit or staining changes at elbows and bends. These signatures typically appear before wall loss becomes critical, so the platform is used to flag locations that then get prioritized for NDE measurement, rather than replacing the NDE step itself. To see how the workflow fits alongside your existing NDE program,
book a demo.
How much of the HRSG can cameras actually see from the outside inspection ports?
Camera coverage from external inspection ports typically reaches the first several rows of tubes in each bank, plus header connections and stub geometry near the ports. The interior rows of large tube bundles remain accessible only during outage internal inspection with borescopes or drones. What cameras do cover well is the exterior fin tube surfaces visible through the ports, casing and stack surfaces from the outside, and header connections that are visible during operation, which together account for the majority of externally-visible failure mode signatures. Coverage design is customized per HRSG model during onboarding, and the
support team can walk through what your specific unit geometry allows.
Do we need new cameras, or can existing plant CCTV feeds be used?
Both work. For casing, stack exterior, and general HRSG structure monitoring, existing plant CCTV feeds pointed at the HRSG can often be incorporated with a network connection alone. For higher-resolution work at inspection ports on fin tube banks and header connections, dedicated inspection cameras are typically installed to give the vision model the image quality it needs to detect early signature changes. A mix of both is common in practice — existing feeds cover general structural monitoring while a small number of dedicated cameras focus on the highest-risk tube banks and headers.
How does the system handle the harsh environment inside and around an HRSG?
Cameras deployed at inspection ports and around the HRSG shell are specified for the ambient temperatures, dust levels, and vibration typical of a combined cycle plant environment. Enclosures and mounting hardware are matched to the intended location — high-temperature-rated housings near the hot end, standard industrial IP-rated enclosures around casing and stack areas. The platform itself runs on standard plant infrastructure and does not require anything mounted in the flue gas path or in direct contact with high-temperature surfaces, keeping the hardware installation footprint conventional and maintainable.
How long does deployment take on an operating combined cycle unit?
For a plant that already has adequate camera coverage on its HRSG and wants to add vision analytics on top of existing feeds, deployment typically takes four to six weeks including model configuration for the specific HRSG geometry and baseline capture. For plants installing new dedicated inspection cameras at fin tube ports and header locations, deployment takes eight to twelve weeks depending on how many camera positions are needed and whether the installation can happen during operation or needs to be scheduled around an outage. To scope your specific unit and get a timeline,
book a demo.
Turn Every HRSG Inspection Cycle into a Trended, Repeatable Condition Record.
AI vision coverage across fin tube banks, header connections, and casing surfaces — flagging the failure modes that cause combined cycle forced outages before they cost you a start.