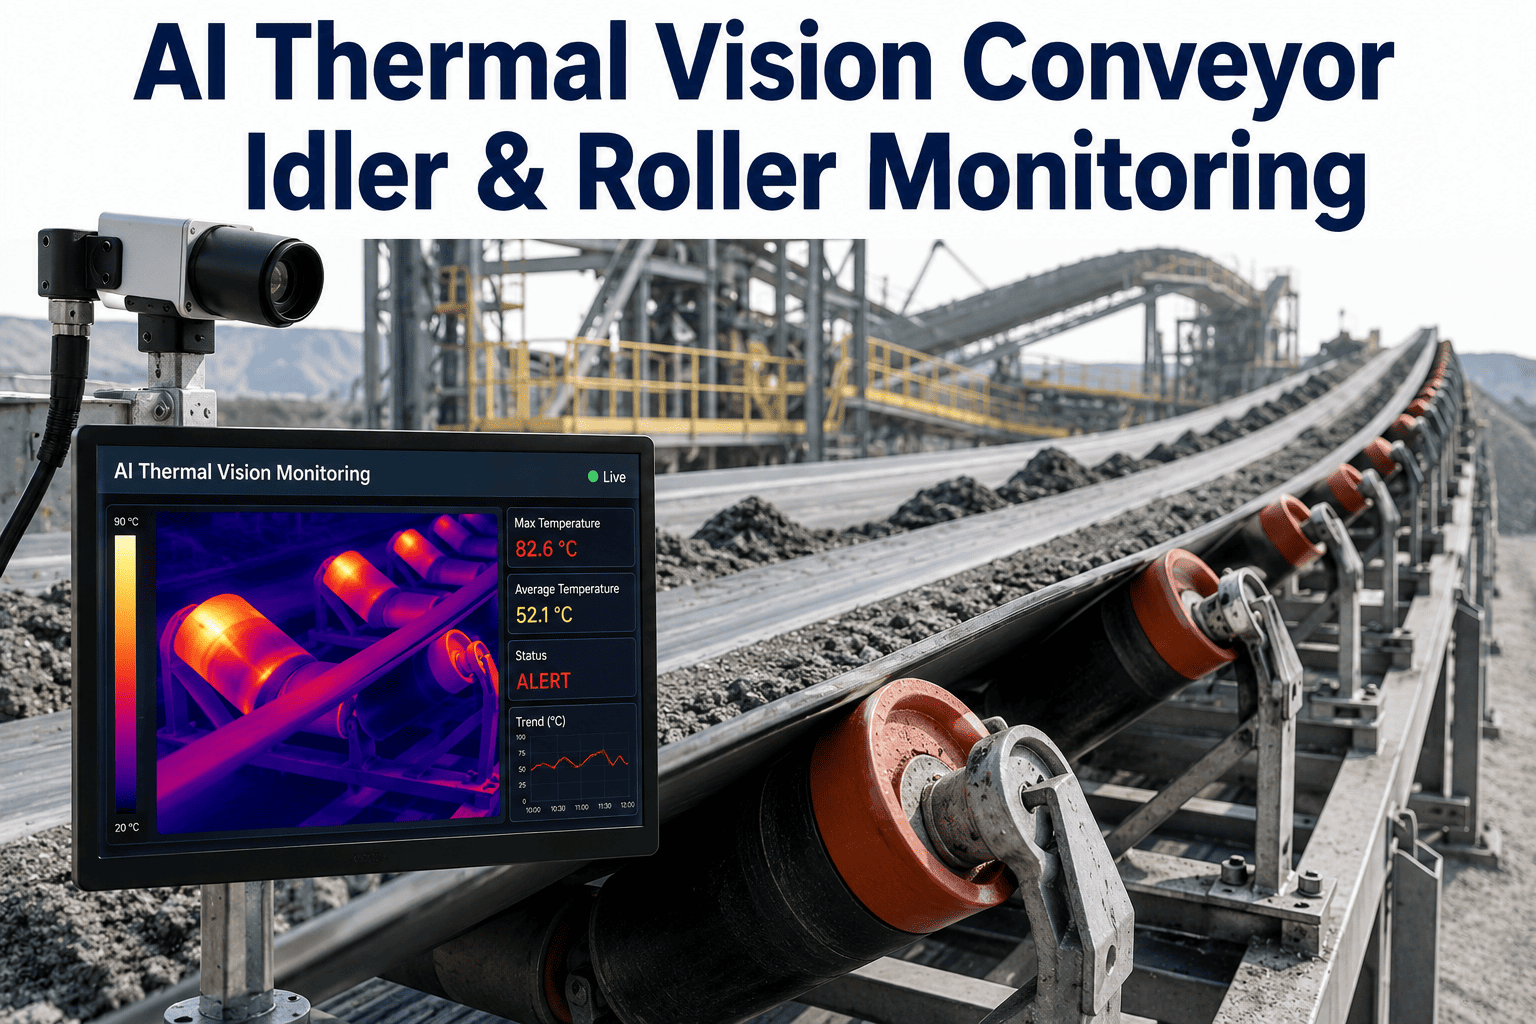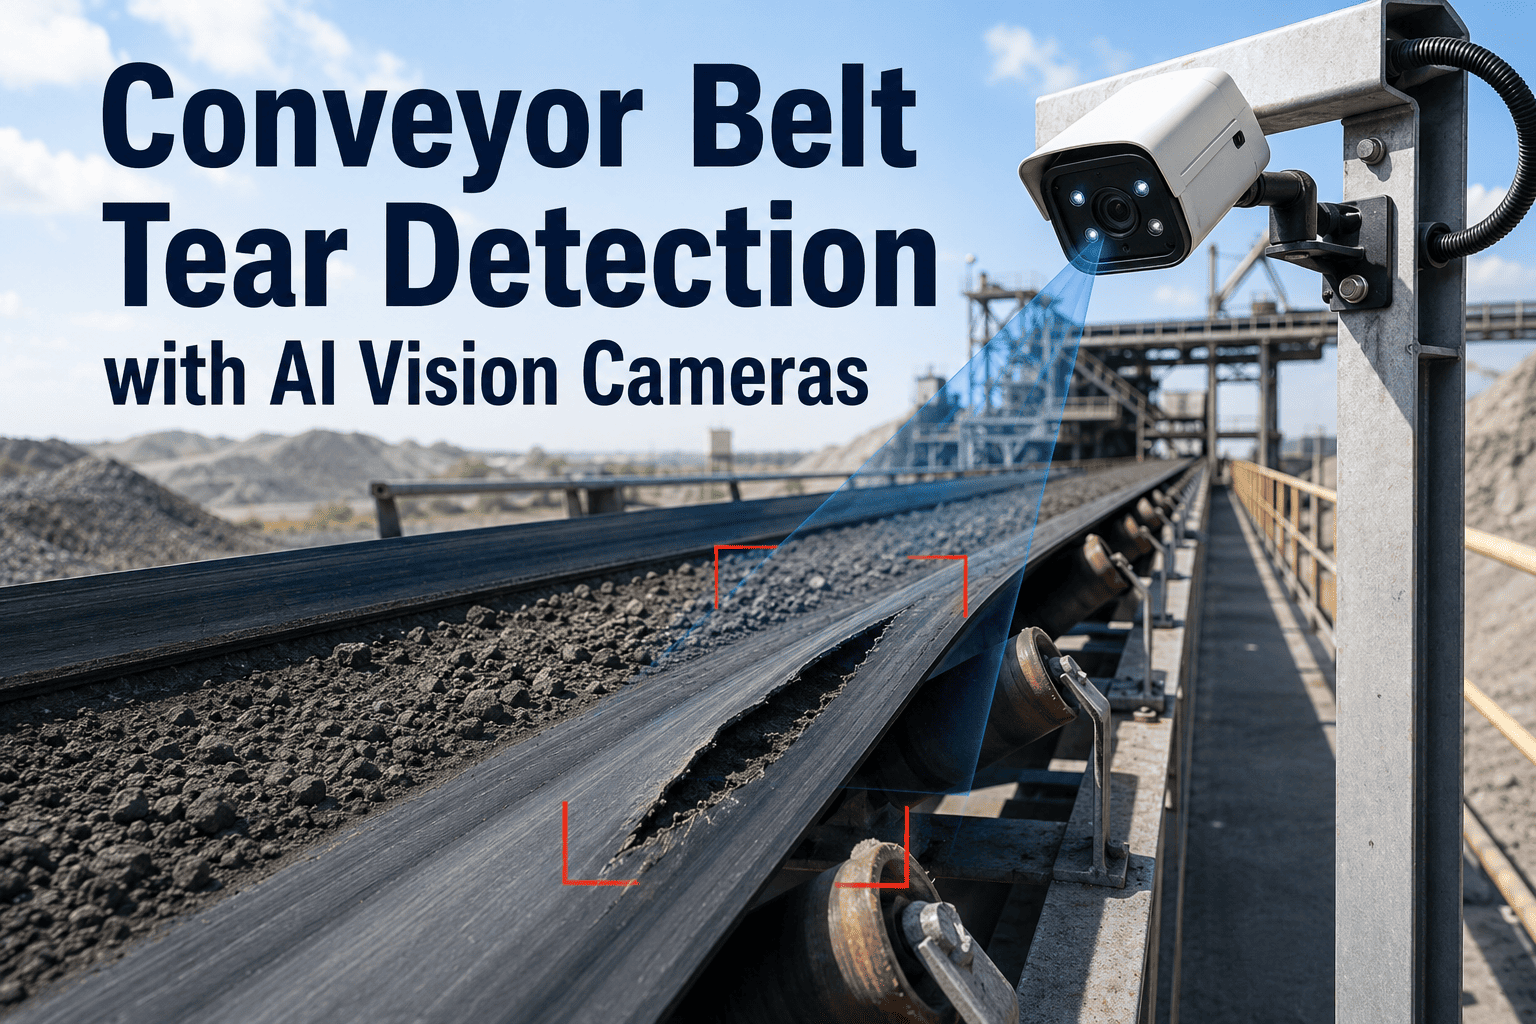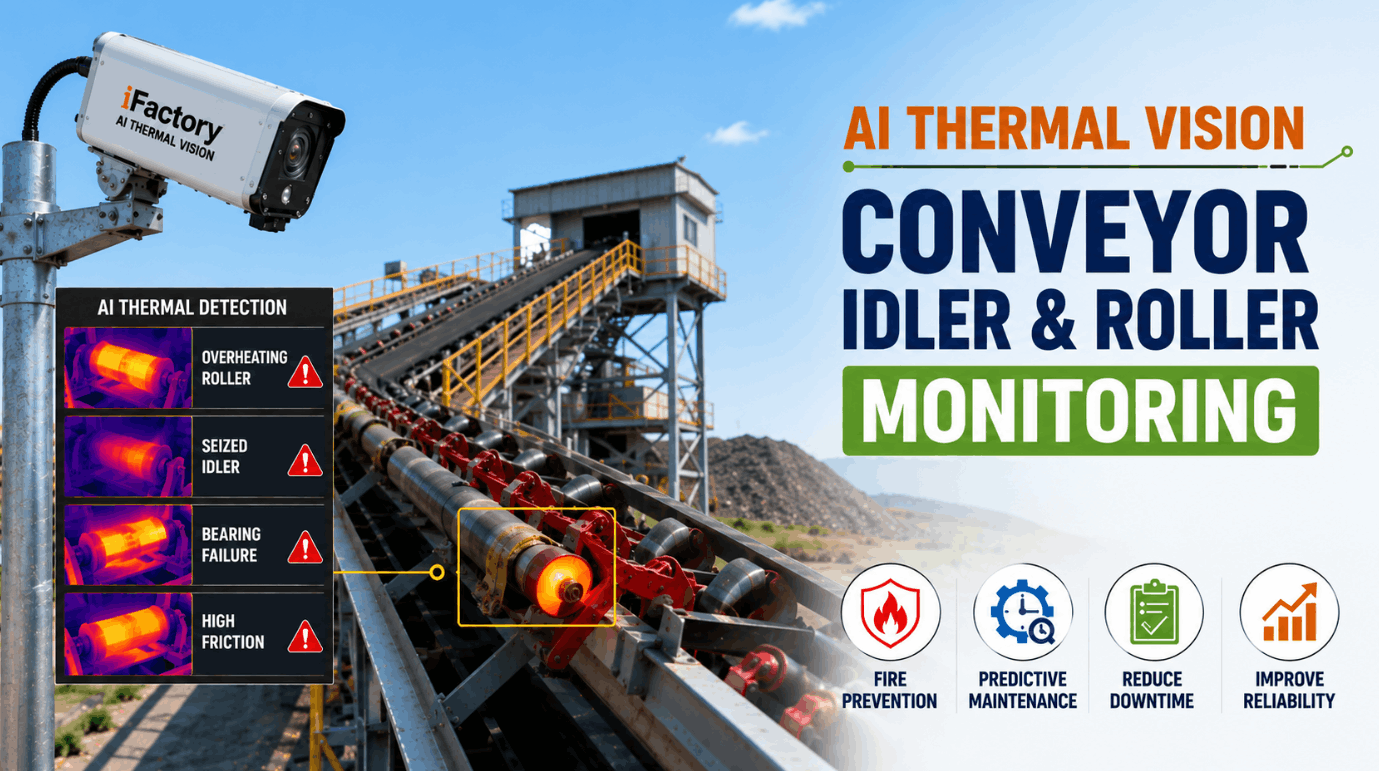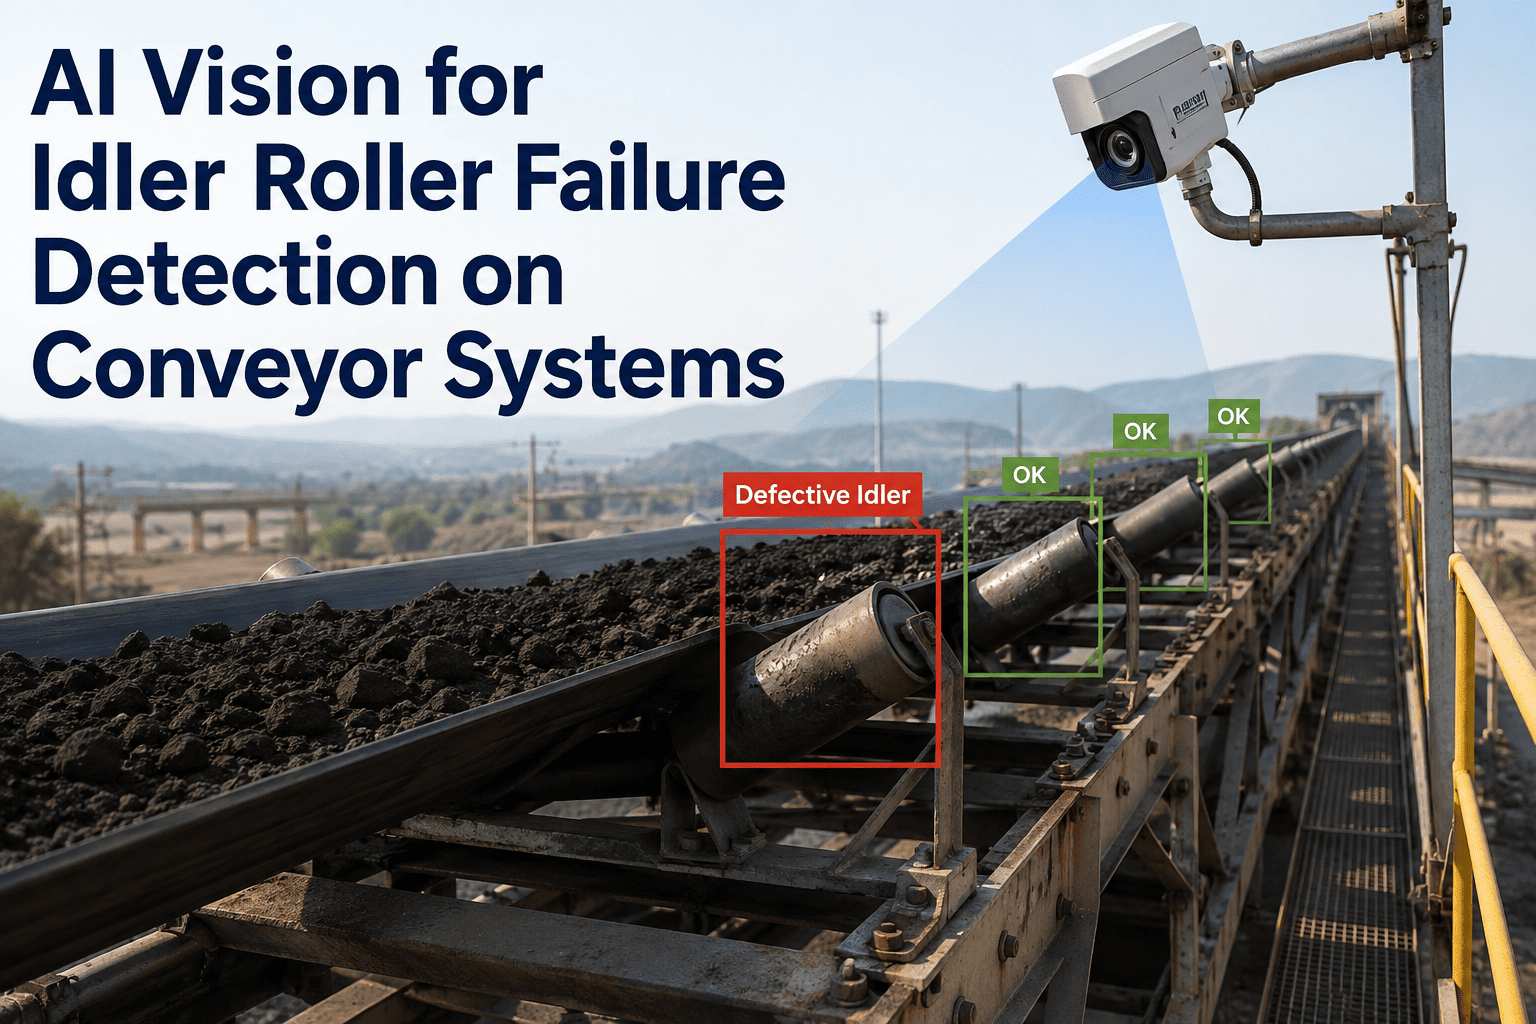
A single frozen idler roller can shred a conveyor belt in under a shift, turning a two-dollar bearing failure into a six-figure belt replacement and days of lost throughput. Most plants still rely on a technician walking the line with a grease gun and a flashlight, checking a fraction of the thousands of rollers in a typical bulk material system on a schedule that has nothing to do with which rollers are actually failing. AI vision cameras mounted along the conveyor watch every roller, every shift, and flag frozen, worn, or missing rollers long before they touch the belt, and our conveyor monitoring specialists can walk you through what that coverage would look like on your line.
Every Idler Roller, Watched Every Shift
Conveyor systems can run thousands of idler rollers across a single line, and a manual inspection schedule can only ever sample a small percentage of them on any given walk. AI vision closes that gap by continuously watching roller condition across the full length of the belt, catching frozen bearings and worn shells while they are still cheap to fix.
Why Idler Failures Go Undetected Until It's Too Late
A conveyor idler roller fails slowly and then all at once. Grease breaks down, the bearing starts running dry, friction builds heat, and the roller eventually seizes. A seized roller stops rotating entirely, and the belt keeps dragging across the stationary shell at full line speed, generating a flat spot on the roller and, within minutes to hours depending on belt speed and tension, cutting into the belt cover itself. By the time a technician on a walking inspection reaches that section of the line, the damage is frequently already done, because the failure window between "starting to seize" and "actively cutting the belt" can be shorter than the gap between scheduled walks.
The Four Roller Conditions AI Vision Is Trained to Catch
Rather than looking for a single failure signature, an AI vision model trained on conveyor roller imagery learns to distinguish between several distinct failure modes, each of which shows up differently on camera and carries a different urgency level for maintenance response.
Manual Walk-Downs Versus Continuous Vision Coverage
| Factor | Manual Walk-Down Inspection | AI Vision Monitoring |
|---|---|---|
| Coverage per inspection cycle | A sampled subset of rollers along the accessible walkway | Every roller within camera range, every pass of the belt |
| Inspection frequency | Typically once per shift or once per day depending on staffing | Continuous, with flagged conditions surfaced in near real time |
| Detection of early-stage wear | Depends on the inspector noticing subtle wobble or noise | Trained to flag early wear patterns before audible or visible signs appear to a person |
| Record keeping | Paper checklist or a spreadsheet updated after the walk | Time-stamped image record tied to a specific roller location |
| Access to elevated or confined sections | Limited by walkway access and confined space entry rules | Fixed or rail-mounted cameras cover sections without requiring physical entry |
How the Detection Pipeline Actually Works
The location reference is what makes this useful in practice. A generic "vibration is elevated somewhere on conveyor 4" alert still requires a technician to walk the full length of the belt looking for the source. A flagged roller with a specific tower or frame number sends that same technician directly to the part that needs attention, cutting the time between detection and repair considerably.
What a Cut Belt Actually Costs
Where Idler Failures Concentrate on a Typical Route
Idler failures are rarely spread evenly across a conveyor route. Certain zones consistently see a disproportionate share of roller replacements, and understanding why helps explain what a monitoring rollout should prioritize first rather than treating every meter of belt as equally at risk. Loading points, where material impact is heaviest, tend to accelerate wear on the impact idlers positioned directly beneath the transfer chute. Curves and inclines put uneven load on rollers along one side of the belt, since belt tension and tracking shift the contact force distribution across that stretch. Return-side rollers, often overlooked because they carry the empty belt rather than the loaded one, still accumulate dust and material fines that work their way into bearing seals over time, and because return-side idlers are typically less accessible than carry-side rollers, they are also the ones most likely to be skipped or rushed during a manual walk-down.
Building an Inspection Priority Map From Historical Data
Most plants already have a rough sense of which sections of a conveyor route fail more often, usually held informally in the heads of the maintenance technicians who have walked that route for years rather than documented anywhere systematically. A useful first step in planning a monitoring rollout is turning that informal knowledge into an actual priority map, cross-referencing roller replacement records against route location to confirm which zones truly carry the highest failure rate versus which zones simply feel that way because they are the ones a particular technician happens to remember most vividly. This matters because camera placement and monitoring investment are most valuable when concentrated on the sections of a route that have genuinely earned a reputation for frequent failures, rather than spread thin and evenly across a route where most of the length rarely produces a failure at all.
Once a priority map exists, it also becomes a useful tool for justifying a phased rollout to plant leadership, since it reframes the investment conversation away from "monitor everything" and toward "monitor the roughly twenty percent of the route responsible for most of the historical failures first." That framing tends to make budget approval considerably more straightforward, because it ties the investment directly to a documented pain point rather than a general improvement initiative.
Integrating Detection Alerts Into Existing Maintenance Systems
A flagged roller is only useful if it actually reaches the technician who can act on it, which means the integration between the vision system and whatever maintenance management system a plant already uses matters as much as the detection accuracy itself. Most rollouts route flagged conditions directly into an existing work order system, tagged with the specific tower or frame location, roller condition, and a severity level that lets planners decide whether a given roller needs attention within the current shift or can wait for the next scheduled preventive maintenance round. This avoids creating a second, parallel alert stream that technicians have to check separately from the system they already use every day, which is one of the more common reasons standalone monitoring tools fail to get adopted even when the underlying detection technology works well.
Frequently Asked Questions
See Every Idler, On Every Shift
Share your conveyor route length and current roller replacement history. We'll show you what continuous vision coverage would have caught on your last few belt incidents.