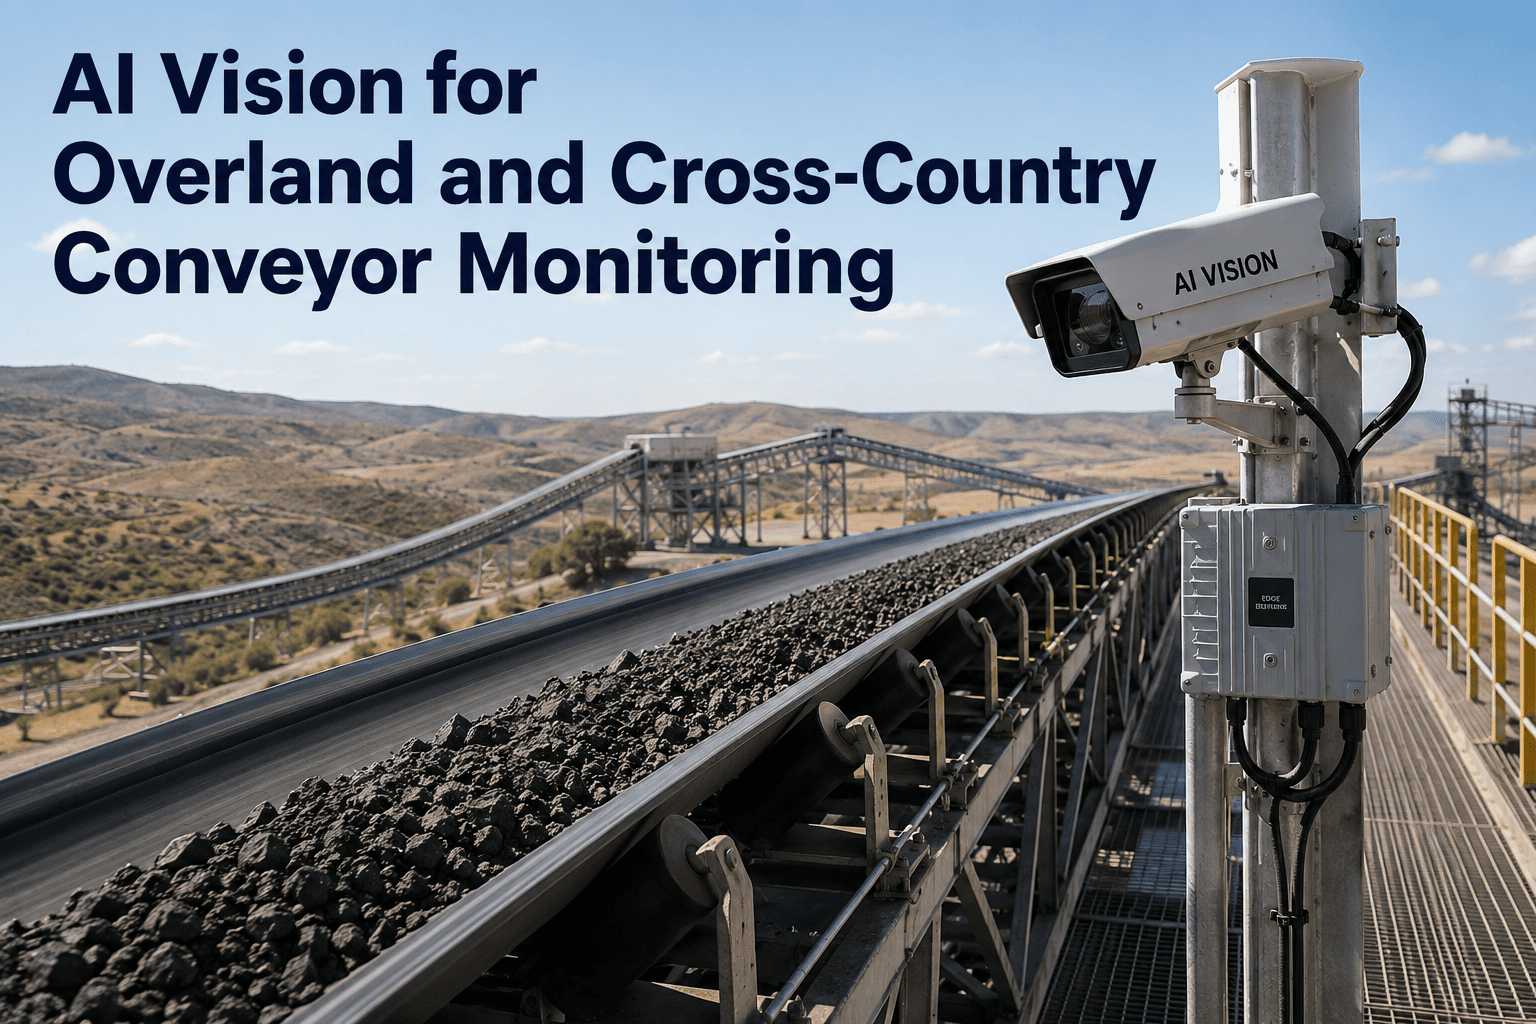
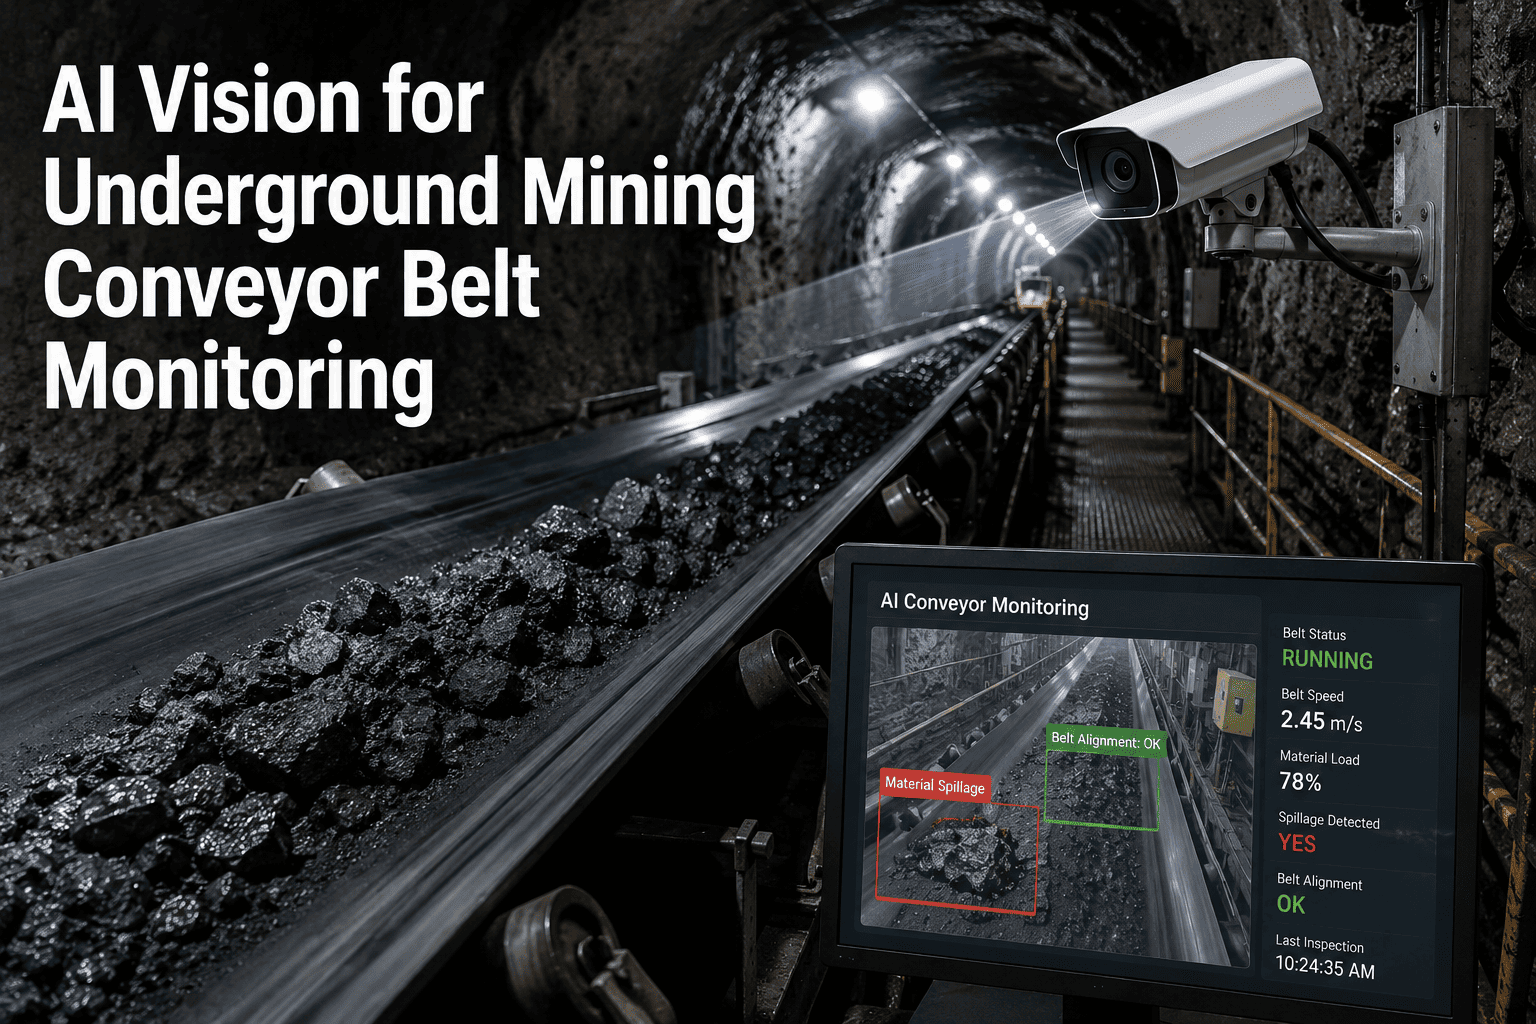
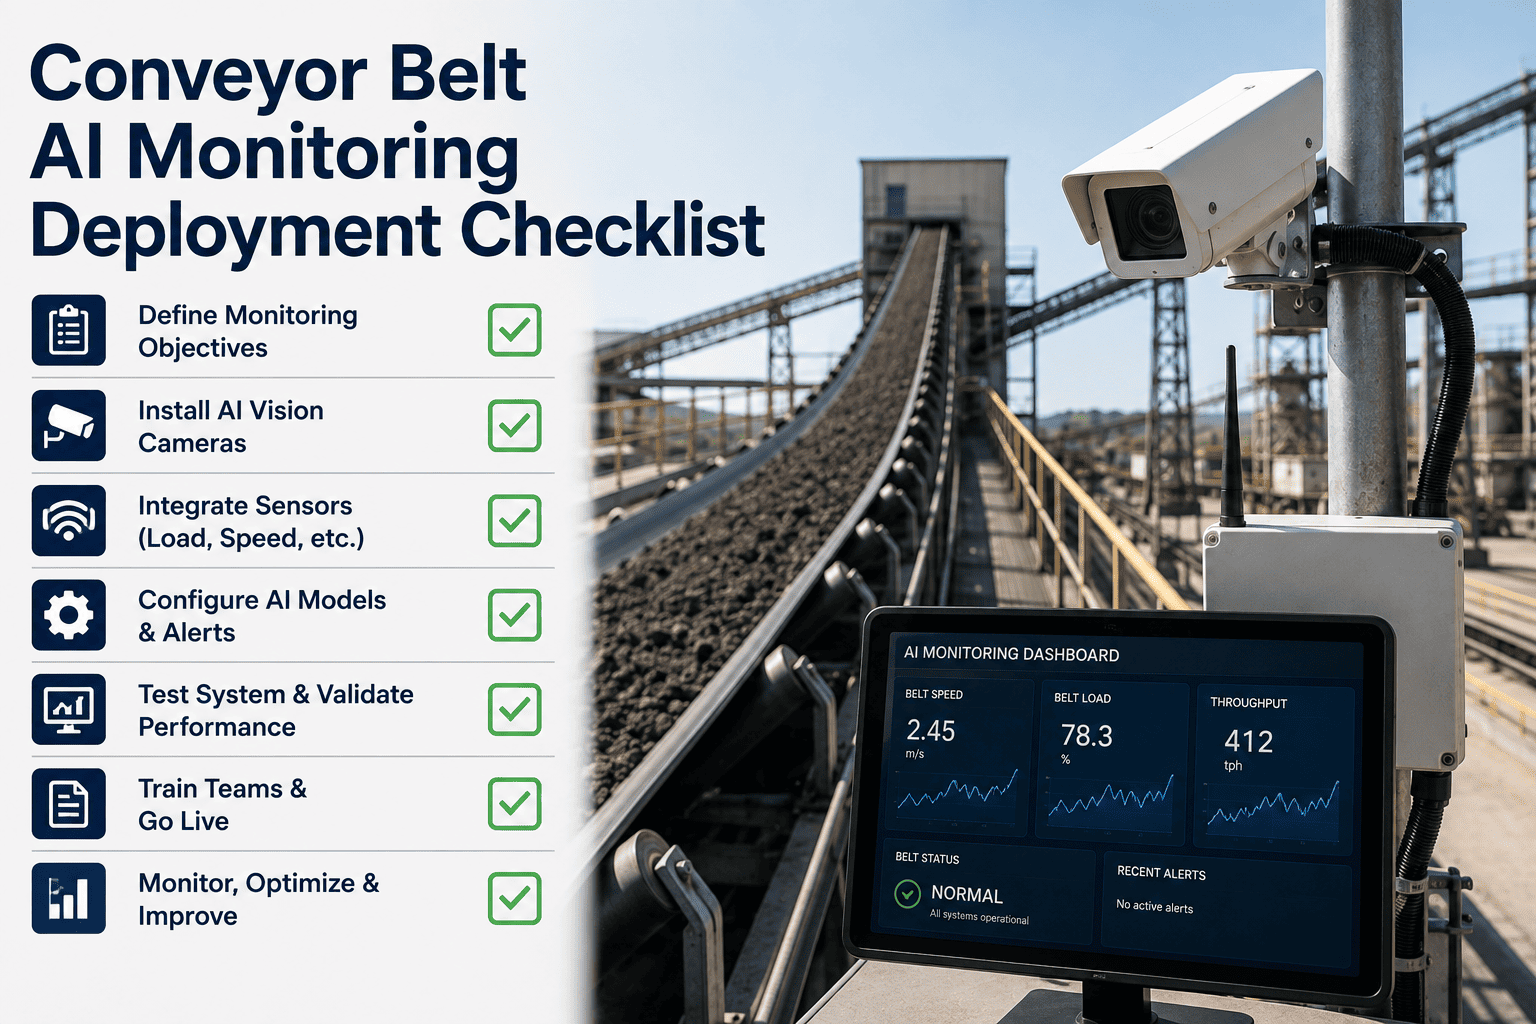
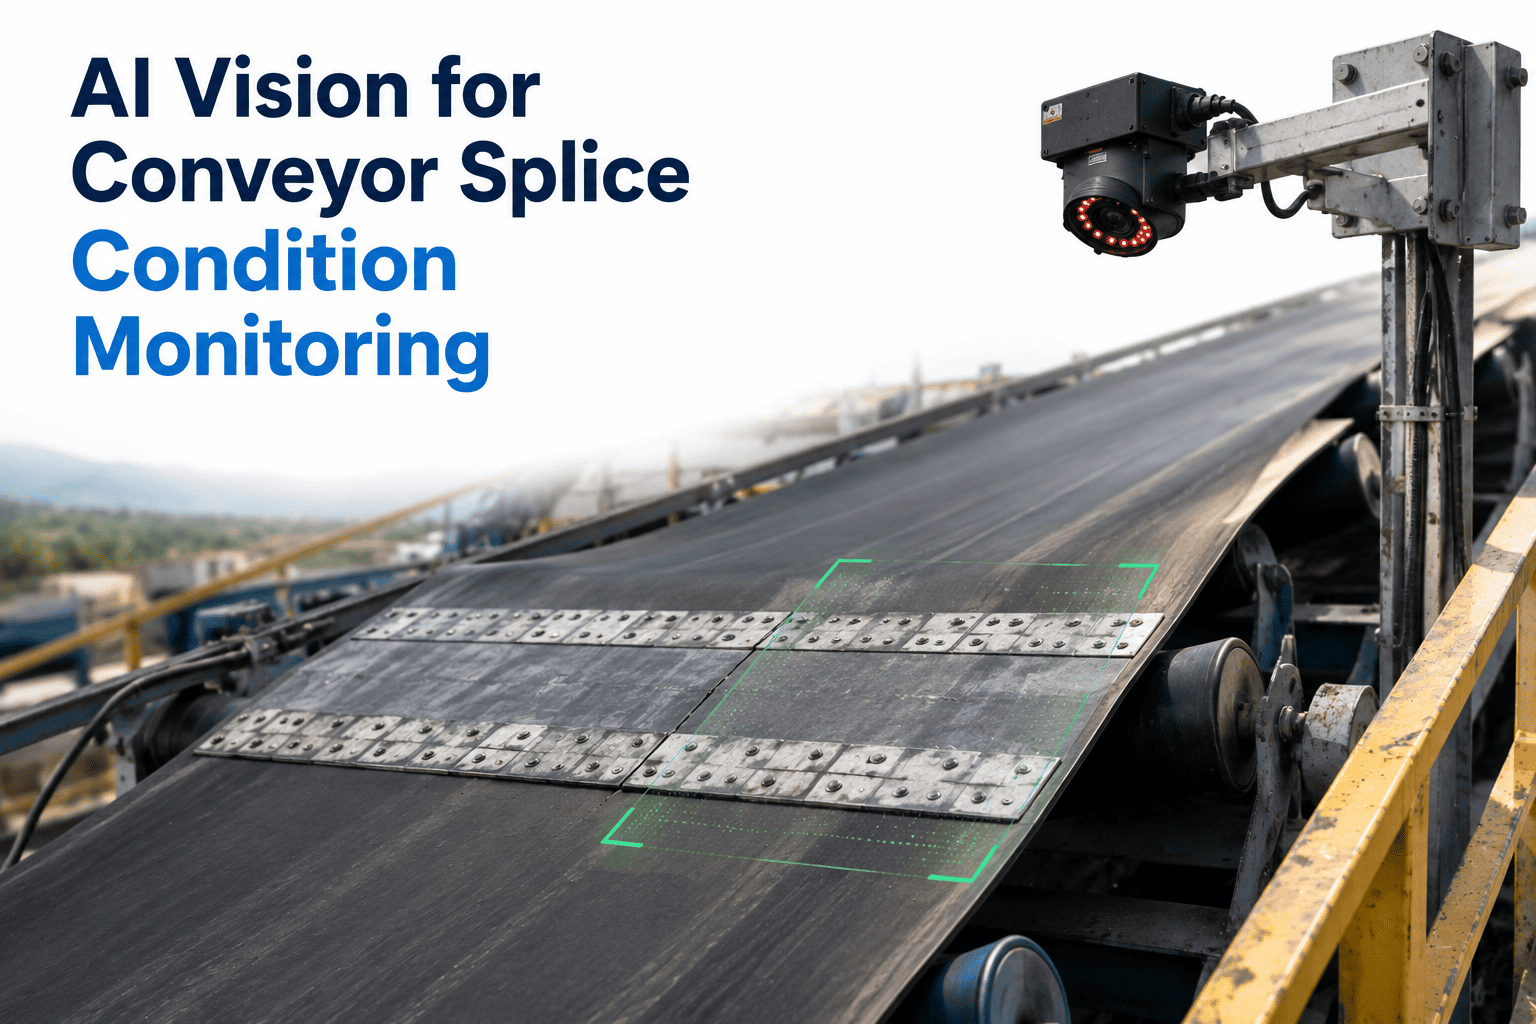
A 20-kilometre overland conveyor at an iron-ore export terminal in the Pilbara moves 8,000 tonnes an hour on a belt that costs upward of A$2 million to replace and takes six weeks of scheduled downtime to swap. A single longitudinal rip caught early gets patched in a shift; the same rip discovered after the belt has run through a return pulley destroys the belt, the underlying frame, and roughly A$15 million of quarterly export revenue while the section is rebuilt. Between the head-end drive and the discharge stacker, that same conveyor might have three thousand idler rollers, forty transfer chutes, and hundreds of pulleys — most of them sitting in the desert, kilometres from the nearest access road, invisible to any inspector who isn't standing directly next to them. Overland and cross-country conveyors run at the outer edge of what human inspection can realistically cover, and the operators building 24/7 belt visibility at that scale work with iFactory's remote conveyor monitoring engineering team to design solar-powered, cellular-connected AI camera nodes for the specific route length, environment, and failure exposure.
Overland Conveyor · Remote AI Monitoring
AI Vision for Overland and Cross-Country Conveyor Monitoring
Cross-country conveyors span kilometres of terrain no walk-down inspector can realistically cover. Solar-powered AI vision nodes at critical points along the route watch every belt metre continuously — detecting rips, edge damage, misalignment, carryback, idler failure, and material spillage. Cellular telemetry delivers alerts to the control room within seconds of detection, replacing the "hope the next scheduled inspection catches it" cadence that overland belt operators have historically been forced to accept.
Route-Wide Node Coverage · What Sits Where
N1
Head-End Drive Station
Drive load · pulley condition · motor current baseline
N2
Transfer Tower Chutes
Chute wear · material buildup · plugging risk
N3
Mid-Route Idler Zones
Idler stall · roller misalignment · belt tracking
N4
Return-Side Belt Path
Longitudinal rips · edge fray · carryback buildup
N5
Discharge / Stacker End
Material spillage · pulley wear · dust plume patterns
The Kilometre Problem
Why Overland Belt Inspection Breaks Down At Cross-Country Scale
A 500-metre in-plant conveyor can be inspected by a technician on a walk-down cadence that keeps every metre in sight several times per shift. A 20-kilometre cross-country belt cannot. The route crosses roads, rivers, and terrain that access vehicles struggle to reach. Sections run at heights inspectors cannot climb without a lift. Weather closes down large windows of the route for days at a time. The result is that most overland conveyors operate with real inspection cadences measured in weeks, not shifts — and the failures that develop between inspections are exactly the failures that cause catastrophic loss.
Coverage Reality · 20 km Cross-Country Belt
Kilometre markers along the belt route · Every metre in between is invisible to walk-down inspection without a physical presence there
20 km
Typical overland route length
3,000+
Idler rollers along the route
45°C+
Ambient in remote climates
Weeks
Real inspection cadence per point
Failure Mode Atlas
Six Overland Conveyor Failures AI Vision Catches Before They Become Catastrophic
Overland belt failures aren't rare events — they're a set of well-understood failure modes that develop progressively when unobserved. Each has a distinct visual signature that appears well before the terminal failure, and each escalates in cost dramatically once the belt or structure is damaged. The atlas below is what iFactory's vision models watch for at every camera node along the route.
Catastrophic
Longitudinal Belt Rip
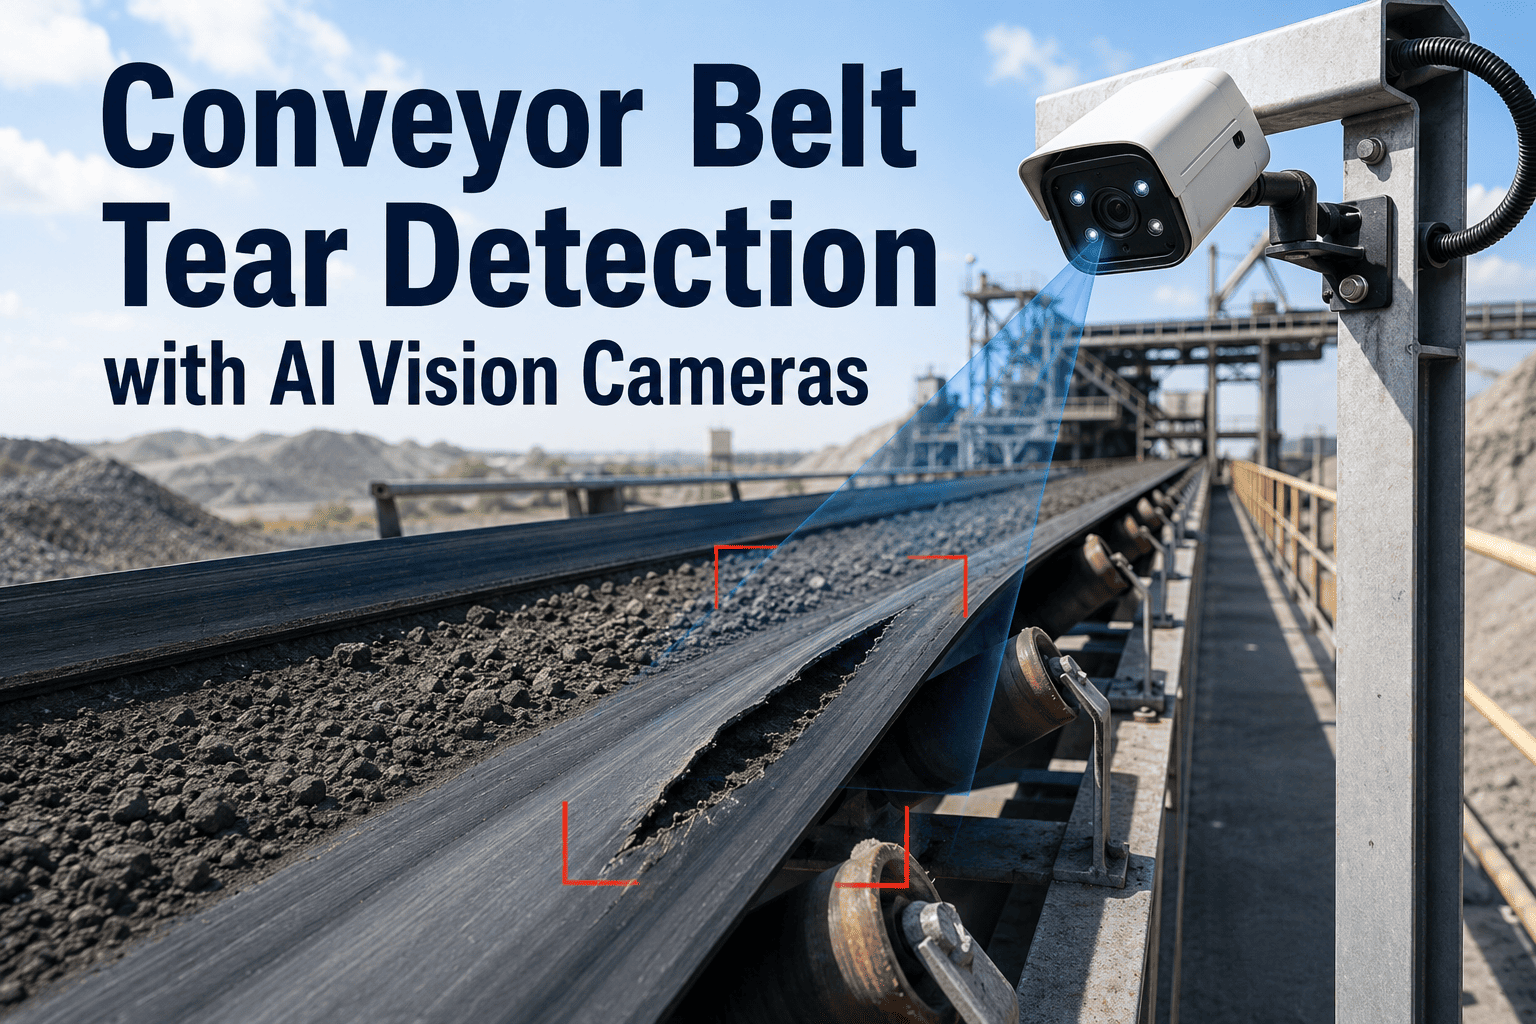
Visible signature: Linear tear along the belt travel direction, often starting at an impact point or entrapped tramp metal, extending metres per revolution once initiated.
Escalation cost: From patch-and-continue (hours of touch time) to full belt replacement plus frame damage (weeks of downtime, millions in lost throughput).
Catastrophic
Belt Fire From Overheated Idler
Visible signature: Localised thermal signature at a stalled or seized idler, smoke plume from friction heating, potential ignition of accumulated carryback and dust.
Escalation cost: From idler swap (a shift) to full route stop and environmental incident with regulatory reporting exposure.
Major
Belt Misalignment And Tracking Drift
Visible signature: Belt edge running progressively closer to the structure frame, contact with frame members visible on camera, edge fray developing over time.
Escalation cost: From training-idler adjustment (minutes) to edge damage requiring belt splice or full replacement.
Major
Idler Roller Seizure And Failure
Visible signature: Roller not rotating with belt travel, sliding contact producing wear flat, thermal signature and dust plume at the seized point.
Escalation cost: From single roller swap to belt burn-through and localised structure damage.
Moderate
Carryback And Material Spillage
Visible signature: Material adhering to belt past discharge point, buildup on return-side structure, accumulating spillage below transfer chutes.
Escalation cost: From cleaner adjustment to housekeeping shutdown and safety-related fire risk from accumulated combustible material.
Moderate
Chute Blockage And Plugging
Visible signature: Material stacking above transfer chute inlet, belt overload downstream, unusual dust patterns indicating restricted flow.
Escalation cost: From manual chute clearing to belt overload trip and downstream throughput loss until cleared.
Solar-Cellular Node Anatomy
What Sits At Each Camera Point — Autonomous Vision Without Grid Or Fibre
The engineering challenge of overland monitoring isn't the AI — it's placing camera hardware at points along a route that has no grid power, no fibre network, and no reliable access for maintenance visits. iFactory's remote monitoring nodes are engineered specifically for that environment: solar-powered, battery-buffered, cellular-connected, edge-inference capable, and designed to run untouched for years in the conditions where they're installed.
01
Solar Panel Array
Sized for the local irradiance and the specific node duty cycle. Panels typically over-sized to cover monsoon or overcast weeks without draining the battery reserve below safe recharge threshold.
02
Battery Reserve
Deep-cycle battery pack sized for 7–14 days autonomy on no solar input. Sealed and thermally managed for the site's ambient extremes — from Pilbara heat to Canadian winter cold.
03
Hardened Camera Head
IP66/IP67-rated enclosure with dust and moisture ingress protection. Optical wiper or air-knife on lens for dusty environments. Field of view tuned to the belt geometry at the node.
04
Edge Inference Unit
NVIDIA Jetson-class edge processor running the vision models on-device. Only classification results and alert imagery are transmitted — full video stays local, dramatically reducing cellular data load.
05
Cellular Modem (4G / 5G / Satellite)
Primary link over public LTE or private site network. Satellite failover for sites beyond cellular reach. Transmission scheduling optimised for alerts first, telemetry second, imagery on demand.
06
Site Mount Structure
Pole or gantry mount engineered for the local wind loading and seismic conditions. Positioned to give the camera the required field of view of the belt while remaining serviceable when access is possible.
Real Route · Real Detection · Real Time
Watch A Longitudinal Rip Get Caught At Kilometre 12 And Alert The Control Room Before It Reaches The Return Pulley
Book a walkthrough with iFactory's remote conveyor engineering team. See rip detection, misalignment tracking, and idler thermal-signature classification running on real overland footage — with cellular alerting, satellite failover, and CMMS work order routing. 30 minutes, your specific route length, real deployment architecture.
The Rip Escalation Timeline
What Happens Between Second Zero And The Point The Belt Is Destroyed
Every experienced belt manager has walked into a control room to find the same story: a small tear that started at 2:47 AM at kilometre 14 has by 5:15 AM become a full-belt-width rip, half a kilometre of destroyed carcass, and a projected six-week rebuild. The escalation timeline below is the anatomy of that story — and the point at which each response option closes.
T + 0 min
Small tear initiates at impact point. Length: a few centimetres. Belt continues to run normally.
AI vision detection window open · Rip classifier flags the anomaly · Alert sent to control room
T + 15 min
Tear has propagated with belt revolutions to roughly one metre in length. Still patchable in place.
Response option: Controlled stop · patch and resume · shift-level downtime
T + 60 min
Tear has passed through a return pulley. Belt carcass damage now spans multiple metres. Local splice required.
Response option: Emergency stop · vulcanised splice on site · full-shift-plus downtime
T + 3 hours
Damage now spans hundreds of metres. Frame contact evident. Full belt replacement discussion opens.
Response option: Extended shutdown · section rebuild · multi-day downtime
T + 6 hours
Belt destroyed. Underlying structure damage confirmed. Route offline until rebuild complete.
Response reality: Full rebuild · weeks of downtime · millions in lost throughput
The value of continuous vision is not that it prevents defects — belts still develop tears from tramp metal and impact events. The value is that it collapses the detection window from "next scheduled walk-down" to "seconds after initiation." Every response option on the left side of the timeline stays available; every option on the right side gets closed by the same detection latency that overland routes historically couldn't achieve.
Sample Walk-Down vs Continuous AI Monitoring
Where The Coverage Gap Sits On A Cross-Country Route
Overland conveyor monitoring has historically been a compromise between what walk-down inspection can physically deliver and what continuous supervision would require. Continuous AI vision at critical route points closes that gap without requiring people to be stationed along the route. The comparison below is where the two approaches differ on the metrics that matter to belt reliability.
| Dimension |
Scheduled Walk-Down Inspection |
AI Vision Continuous Monitoring |
| Inspection Cadence Per Point |
Weekly at best · often monthly on remote sections |
Continuous · every frame classified |
| Coverage Between Points |
Zero visibility between walk-down cycles |
No blind windows at monitored points |
| Rip Detection Latency |
Hours to days after initiation |
Seconds after initiation |
| Idler Failure Warning |
Post-failure, from acoustic or thermal aftermath |
Pre-failure via vibration signature and thermal cue |
| Weather-Access Dependency |
Route closed to inspectors in storms and heat waves |
Nodes run through any weather condition |
| Personnel Safety Exposure |
Walk-down under moving belt · fall and pinch risk |
Zero personnel exposure to route hazards |
| Historical Failure Record |
Inspector notes reconstructed after event |
Continuous imagery archive with timeline |
| Scalability With Route Length |
Linear people scaling · impractical past a few km |
Node scaling · marginal cost drops with route length |
Environment Hardening
Six Environmental Realities Remote Conveyor Nodes Are Built To Survive
Overland conveyors don't run in the environments where consumer-grade cameras were designed to operate. Nodes have to survive years of exposure with minimal maintenance access. Every hardware and software choice in the deployment engineering is made against the specific site conditions — the six categories below are the realities iFactory's hardware selection and firmware tuning are built against.
E1
Ambient Temperature Extremes
45°C+ sustained in the Pilbara, Bowen Basin, and Middle East mining regions. Sub-zero winters at Canadian and northern European sites. Enclosures and battery chemistry chosen against the local range.
E2
Abrasive Dust And Airborne Particulates
Iron ore, coal, cement, and aggregate dust coat lenses and enclosures within days. Air-knife lens cleaning, IP66/IP67 sealing, and dust-shedding mount geometry keep the optics operational without site visits.
E3
Cyclonic Rain And Wind Events
Mount structures engineered for the local wind loading standard. Enclosure ingress tested to weather-event tolerance. Nodes ride out the storm rather than being retrieved for it.
E4
Cellular Coverage Variability
Public LTE is patchy across remote sites; private site networks are stable but limited in coverage. Multi-carrier modem and satellite failover keep the alert channel live even when the primary link drops.
E5
Solar Irradiance And Seasonal Variance
Panels oversized against the site's worst irradiance week, not its average. Battery reserve buffers the deficit through monsoon or high-latitude winter without dropping the alert channel.
E6
Physical Access Difficulty
Once installed, the node may not be reached again for a year or more. Firmware updates, model updates, and diagnostics all delivered over the cellular link. Site visits reserved for hardware failure.
Where Overland Vision Deploys First
Four Industries Where Cross-Country Conveyor Monitoring Pays Back Fastest
Not every long-conveyor operation carries the same failure exposure. The economics of continuous AI monitoring concentrate in industries where the belt is a single point of failure for a high-value throughput stream — the four scenarios below are where iFactory's remote monitoring programme most commonly starts.
01
Iron Ore And Coal Export Terminals
Mine-to-port overland conveyors carrying thousands of tonnes per hour on multi-kilometre routes. A belt-down event stops export loading and cascades into demurrage charges on waiting bulk carriers within hours. The single highest-value deployment target for overland monitoring.
02
Cement, Aggregate, And Limestone Quarries
Cross-country conveyors from pit to processing plant or from crusher to stockpile. Long routes across active quarry terrain with dust and impact exposure. Belt damage from tramp material is the dominant failure mode and AI rip detection is the primary payback driver.
03
Power Generation Fuel Supply Belts
Coal and biomass fuel conveyors from stockpile to boiler house. Belt-down events threaten generation capacity and grid commitment. Fire risk from carryback and idler overheating is the additional exposure vector that vision monitoring specifically addresses.
04
Port And Bulk Handling Terminals
Ship-to-shore, shore-to-stockpile, and stockpile-to-berth conveyors covering large terminal footprints. High utilisation, high dust load, and salt-air corrosion make maintenance windows shorter and failure exposure higher than inland operations.
Where The Numbers Move
Six Categories Where Continuous Belt Vision Shows Up On The Reliability P&L
Overland conveyor monitoring produces measurable improvement across a set of reliability and cost categories that compound. The six categories below are the payback pattern iFactory's engineering team consistently observes across mining, aggregate, and power deployments — sorted by how visibly the metric moves in the first year.
01
Unplanned Belt-Down Event Frequency
The primary reliability metric. Continuous rip and misalignment detection catches escalating failures before they force emergency stops. Predictive maintenance data indicates belt-down events can be reduced by up to 70% under mature monitoring programmes.
02
Belt Replacement Cycle Extension
Early detection of edge damage and misalignment lets operators correct root causes before belt life is compromised. Reported belt life extensions of up to 50% under continuous monitoring compared to reactive maintenance regimes.
03
Catastrophic Failure Avoidance
The tail-risk category. A single prevented full-belt-replacement event or belt fire pays back the monitoring investment across the entire fleet. This is the exposure most operators most want to eliminate, and the exposure that vision addresses most directly.
04
Inspection Labour Reallocation
Walk-down inspection labour is safety-exposed and skills-constrained. Continuous monitoring reallocates that labour from routine cadence walks to targeted response on flagged anomalies — better use of scarce reliability engineering time.
05
Personnel Safety Exposure Reduction
Walk-down inspection under moving belts carries pinch, entanglement, and fall exposure. Every walk-down cycle replaced by remote camera observation is a safety exposure removed from the reliability team's routine work.
06
CMMS And Predictive Maintenance Data
Continuous vision data becomes the source signal for predictive work order generation. Belt wear patterns, idler trend data, and carryback accumulation feed maintenance planning with lead-time visibility that historical inspection cadences could never provide.
Field Perspective
"
The way I frame overland monitoring with mining reliability leaders is that the whole industry has been asked for decades to accept a false trade-off between coverage and cost. You could either put people on the route with all the safety exposure and cadence limits that implies, or you could accept that huge portions of the belt would go unobserved between inspections. Neither answer was actually good, but there wasn't a third option. Solar-powered, cellular-connected AI vision is the third option, and it's mature enough now to be the default rather than the experiment. The other thing I emphasise is that the ROI arithmetic on overland conveyors doesn't look like a manufacturing plant's. On a 20-kilometre iron ore belt moving 8,000 tonnes an hour, a single prevented full-belt-replacement event pays back the entire monitoring programme across the fleet, several times over. The cost curve is completely dominated by tail-risk avoidance, and once you understand that you stop trying to justify vision monitoring on the routine efficiencies and start justifying it on the catastrophic failures it takes off the table. And the last point I always make is that the safety case matters as much as the reliability case. Every walk-down cycle you replace with a camera view is a shift-worth of pinch-and-entanglement exposure that your reliability team never has to take again. That's the part that resonates in the safety review, even before the financial case comes up.
Marika Chen-Oduya
Overland Conveyor Reliability Director · 18 years across iron ore export terminals, coal power fuel supply, and cement quarry conveyor reliability, with deployment experience across Australian, African, and Latin American remote sites
Frequently Asked Questions
What Reliability And Operations Leaders Ask Before Deployment
How many camera nodes does a typical overland conveyor route require?
Node density is driven by failure exposure geometry, not route kilometres alone. Critical points — head-end drives, transfer chutes, return pulleys, and known impact zones — carry higher node density because that's where the failures concentrate. Long straight sections between transfer points typically carry lighter node density with wider camera fields of view. A representative 20-kilometre route might carry between 15 and 30 nodes total, weighted toward the transfer towers and drive stations. The deployment engineering phase maps node positions against your specific route's historical failure hotspots and structural geometry.
Talk to remote monitoring engineering for a route-specific coverage plan.
What happens when cellular coverage drops or the node loses satellite link?
Every node stores classification results, alert data, and reference imagery locally on the edge inference unit. When cellular or satellite link is lost, the node continues classifying and buffering data. When the link comes back, buffered alerts and telemetry are transmitted in priority order — critical alerts first, telemetry second, imagery on demand. Multi-carrier modems and satellite failover reduce the frequency and duration of full outages, but the local buffer ensures that no detection event is lost even during extended communication gaps. The system is engineered for the reality that remote sites have imperfect connectivity, not the assumption that they have plant-quality networks.
Can the platform integrate with our existing SCADA, CMMS, and control room dashboards?
Yes, and that integration is where the operational value concentrates. Standard REST APIs and industrial protocols (OPC-UA, MQTT, EtherNet/IP) handle telemetry ingestion into SCADA. CMMS integration generates automated work orders when defect severity crosses configured thresholds — the reliability team sees a work order in their existing queue rather than having to monitor a separate dashboard. Control room dashboards can be embedded as web views or push notifications into the existing operator interface. Integration is completed during deployment engineering and doesn't require replacement of existing SCADA or CMMS infrastructure.
Book a demo to walk through the integration architecture for your control room and CMMS landscape.
How do the nodes handle dust and lens contamination on cement or coal routes?
Lens contamination is the single most common cause of vision system degradation on dusty routes, and the deployment engineering explicitly addresses it. Camera enclosures use IP66/IP67 sealing to prevent dust ingress. Lens keep-clean systems — air-knife, optical wiper, or hydrophobic coating depending on the site — remove buildup between operational windows. Mount geometry is chosen to shed dust rather than accumulate it. Firmware includes lens degradation detection that flags nodes where imagery quality is dropping, so a site visit can be scheduled before classification accuracy is impacted rather than after. On mature deployments, lens maintenance visits are scheduled at quarterly-to-annual cadence rather than reactively.
What does deployment look like from purchase order to full route coverage?
Standard deployment for a full overland route runs 6–12 weeks depending on route length and node count. Weeks 1–3 cover route survey, node placement engineering, and hardware pre-configuration against the site's power and connectivity conditions. Weeks 4–8 cover physical installation, cellular commissioning, SCADA and CMMS integration, and model calibration against the site's initial imagery. Weeks 9–12 cover go-live tuning, operator training, and first defect-detection cycles. Post go-live, 24×7 remote monitoring maintains model accuracy as conditions evolve — seasonal changes, material variations, wear pattern shifts — without requiring your reliability team to manage the model lifecycle in-house.
Talk to the engineering team about a phased pilot on the highest-exposure section of your route before scaling to the full length.
Turn Every Kilometre Of Belt Into A Continuously Observed Asset
Deploy Solar-Powered AI Vision Along Your Overland Route And Retire The "Wait For The Next Walk-Down" Cadence
iFactory's remote conveyor monitoring platform is engineered for the specific realities of overland and cross-country belts — multi-kilometre routes, remote environments, weather and access constraints, and the tail-risk exposure that defines belt reliability at scale. Solar-powered nodes, cellular telemetry, edge inference, satellite failover, and CMMS-integrated alerting come together into a single monitoring layer that turns route-wide belt observation from an aspiration into a per-kilometre live record.