AI Vision for Pharmaceutical Tablet Press Monitoring and Control

By Johnson on August 8, 2026

ai-vision-pharmaceutical-tablet-press-monitoring-control

A tablet press running at 300,000 tablets per hour is a difficult place to catch a problem early — by the time an in-process quality check pulls a sample tray, tens of thousands of tablets have already been compressed under the same conditions, and if a punch has started chipping or a die is running with degraded lubrication, that entire window is at risk of ending up in a batch rejection or, worse, in a recall investigation months later. The gap between "something is drifting on the press" and "someone finds out at the sample bench" is the single most expensive delay in solid dose manufacturing, and it is exactly the gap AI vision is built to close by inspecting weight uniformity, surface quality, and ejection patterns directly at the tablet press rather than waiting for downstream sampling.

Process Control · Pharmaceutical Tablet Manufacturing

AI Vision That Watches Every Tablet Leaving the Press, Not Every Fiftieth One

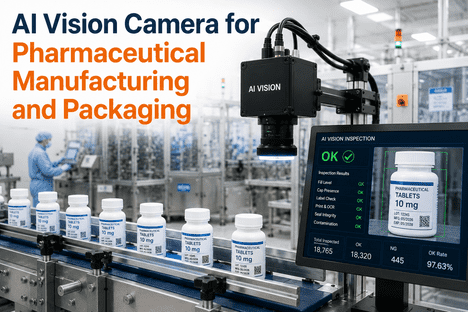
Camera-based inspection at the point of compression detects tablet weight variation, surface defects, and ejection anomalies in real time, so tooling wear and process drift are caught in seconds rather than at the next in-process sampling interval.

The Sampling Gap

Why Every 30-Minute Sampling Interval Hides Thousands of Suspect Tablets

Conventional in-process control on a rotary tablet press relies on pulling a small sample tray every fifteen to thirty minutes, weighing individual tablets against target, checking hardness and thickness on a bench tester, and logging the values against the batch record. This works well enough when the process is stable, but the entire model assumes that whatever conditions produced the sampled tablets are representative of the tablets produced between samples — which is exactly the assumption that breaks down when a punch tip begins to chip, a die wall loses lubrication, or the force feeder starts delivering an uneven fill.

15–30
Minutes between typical sample pulls
Long enough for tens of thousands of tablets to pass through the press under drifting conditions before anyone at the sample bench sees a number that flags concern.
6–12 hrs
Force signature lead time
Rising compression force standard deviation often signals tooling wear or granulation drift hours before visible defects appear on tablets pulled at sampling.
100%
Tablets a vision system inspects
Every tablet ejected from every station on every turret rotation is imaged, weighed by dimensional proxy, and classified — no reliance on statistical sampling to hope defects are caught.
30+
Distinct surface defect categories
Capping, lamination, chipping, sticking, picking, mottling, embossing wear, and coating anomalies each have distinct visual signatures a trained model separates cleanly.
What AI Vision Sees at the Press

Three Data Streams, One Tablet at a Time

Machine vision at the tablet press is not a single measurement — it is three parallel streams of information extracted from each imaged tablet as it exits the die, then correlated with the mechanical force data the press itself already produces. The value comes from combining what the tablet looks like with what the punch felt while making it, so a defect signature can be traced back to the specific station that produced it and the specific tooling condition that likely caused it.

A
Dimensional Uniformity and Weight Proxy
High-resolution imaging measures tablet diameter, thickness, and cross-sectional volume for every tablet leaving the die. Because compressed tablet density is tightly constrained by the granulation and compression force window, a real-time volume measurement functions as a continuous weight proxy — flagging weight drift far more quickly than periodic bench weighing of small samples.
B
Surface Quality and Cosmetic Defects
Deep learning models trained on labeled defect libraries classify each tablet against categories including capping, lamination, chipping, sticking, picking, mottling, coating defects, embossing wear, black spots, and foreign particle adhesion. Because the models learn from examples rather than fixed rules, subtle drift toward defect conditions is caught before the defect is fully formed.
C
Ejection Pattern and Per-Station Attribution
By synchronizing image capture with turret position, every imaged tablet is attributed to the specific punch and die station that produced it. Emerging defect patterns are then tied to individual stations, so a chipping punch on station 27 is identified as station 27's problem — not as a generic batch quality concern requiring the whole tooling set to be inspected.
From Statistical Sampling to Continuous Inspection

Every Tablet Inspected. Every Station Attributed. Every Defect Traceable.

iFactory's AI vision system runs directly at the tablet press, imaging every tablet as it leaves the die, classifying against your product's defect library, and attributing every anomaly to a specific punch station.

Defect Taxonomy

The Compression Defects Vision Catches Before They Reach Coating

Every solid dose product specification defines a set of cosmetic and structural defects that render individual tablets unacceptable. Traditionally these are found by human visual inspection on sampled trays or by downstream deblistering rejection — both of which happen far too late to correct the underlying press condition that caused them. AI vision at the press catches these defects tablet by tablet and, more importantly, catches the trend toward each defect before the failure rate rises enough to threaten batch acceptance.

Defect TypeWhat the Model SeesTypical Root Cause on the Press
Capping Horizontal split near the crown of the tablet Air entrapment, over-compression, insufficient pre-compression, deep concave tooling
Lamination Layered separation visible on tablet edge Excessive fine content, poor granulation, high compression speed reducing dwell time
Chipping Broken edges, missing corner on shaped tablets Worn punch tip, insufficient tablet hardness, harsh discharge chute
Sticking / Picking Surface pull-out, embossing fill, dull face Punch face residue, insufficient lubrication, high moisture in granulation
Mottling Uneven color distribution across tablet face Poor blend uniformity, colored API migration during drying
Embossing wear Dull or missing detail in logo, score line, letters Punch cup wear from run hours, abrasive formulation
Weight variation Tablet volume outside statistical control limits Force feeder speed drift, fill cam wear, granulation flow change

Weight variation warrants specific attention because it is where AI vision and existing press instrumentation reinforce each other most usefully. The press's own force transducers measure compression force per station cycle, and rising standard deviation in compression force is a well-known early signal of feeding, tooling, or granulation issues. Vision adds the finished-tablet dimensional measurement that closes the loop — force says "something is different at station 27," volume says "the tablet coming out of station 27 is now 3% under target," and the two together isolate whether the cause is upstream fill or downstream tooling.

Weight Uniformity Deep Dive

Where Weight Variation Actually Comes From

Weight variation complaints on a tablet press are almost never caused by the compression stage itself. Compression force is closed-loop controlled on modern presses, so if the die is filled correctly, the tablet weight will land in range. Weight problems are fill problems, and fill problems trace back to a small set of physical causes that vision plus force data can distinguish between much faster than a human troubleshooter working from sampled weights alone.

Cause 1
Force Feeder Speed Drift
A gradually slowing or unevenly loaded force feeder delivers inconsistent powder into the die cavity, showing as tablet weight scatter that rises with press speed. Vision catches it as expanding dimensional distribution across all stations rather than one specific station.
Cause 2
Fill Cam Wear
A worn or misadjusted fill cam changes how deep the lower punch drops during die filling, changing the volumetric fill. This shows as a station-by-station or half-turret weight offset rather than random scatter, and vision's per-station attribution isolates it in minutes.
Cause 3
Granulation Flow Change
Batch-to-batch or within-batch changes in granulation bulk density, particle size, or moisture affect how freely the blend flows into the die. Vision sees this as a persistent shift in tablet volume distribution that appears at batch changeover or after a long run.
Cause 4
Punch Length Variation
Working length variation across a punch set above the tight specification tolerance produces station-specific weight, thickness, and hardness variation. Vision surfaces this pattern immediately by station attribution, before it broadens into a batch rejection risk.
Tooling Wear Detection

How Tooling Wear Reveals Itself in the Data Stream

Punches and dies are the highest-wear components on a rotary tablet press, and their condition drives more downstream quality problems than any other single variable on the machine. Wear does not happen catastrophically — it happens gradually over tens of millions of compression cycles, and each stage of wear leaves its own signature in the ejection force curve, the compression force distribution, and the visual condition of the tablets being produced.

Stage 1
Early Wear — Cup Surface Polishing
Repeated contact with granulation gradually polishes the punch cup surface. Ejection force begins a slow upward trend that is invisible to periodic sampling but visible as a rising baseline in continuous force monitoring, with no tablet-visible defects yet.
Stage 2
Mid Wear — Embossing Detail Loss
Cup detail begins to dull, showing as softening of logos, score lines, and lettering on inspected tablets. Vision catches this well before an operator would flag it at manual inspection, giving planning time before the tooling set has to leave service.
Stage 3
Late Wear — Tip Chipping Risk
Ejection force develops sudden spikes on specific stations, and vision starts flagging edge defects on tablets from those stations. This is the point where planned replacement prevents unplanned stoppages, tablet chipping, and possible cleaning validation events.
Stage 4
Failure — Fracture or Die Wall Damage
If wear signals are ignored, tip fracture or die wall damage causes immediate reject rates on affected stations and forces an unplanned stop. Continuous monitoring exists specifically to keep operations from ever reaching this stage on a routine basis.

The value of catching wear in stage two or early stage three rather than at failure is that planned tooling changes happen during scheduled changeover windows, spare parts are available, cleaning validation is not compressed against production pressure, and the batch that would otherwise be at risk simply continues running. This is a maintenance planning benefit, but it is delivered by quality data — which is exactly why AI vision at the press earns its place across both engineering and quality functions.

From Detection to Response

What Happens Between "Anomaly Detected" and "Operator Alerted"

01
Image Capture at Ejection
High-speed cameras positioned after the die table capture every tablet at ejection under controlled lighting, synchronized to turret position so each frame carries the station identity from which the tablet came.
02
Edge Inference at the Press
A local edge inference server processes each image against the trained defect classification model. Because inference runs on-premise, there is no network dependency and no data leaves the site — a hard requirement for FDA 21 CFR Part 11 environments.
03
Correlation With Force Data
Vision classifications are joined with the press's own compression and ejection force telemetry per station, letting the platform separate tooling-origin signals from formulation-origin signals rather than treating every anomaly the same way.
04
Trend Detection and Alert Escalation
Statistical process control on classified defect rates catches upward trends before threshold breaches. Alerts escalate by station, defect class, and rate of change, so the operator sees a specific actionable pattern — not a generic "quality event" alarm.
05
Batch Record and Audit Trail
Every classification, every alert, every operator response, and every AI model version is written to a tamper-evident batch record. This is the layer that makes the entire system usable under GMP rather than being a shadow monitoring tool alongside the compliant system.
06
Continuous Model Improvement
Confirmed defect classifications feed a controlled retraining pipeline under change control, so the model improves as it sees more of your specific product formats without violating the validation state of the deployed inference version.
Regulatory Alignment

Where AI Vision Fits Under FDA and EU GMP Expectations

Regulatory expectations around solid dose manufacturing have moved decisively toward real-time process monitoring, and the 2023 FDA guidance on continuous manufacturing explicitly references real-time monitoring as a critical control point. Tablet presses sit at the last intervention point before coating, so it is the natural place for continuous inspection to earn compliance credit — provided the inspection system is validated, its records are trustworthy, and its behavior is auditable.

21 CFR Part 11
Electronic records must be attributable, legible, contemporaneous, original, and accurate. Every classification and alert carries a timestamp, operator identity, model version, and immutable record — meeting the ALCOA principles auditors look for.
EU GMP Annex 11
Computerized systems used in GMP must have documented validation status, change control, and periodic review. On-premise deployment plus versioned model management keeps the entire vision pipeline within an inspectable validation state.
ICH Q7 and Q10
Quality risk management under Q7 and pharmaceutical quality systems under Q10 both favor continuous process verification over end-of-batch acceptance. Continuous per-tablet inspection is the strongest possible evidence of continuous process control.
USP General Chapters
Weight uniformity, content uniformity, and cosmetic defect thresholds referenced in USP chapters map cleanly to the vision system's classification categories, so acceptance criteria configured on the press align with pharmacopeial expectations.
Operational Outcomes

What Changes on the Floor After Deployment

The operational impact of moving from statistical sampling to continuous vision inspection at the press shows up in three places that quality, production, and maintenance leaders all track — and it shows up together, because these outcomes reinforce each other rather than trading off against one another. Quality benefits from earlier defect detection, production benefits from fewer unplanned stoppages and less late-batch scrap, and maintenance benefits from condition-based tooling replacement scheduled around actual wear signatures rather than run-hour estimates that always end up being too conservative or too aggressive depending on the product being run.

This kind of cross-functional payoff is difficult to justify on any single team's budget because the value is distributed across three cost centers that historically report separately. The practical answer is that vision at the press earns its keep against the batch rejection line alone on higher-value products, with the tooling life extension and reduced sampling load counting as unpriced additional return rather than as the primary business case. Sites deploying on their first commercial-scale product line typically find the same pattern repeats across subsequent products, so scale-up decisions after the first press become straightforward rather than requiring a fresh justification cycle for each additional installation.

Outcome AreaBefore Continuous VisionAfter Continuous Vision
Batch rejection rate Reactive, driven by end-of-batch sampling results Preventive, driven by early anomaly correction mid-run
Tooling replacement Fixed calendar or run-hour interval Condition-based on ejection force and embossing wear signals
Root cause investigation Retrospective, days after batch closes Live, with per-station attribution during the run
In-process sampling load Frequent manual sampling and bench testing Sampling retained for verification, reduced in volume
Audit evidence Sampled records, sampled photos, operator logs Continuous inspection record across every tablet in every batch
Common Questions

Frequently Asked Questions

Does deploying AI vision at the tablet press require us to replace our existing in-process sampling program?
No — sampling stays in place, but its role shifts from primary detection to periodic verification. The vision system becomes the continuous eyes on the press, catching drift between samples, while manual sampling continues to satisfy the pharmacopeial testing requirements that call specifically for physical bench measurement. Most sites find they can reduce sampling volume once vision confidence is established, but the two are complementary rather than replacements for each other. Talk to support about how the two programs are typically sequenced during validation.
Can the vision system be validated under 21 CFR Part 11 given that it uses an AI model rather than a fixed rule set?
Yes — the deployed inference model is versioned, locked, and treated as validated software once qualified. Model updates go through documented change control just like any other GMP system change, and the audit trail records which model version was in use for every classification decision. This is the standard approach that regulators expect for any AI or machine learning system used in a compliant environment, and it is materially different from allowing an unmanaged model to drift over time.
How does the system handle new tablet products or shape changes without a full re-validation cycle?
Product changeovers are handled through recipe management — each product has its own configured defect library, acceptance thresholds, and imaging parameters selected at changeover. New products go through an onboarding process that includes labeling defect examples from initial runs, but this is a workflow inside the validated system rather than a change to the system itself. The base inference model remains locked; only the product-specific configuration changes, keeping the validation state stable across many products on the same line.
Does per-station attribution work on both single-sided and double-sided rotary presses at full production speed?
Yes — both single-sided and double-sided rotary presses are supported, with camera positioning and timing configured during commissioning to match the press geometry. High-speed cameras handle full production speeds up to and beyond typical commercial rotary press outputs, and the per-station attribution logic uses encoder feedback from the turret so image-to-station mapping stays reliable across long runs. Multi-tip tooling is also supported, with each tip position tracked individually rather than as a single station.
What is a realistic deployment timeline from initial engagement to running the system on a production press?
Typical deployment for a first press on a site follows a phased path — pre-configured AI hardware ships racked and ready, the installation and integration phase covers cabling, camera mounting, network integration, and PLC data tie-in, and validation runs alongside operator training. Most first-press deployments are live in six to twelve weeks from engagement, with subsequent presses on the same site rolling out faster because the integration pattern is already established. Book a demo to walk through the specific timeline against your press models and validation environment.
Continuous Inspection at the Point of Compression

Stop Discovering Batch Problems at the Sample Bench

iFactory brings AI vision directly to the tablet press — every tablet imaged, every station attributed, every anomaly correlated with press force data, and every record written to a validated, audit-ready trail.



Share This Story, Choose Your Platform!