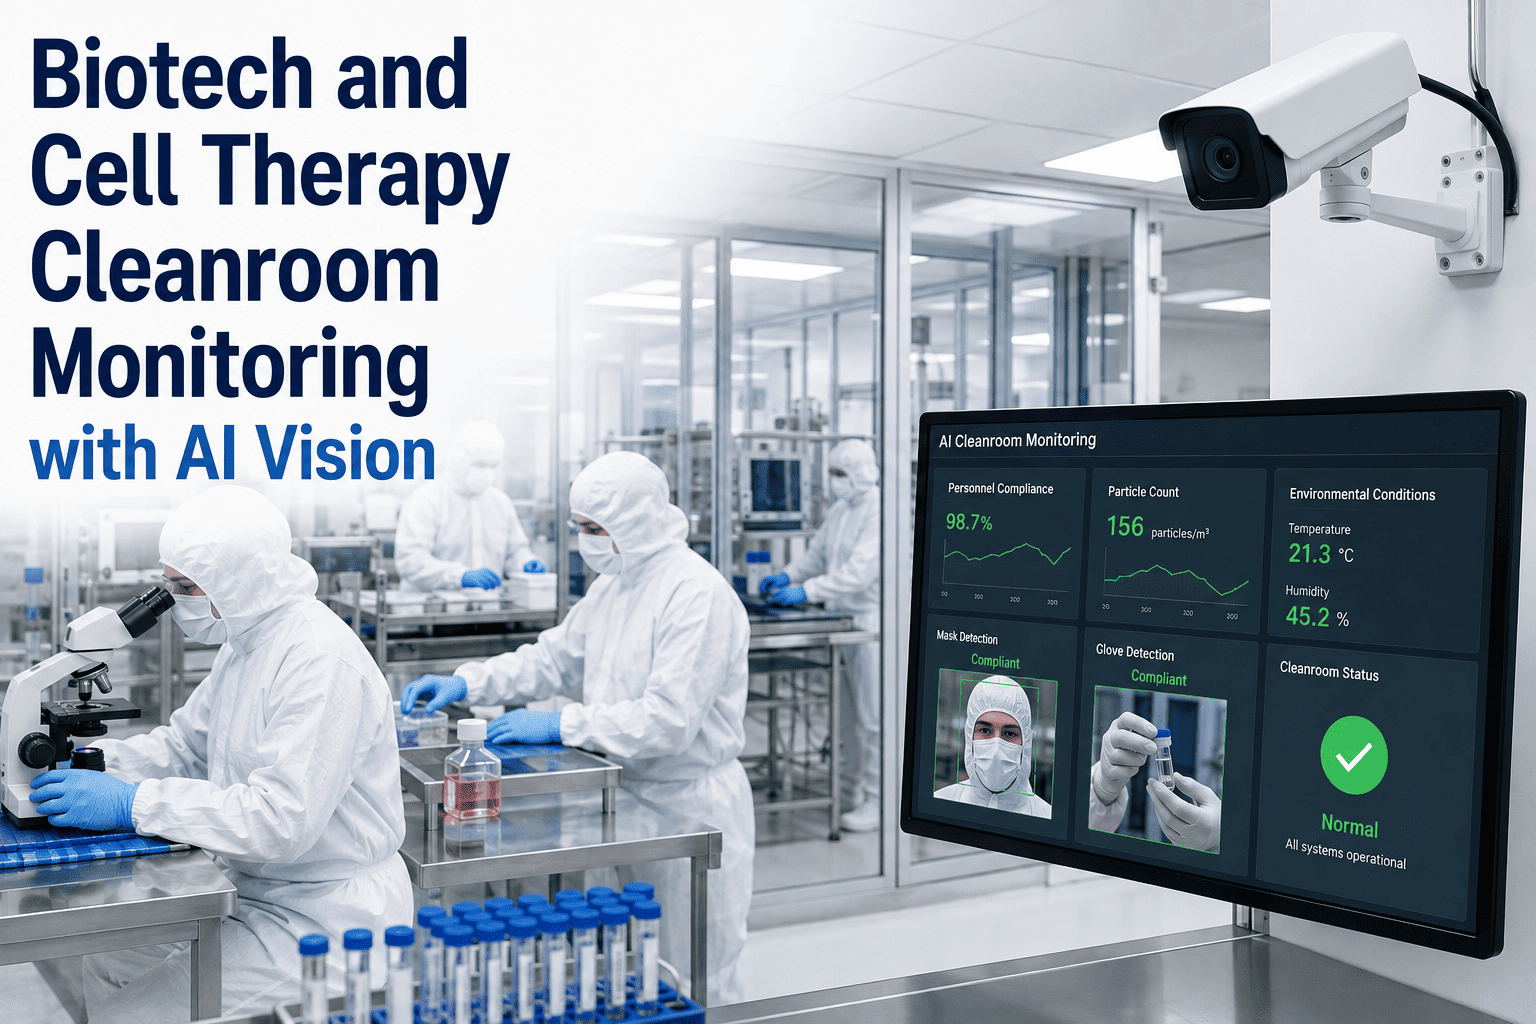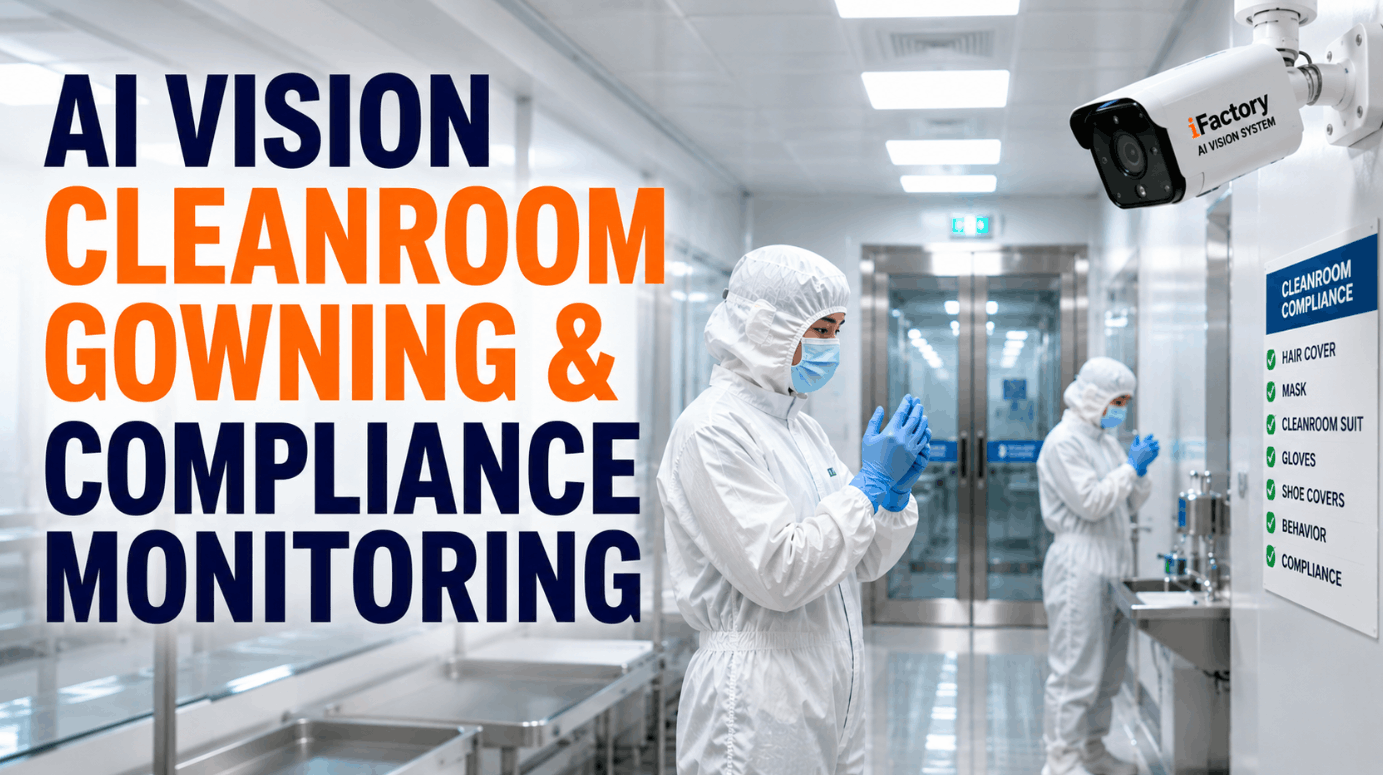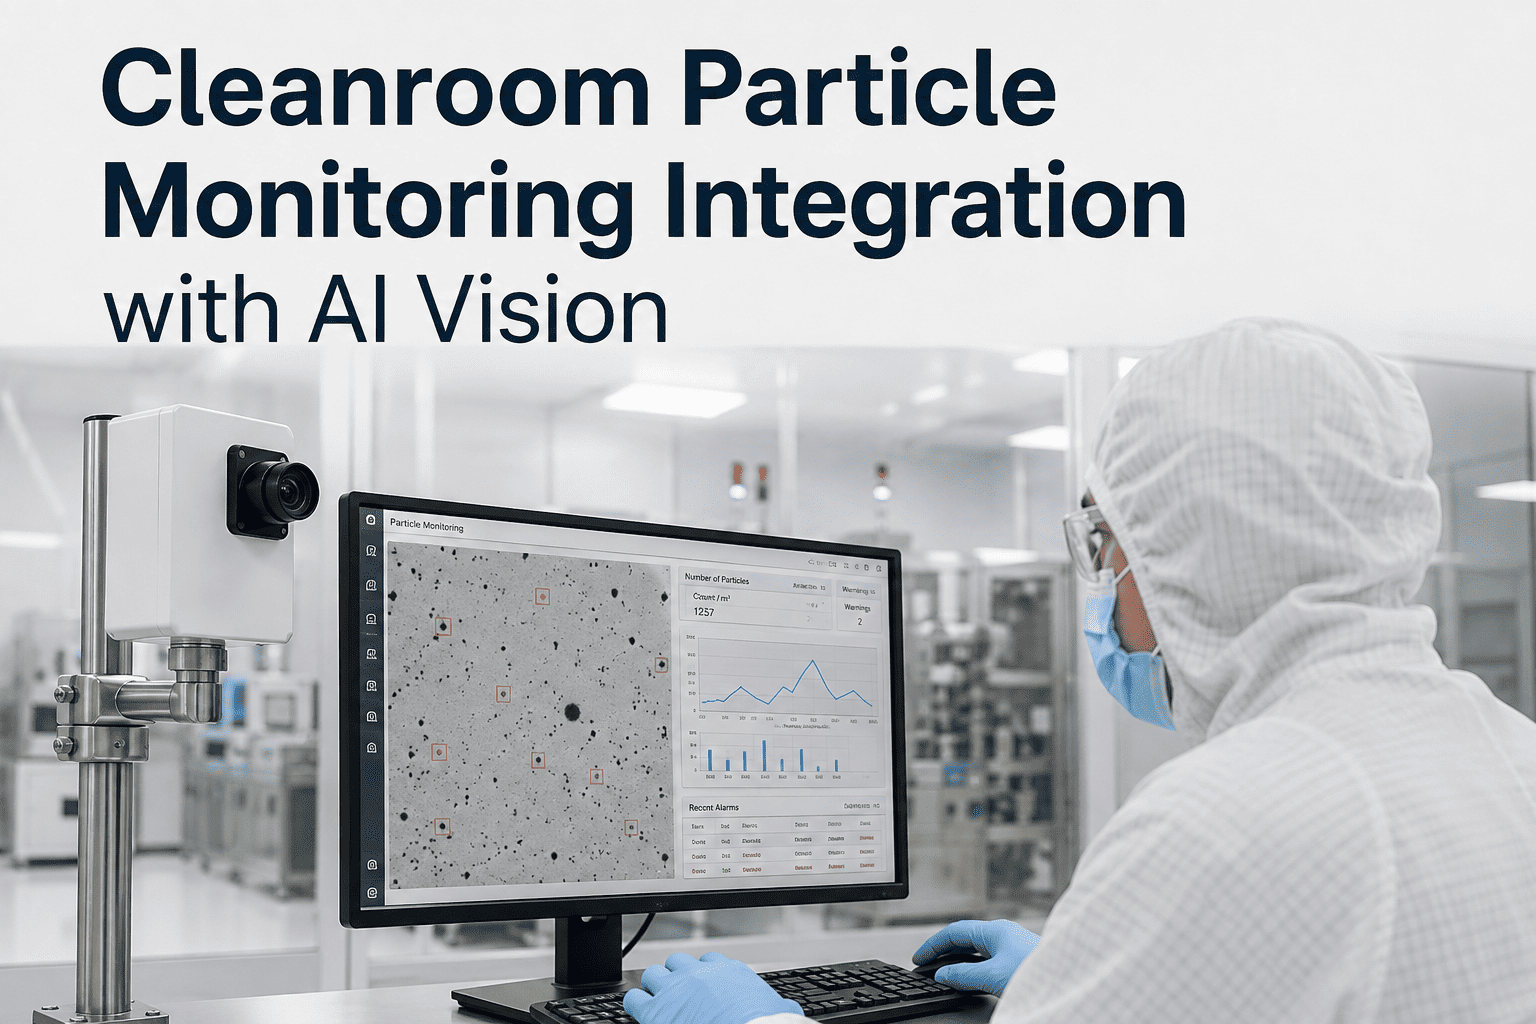
At 14:23 the particle counter in Grade B recorded a spike that pushed 0.5 micron counts three times past the action limit. The environmental monitoring system flagged an excursion. The investigation began. Batch impact assessment, resampling, HVAC log review, gowning log review, personnel interviews, root cause analysis using the 5 Whys — and forty-eight hours later the CAPA still couldn't say with certainty which specific behavior at 14:23 caused the spike, because nobody was watching that room at that moment. iFactory closes that gap by correlating live AI vision gowning and behavior data with particle counter output, so an excursion at 14:23 comes with a video-verified answer to what happened at 14:23. See it applied to your own cleanroom during a Book a Demo.
Every Particle Excursion Has A Cause. Most Investigations Never Find It.
iFactory's AI Vision Cameras correlate live gowning compliance and personnel behavior data with real-time particle counter readings, converting root cause analysis from a two-day exercise into a timestamped video answer.
particles shed by a single human operator every minute during normal cleanroom activity — and considerably more during rapid movement
Personnel are the primary contamination source in every classified environment — not HVAC, not equipment, not raw materials. The behavior of the humans inside the cleanroom is the behavior of the cleanroom itself. A single improperly donned glove in a Grade A filling suite has already been the root cause of multi-hundred-thousand-unit recalls, and personnel monitoring failures are treated by inspectors as early warning signs of systemic issues rather than isolated incidents.
Two Systems That Have Never Talked To Each Other
A modern cleanroom already collects the two datasets it needs to solve most contamination investigations. It just keeps them in separate silos that never get joined. Particle counters record when an excursion happened; gowning and behavior logs record who was in the room and what they were doing. Correlating them manually takes hours per event and still leaves gaps, because human memory of a shift two days ago is not reliable enough evidence for a regulatory CAPA and paper gowning logs were never built to align to a particle timestamp inside a few seconds. Investigators spend more time reconstructing what happened than analyzing why the excursion actually occurred. Correlating them automatically is what continuous AI vision was built for, and it turns the two systems into a single evidence trail rather than two parallel ones that never quite meet.
Knows When, Not Who
Continuous readings of airborne particle counts at each critical sampling location. Records the exact moment of every excursion, but says nothing about what caused it. Investigators are left to reconstruct the room from memory, logs, and interviews.
Knows Who And What, Not Why
Continuous visual record of who entered the room, whether gowning was compliant, what movements they made, and whether SOPs were followed. Rich behavioral data — but without particle data, no way to prove any behavior actually caused a contamination event.
Correlated in real time, a particle spike now comes with a video segment of the operator, action, and gowning state at the exact second it happened. Investigation stops being an exercise in reconstruction.
Which Personnel Actions Actually Move The Counter
Not every behavior creates the same contamination risk, and not every gowning deviation shows up in the particle count. Correlating months of behavior and particle data starts to reveal the specific action patterns that reliably drive excursions — the ones worth targeted retraining, and the ones that turn out to matter less than assumed. This shifts contamination control from a rule-based discipline enforced by inspection to a data-driven discipline informed by evidence, and it lets quality teams focus training and SOP investment where the actual correlation lives. The six behaviors below are the categories where correlated deployments consistently surface the strongest and weakest signals, though every site develops its own signature over time.
Rapid or Sweeping Movements
Fast arm motions, sudden turns, and reaching movements consistently spike particle counts in nearby sampling zones. Vision flags the movement pattern; the counter confirms the impact.
Gowning Breach Events
Exposed skin at the wrist, hood-neck gap, or improperly donned gloves correlate with elevated readings in adjacent zones within minutes of the breach becoming visible.
Door and Airlock Discipline
Double-door interlock breaches, prolonged door openings, and airlock cross-flow show up as pressure and particle disturbances that propagate through adjacent grades.
Personnel Density
Number of people in the room at once has a measurable but non-linear effect on baseline particle counts — the correlation surfaces the density thresholds specific to your room design.
Material Transfer Handling
Bag-handling technique, transfer-hatch discipline, and how raw materials cross between zones each carry a signature that shows up when vision and particle data are aligned.
Intervention Frequency
Manual interventions on equipment vary widely in their particle impact based on gowning state and technique — correlation data reveals which specific interventions warrant SOP updates.
A 14:23 Excursion — Investigated Two Ways
Regulators expect every environmental monitoring excursion to be investigated regardless of product impact, with root cause identified through structured RCA techniques and a documented CAPA that ties the corrective action to specific evidence. In practice, most excursion investigations struggle at the personnel dimension because the evidence base is fragmentary — gowning logs, access records, and operator interviews reconstructed from memory of a shift often ended two days ago. Below is what that investigation looks like without and with correlated vision data, tracing the same 14:23 event through both workflows to make the difference concrete, step by step.
Built Around ISO 14644 and EU GMP Annex 1 Expectations
Both ISO 14644-2 and EU GMP Annex 1 have moved toward continuous, risk-based monitoring rather than periodic testing, reflecting the reality that classification tests only prove performance at a point in time. Annex 1 goes further and explicitly calls for correlating particle excursions with personnel movements, equipment activity, process steps, and gowning events during actual production. Correlated AI vision is the operational answer to that regulatory expectation, not a workaround for it — and inspectors increasingly ask whether excursion investigations can actually connect a specific event to a specific cause, or whether "probable cause" language is being used as a placeholder for evidence the site never captured.
Airborne Particle Classification
Defines particle size classes and contamination limits per cleanroom class. iFactory pairs particle counter output at classified sampling points with visual context so classification data always comes with a story.
Ongoing Monitoring Plans
Requires a risk-based monitoring plan to demonstrate continuous performance between classification events. Correlated vision extends that plan from air data to behavioral evidence, closing the loop the standard originally opened.
Operational Behavior Controls
Covers personnel behavior, gowning protocols, cleaning procedures, and contamination control during active manufacturing. AI vision generates the objective behavioral evidence this section has always assumed but rarely captured continuously.
Continuous Grade A Monitoring
Requires continuous particle monitoring for Grade A throughout all critical processing and correlation of excursions with personnel and process events. Correlated vision delivers the correlation as a native output rather than a manual investigation step.
Attach A Face To Every Particle Spike
Bring your existing particle counter data and a room layout to the demo. We'll show you what correlated vision would have surfaced about your last three excursions.
What Correlated Vision Actually Delivers
Solving investigations faster is the visible benefit. The compounding value is what happens next — in training programs, batch release cycles, audit readiness, and the culture of the cleanroom itself. Correlated data doesn't just answer questions faster; it changes which questions the operation can ask at all. Quality leaders begin to see contamination as a solvable, measurable, trend-analyzable discipline rather than a series of one-off events with plausible narratives attached. The six downstream shifts below are the ones customers most consistently report inside the first year of deployment, and each of them independently justifies the correlation layer.
Targeted Retraining, Not Blanket Refresh
Instead of putting the whole shift through gowning requalification after an excursion, correlated data identifies the specific operator and specific behavior involved. Training reaches the person who needs it, and the people who don't stay productive.
Faster Batch Release Decisions
A batch impact assessment that used to wait on a multi-day investigation now has evidence within hours. Batches move to release or hold with a clear factual basis rather than a precautionary delay.
Audit-Ready Evidence Files
Every excursion carries a self-documenting evidence package with particle data, vision segment, and CAPA linked. Auditors see the investigation trail in the record instead of asking for reconstructions.
Preventive Trend Analysis
Aggregated correlation data reveals the behaviors, shifts, or rooms that most frequently drive excursions, letting quality teams intervene before the next spike rather than after it.
Objective Operator Coaching
Coaching moves from "you should be more careful" to a specific video moment showing exactly what happened and what the counter did in response. Behavior changes stick because the evidence is unambiguous.
Reduced Recovery Time Impact
Faster identification means faster containment, cleaning, and reconditioning of the affected zone. Downtime associated with contamination recovery contracts significantly across the year.
Not All Zones Carry Equal Contamination Risk
EU GMP Annex 1 emphasizes risk-based approaches to monitoring location selection, and correlation coverage should follow the same logic. Grade A zones during aseptic processing carry the highest consequence per excursion; Grade B backgrounds during interventions carry the highest frequency of behavior-driven events; gowning airlocks are the boundary layer where nearly every contamination path either succeeds or fails. Prioritizing correlation coverage across these zones rather than uniformly is how deployments deliver value fastest.
Critical Aseptic Zones
Filling lines, open product zones, and aseptic connection points. Continuous particle monitoring is regulatory required here; correlated vision on operator interventions is where the highest-consequence root causes live.
Background Support Zones
The zones immediately surrounding Grade A where operators spend most of their time. High density of personnel movement means highest frequency of behavior-driven particle events.
Gowning Transition Zones
The boundary where gowning compliance either succeeds or the whole downstream chain of contamination begins. Correlating gowning technique with post-transition particle behavior surfaces the actual weak links.
Preparation Zones
Material staging, equipment prep, and component handling. Contamination introduced here migrates through the pressure cascade if not caught early, making upstream correlation valuable for preventing downstream events.
How iFactory Sits Alongside Your Existing EMS
Correlated vision is not a replacement for the environmental monitoring system, the particle counters, or the QMS. It is a correlation layer that reads existing signals, adds vision context, and pushes correlated events into the systems already used for excursion handling and CAPA. The floor keeps its tools; the investigation gains an evidence layer. Because the qualified instruments stay in place, validation and requalification impact is minimized, and because the correlation engine speaks the same interfaces existing systems already expose, integration is measured in weeks rather than a multi-quarter platform project. The four-layer stack below is how the pieces fit together in a typical deployment.
The hardest part of any excursion investigation was always the personnel side — reconstructing who did what and when from memory, gowning logs, and access records that were never designed to reconcile against a particle timestamp. Correlated vision made that entire reconstruction step disappear. We open the excursion record, we see the operator, we see the action, we see the count. What used to be a two-day investigation is now a five-minute review, and our CAPAs are actually specific for the first time. Our inspection responses used to lean on probable-cause language; now they carry timestamped visual evidence, and the difference in the tone of those interactions has been dramatic.
Frequently Asked Questions
Q: Does correlated AI vision replace our environmental monitoring system or our particle counters?
Q: How does the vision system handle privacy and personnel dignity concerns inside cleanrooms?
Q: What if a particle spike has a genuinely non-personnel cause like HVAC or equipment failure?
Q: Can this be deployed in an already-qualified cleanroom without triggering a full requalification?
Q: How is the correlated data protected for audit and 21 CFR Part 11 purposes?
Give Your Next Excursion An Actual Answer
Book thirty minutes with our team, share a recent excursion report along with the corresponding particle counter output, and see what correlated AI vision would have surfaced about the personnel behavior at the exact second it happened — and how much faster your CAPA cycle could close.