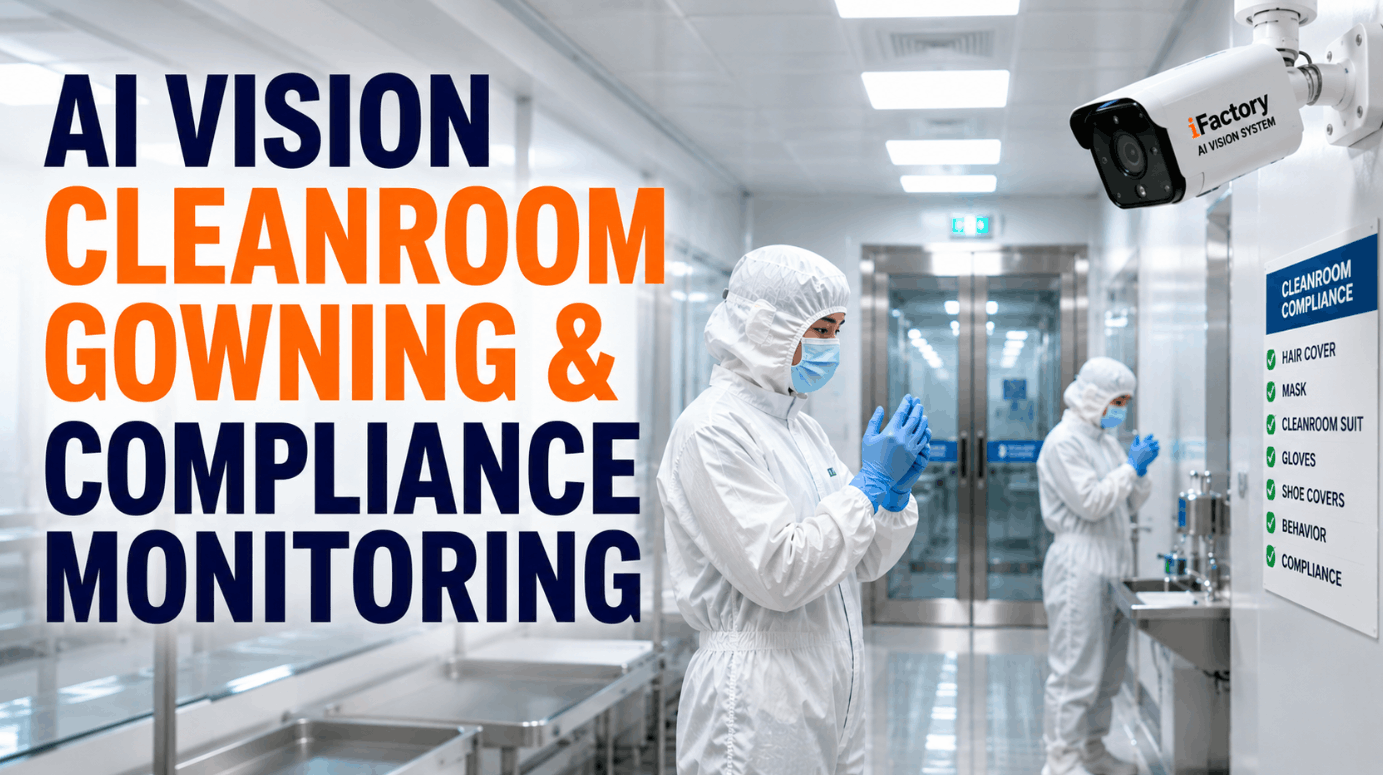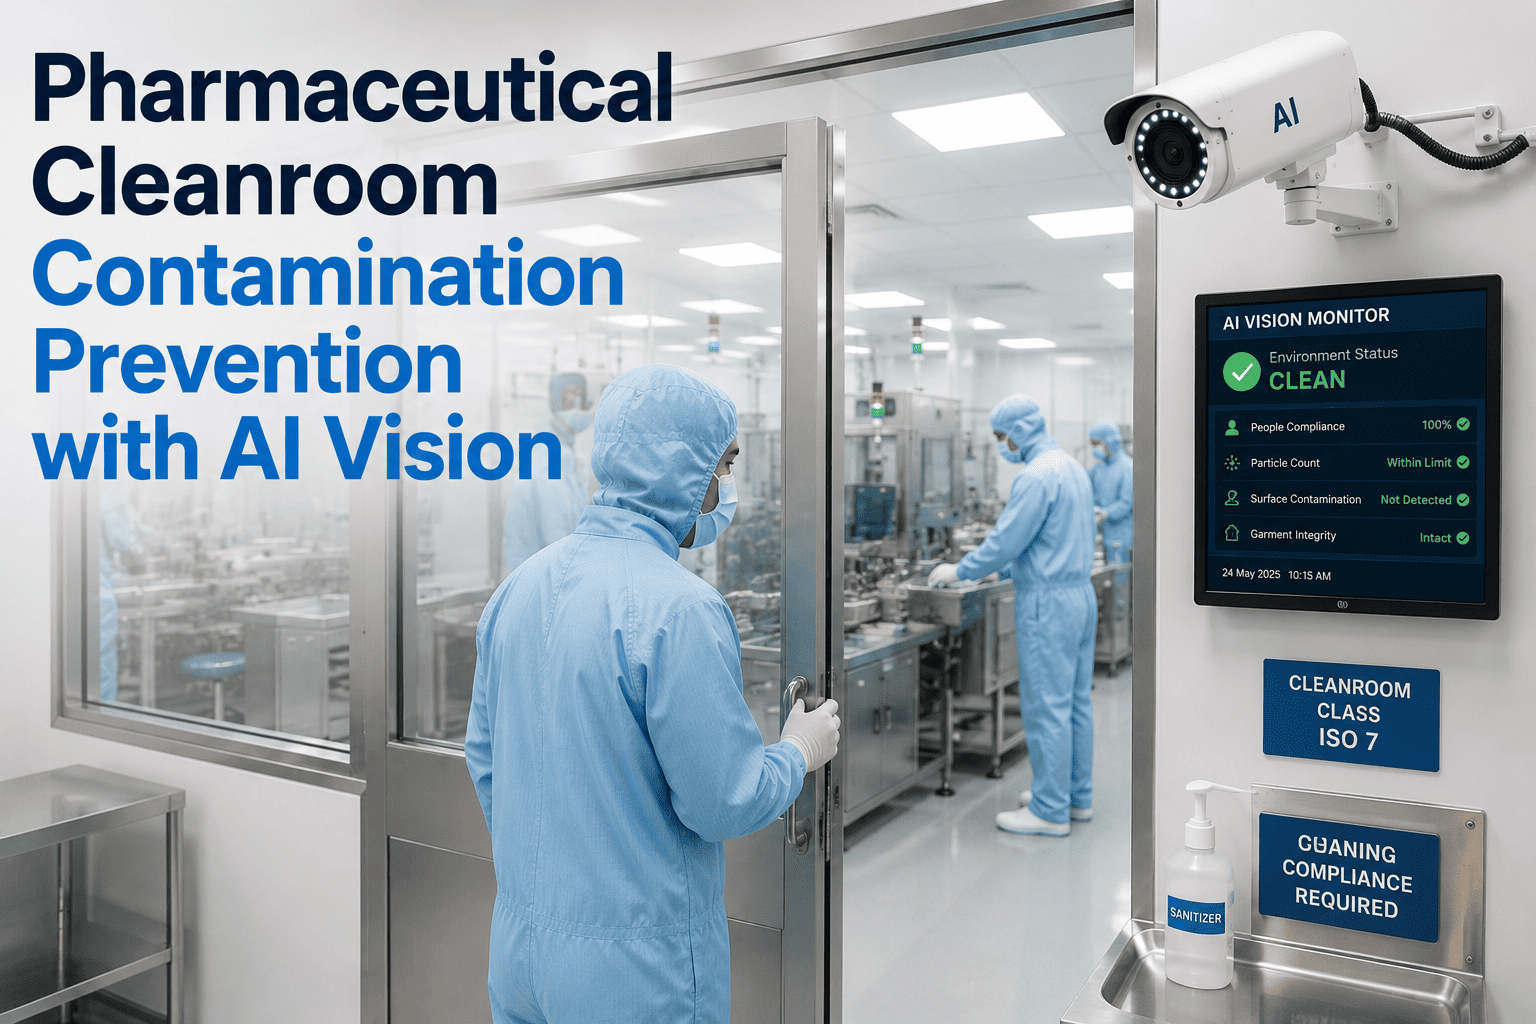
A single contamination event in a sterile pharmaceutical cleanroom does not just ruin one batch — it triggers a cascade of batch destruction, raw material write-offs, equipment sanitization, root-cause investigations, regulatory notifications, and production halts that routinely push total losses past one million dollars before anyone accounts for the market value of doses that never shipped. Personnel are the source of 75 to 80 percent of all particles found in cleanroom environments, and the behaviors that introduce those particles — improper gowning, face touching, excessive movement, blocked first air, open doors — happen faster than any human observer can consistently catch across a full production shift. AI vision cameras change this by monitoring gowning sequence, garment integrity, and operator behavior continuously across every classified area, detecting violations in real time and generating the GMP-ready documentation that stands up to FDA and EU GMP Annex 1 scrutiny. Quality and operations teams protecting high-value sterile production lines can book a 30-minute demo to see iFactory's contamination prevention platform running on live cleanroom footage.
Pharmaceutical Cleanroom Contamination Prevention with AI Vision
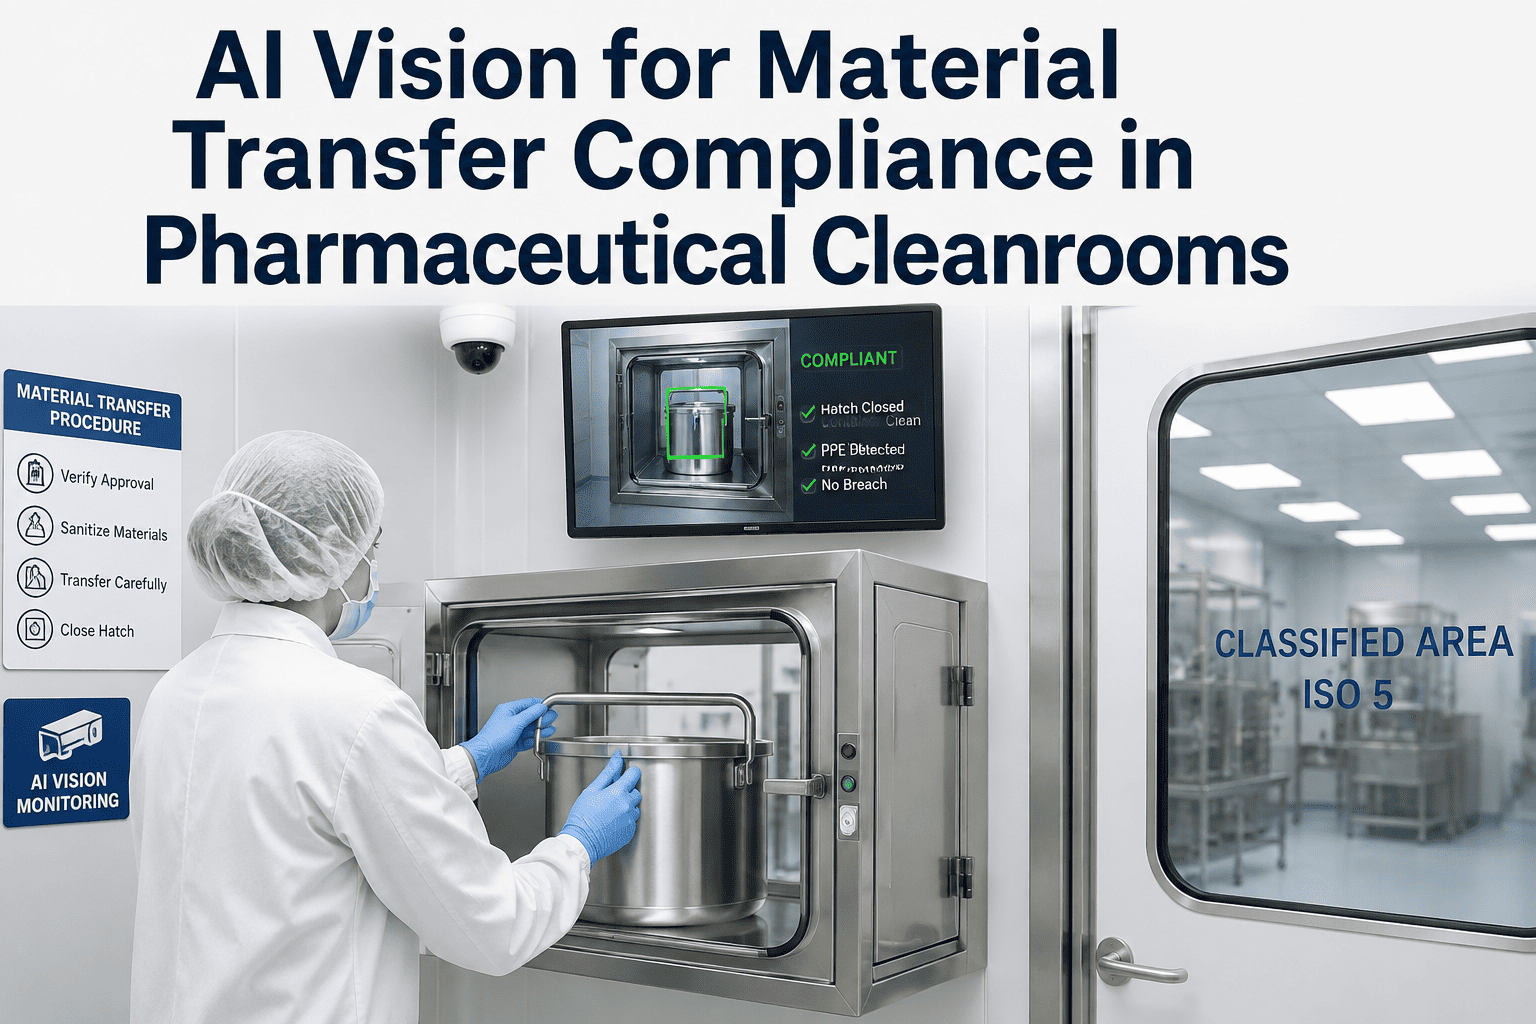
Real-time monitoring of gowning sequence, garment integrity, and personnel behavior across every classified zone — catching the violations that lead to batch loss before contamination reaches the product.
What a Single Contamination Event Actually Costs
The financial damage from a cleanroom contamination incident is not one number — it is a chain of costs that compounds at every stage from detection through resolution. Most facilities underestimate total exposure because the visible cost (the destroyed batch) is only the first line item in a much longer invoice.
Where Contamination Actually Comes From
Understanding contamination source distribution is the first step in deciding where AI vision delivers the highest protection value. The data is consistent across decades of cleanroom research — people dominate every other source combined, and the behaviors people exhibit inside the cleanroom are the controllable variable that AI is built to watch.
Personnel generate 100,000 particles per minute while sitting still and up to 5,000,000 particles per minute during active movement. A single face touch transfers roughly 1,000 bacteria along with uncountable non-viable particles. AI vision targets the 75–80% of contamination risk that originates from human behavior — the largest, most variable, and most controllable contamination source in any cleanroom.
Three Layers of AI Vision Protection
iFactory's contamination prevention platform operates across three distinct detection layers — each targeting a different stage of the personnel contamination pathway. No single layer alone is sufficient; the combination provides defense-in-depth from the gowning room through active production.
Gowning Sequence Verification
AI cameras verify every garment in the donning sequence — shoe covers, hair cover, face mask, coverall, hood, goggles, inner gloves, boot covers, and outer sterile gloves — before the operator is cleared to enter the cleanroom. The system checks garment presence, correct sequence order, seal integrity at collar, cuffs, and ankles, and confirms the sterile glove sanitization step is completed. Any failure holds the entry door and identifies the specific garment requiring correction.
Garment Integrity Monitoring
Once inside the cleanroom, garment integrity degrades over time through movement, bending, reaching, and normal wear. AI continuously monitors for hoods that shift above the collar line, masks that slip below the nose bridge, glove cuffs that separate from sleeves, and coverall closures that open during activity. These are the slow-developing failures that manual observation almost never catches because they happen gradually between periodic checks.
Behavior Compliance Monitoring
Contamination does not only come from garment failures — it comes from what operators do while inside the cleanroom. AI detects face or hair touching through the gown, excessive or rapid movement that disrupts laminar airflow, leaning over open product or blocking first air, eating or drinking in production areas, unauthorized personnel entry, and objects placed on the floor. Each detected behavior is logged with operator ID, timestamp, location, and violation type for trending and CAPA integration.
See all three detection layers running on a live cleanroom feed.
A 30-minute demo walks through gowning verification, garment integrity monitoring, and behavior detection using real production footage — with the compliance evidence trail each layer generates mapped to your specific regulatory framework.
What FDA and EU GMP Inspectors Are Looking For
Regulatory enforcement has shifted from asking whether contamination controls exist to demanding objective evidence that they work continuously. Recent FDA warning letters and EU GMP Annex 1 requirements reveal exactly what inspectors are scrutinizing — and where AI vision provides the evidence trail that manual systems cannot.
| Inspector Focus Area | What Gets Cited | What AI Vision Provides |
|---|---|---|
| Personnel Gowning | Exposed skin, hair, or bare hands in classified areas; gowns touching floor during donning | Timestamped garment-by-garment verification for every operator at every entry event |
| Aseptic Behavior | Operators blocking first air during filling; touching face, hair, or non-sterile surfaces | Continuous behavior monitoring with real-time alerts and operator-specific violation logs |
| Environmental Monitoring Correlation | Failure to correlate EM excursions with personnel practices during the affected production window | Personnel compliance data indexed by timestamp and zone, cross-referenceable with EM events |
| Training Effectiveness | Generic requalification without evidence that specific failure modes were addressed | Operator-level violation trend data identifying exactly which behaviors and garment steps need targeted retraining |
| Contamination Control Strategy | CCS documentation that lacks continuous monitoring data for personnel as a contamination source | Ongoing personnel compliance dataset feeding directly into the CCS as objective, trend-ready evidence |
| Data Integrity | Paper-based gowning logs with no verifiable audit trail; checkbox compliance without objective evidence | Automated records with audit trails, electronic signatures, and 21 CFR Part 11 compliant data controls |
Before and After AI Vision Deployment
The difference between a cleanroom operating on manual contamination controls and one running AI vision is not incremental — it is a structural shift from reactive detection to real-time prevention that changes how quality teams spend their time and how confidently a facility faces regulatory inspections.
Batch Protection Value — The ROI That Matters
The return on AI vision deployment is not measured in software metrics — it is measured in batches saved, investigations avoided, and audit findings prevented. The math is straightforward because the cost of a single contamination event dwarfs the cost of continuous AI monitoring over its entire operational life.
Cost of One Contamination Event
A single batch loss in sterile pharmaceutical manufacturing costs one to two million dollars in direct losses. Severe incidents involving biologics, equipment replacement, and regulatory action push total costs to nine million dollars or more per event.
Personnel-Origin Contamination
Three out of every four contamination particles found in cleanroom inspections trace back to human personnel. AI vision targets the dominant contamination source that manual observation has never been able to monitor continuously.
Industry Batch Failure Rate
Biopharmaceutical manufacturing reports total batch failure rates around seven percent, with contamination among the leading causes at commercial scale. Even a small reduction in contamination-related failures delivers outsized financial returns.
Continuous vs. Periodic Coverage
Manual observation covers minutes per hour at best. AI vision covers every second of every shift across every classified zone simultaneously — eliminating the coverage gaps where most undetected violations occur.
Frequently Asked Questions
How does AI vision reduce contamination risk without reducing the number of operators in the cleanroom?
AI vision does not remove operators from the cleanroom — it makes the operators already working there less likely to introduce contamination by catching garment failures and risky behaviors the moment they occur rather than after the damage is done. When an operator's mask slips below the nose bridge or a glove cuff separates from a sleeve, the system alerts in real time so the issue is corrected in seconds rather than persisting for hours. The result is the same workforce operating under tighter contamination control without adding headcount or reducing productivity. Over time, the data also shows which operators and which behaviors generate the most violations, so training becomes more targeted and effective. Book a demo to see how real-time alerting works alongside normal cleanroom production operations.
Does the system generate false positives that disrupt production?
The AI model is trained on thousands of real cleanroom gowning and behavior scenarios, including edge cases like garments of different colors, operators of different body types, and cleanrooms with varying lighting conditions. False positive rates are tuned during the deployment phase by running the system in observation-only mode against live production before enabling real-time alerting. During this calibration period, quality teams review flagged events and adjust detection sensitivity so the system matches the facility's own SOP thresholds rather than imposing generic rules. Once calibrated, the system consistently detects genuine violations while filtering out normal movement and acceptable variation. If a false positive does occur, operators can acknowledge it at the station and the event is logged for model refinement. Contact Support for details on calibration timelines and false-positive benchmarks from existing deployments.
Can AI vision data be used to satisfy Annex 1 Contamination Control Strategy documentation requirements?
Yes — the 2022 revision of EU GMP Annex 1 requires every site to maintain a documented Contamination Control Strategy covering at least sixteen elements, with personnel practices, gowning, monitoring, and continuous improvement among the most heavily scrutinized. AI vision feeds directly into several of these CCS elements by providing continuous, objective personnel compliance data that can be trended over time, analyzed for recurring failure patterns, and used to demonstrate that the site's contamination controls are effective rather than simply documented. The platform generates exportable reports formatted for CCS review cycles, and violation trend data integrates into CAPA workflows when systemic issues are identified. This transforms the CCS from a static policy document into a living compliance system backed by real operational evidence. Book a demo to review how AI vision data maps to each of the sixteen Annex 1 CCS elements.
What infrastructure changes does the cleanroom need for AI camera installation?
The system is designed to integrate into existing cleanroom infrastructure with minimal disruption. Cameras use cleanroom-rated, non-particle-generating housings with sealed cable routing that does not compromise room pressure differentials. Power and network cabling route through existing conduit paths or sealed wall penetrations. The AI model runs on a local edge compute unit installed outside the classified area — no cloud dependency, no data leaving the facility network. Most installations require two to four cameras per gowning room and two to six cameras per production zone, depending on room geometry, operator throughput, and sight-line requirements. The full installation is typically completed in one to two days per room without production shutdown. Contact iFactory Support to schedule a site assessment and receive a camera placement plan for your specific cleanroom layout.
How does the platform handle data privacy and GxP data integrity requirements?
All AI processing occurs on a local edge compute unit within the facility's own network boundary — video frames are analyzed in real time and compliance events are logged, but raw video is not stored or transmitted unless the facility's own data retention policy requires it. The platform supports configurable retention rules, access controls, electronic signatures, and tamper-evident audit trails that meet 21 CFR Part 11 and Annex 11 data integrity requirements. Operator identification can be configured using badge-based authentication rather than facial recognition if the facility's privacy policy requires it. The validation package follows GAMP 5 and FDA Computer Software Assurance guidance, with IQ, OQ, and PQ documentation covering each detection model. Book a demo to review the data architecture, privacy controls, and validation documentation with iFactory's compliance engineering team.
Every contamination event that reaches a batch started as a behavior someone did not see in time. AI vision sees it.
iFactory's AI vision platform monitors gowning, garment integrity, and operator behavior across every classified zone — catching the violations that lead to batch loss before contamination reaches the product. A 30-minute demo builds a live contamination prevention view against your facility layout and production workflow.