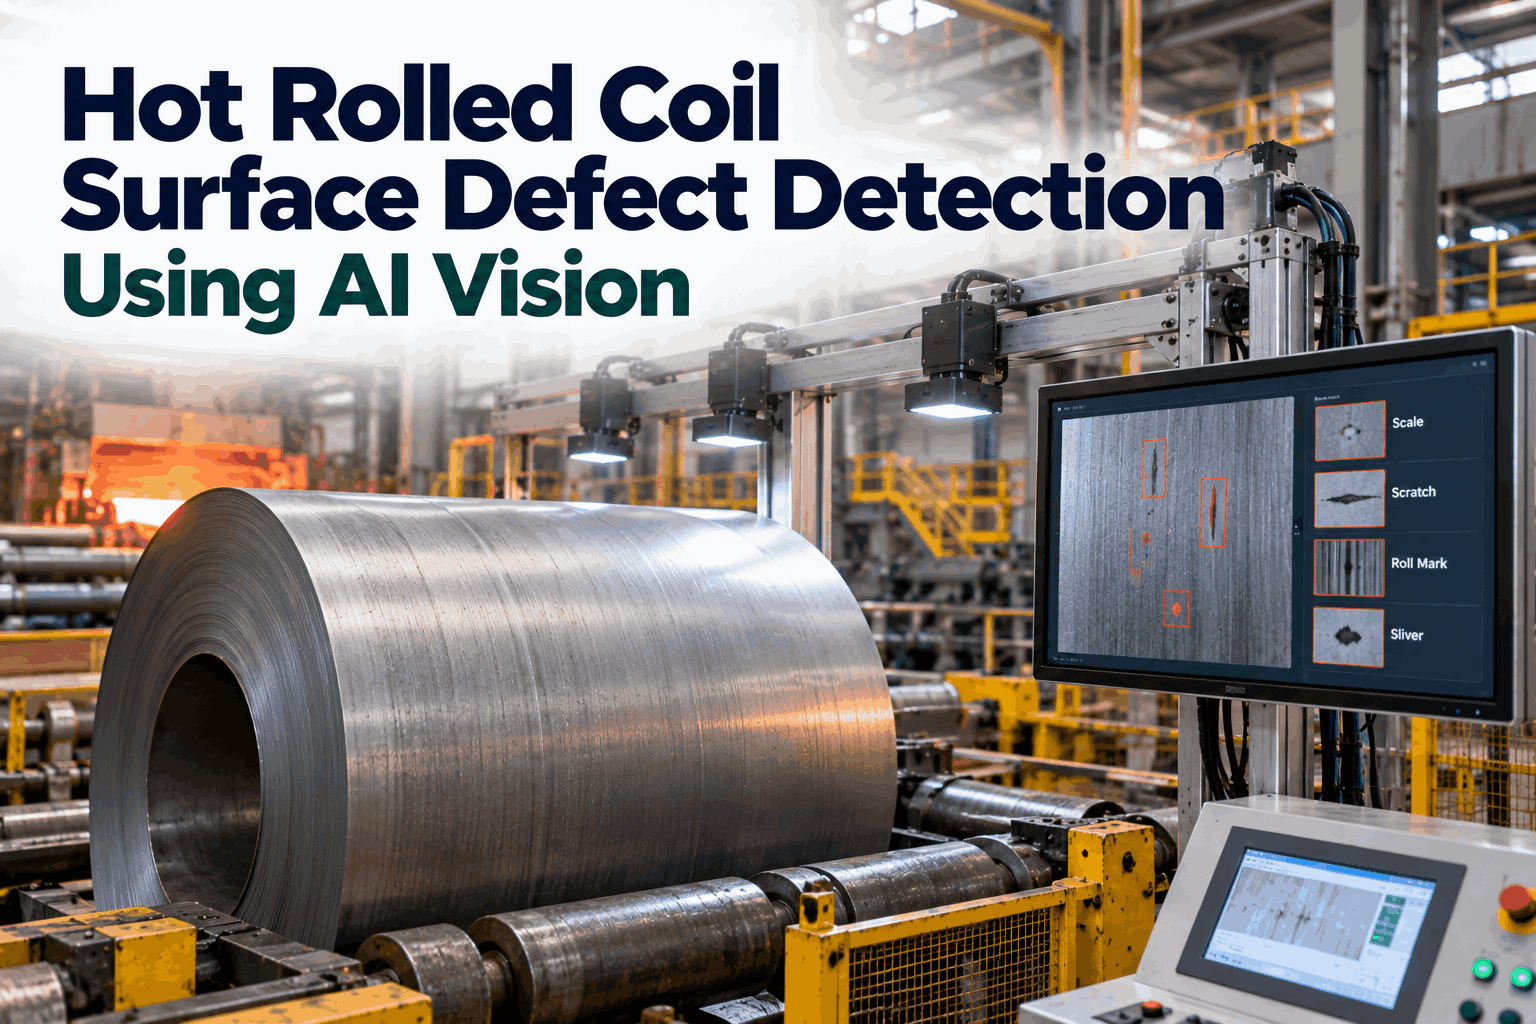
Hot-rolled coil moves through a finishing mill at 20 metres per second. The strip glows orange, radiates 900°C of heat, and travels beneath a canopy of steam and scale dust. A human inspector at the runout table has less than 50 milliseconds to observe any given square metre of surface. Under those conditions, detection tops out at 60–65% on a good day shift and drops below 50% by hour eight of a night watch. A flat-rolled steel producer running a 2-million-tonne-per-year hot strip mill deployed AI vision line-scan cameras at four inspection points along the mill. Within 11 months, surface defect detection improved by 40 percentage points over manual grading, customer quality claims dropped 55%, and downgrade losses fell $1.8M annually — book a demo to see the same architecture on your coil line.
CASE STUDY · STEEL · HOT STRIP MILL
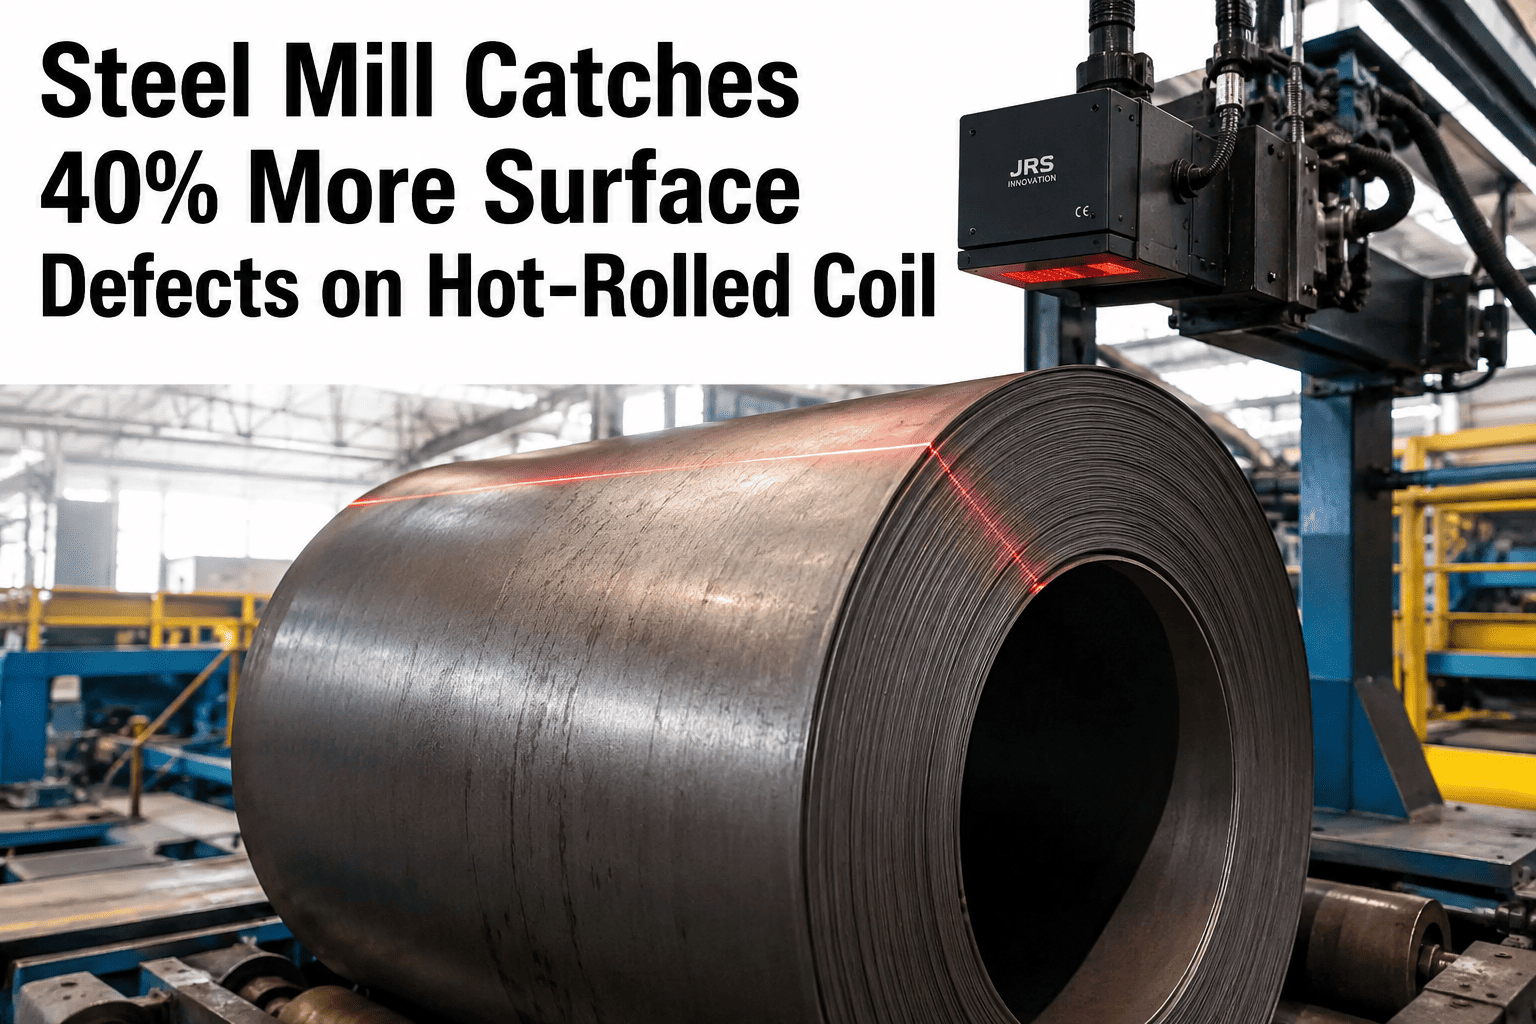
Steel Mill Catches 40% More Surface Defects on Hot-Rolled Coil
Line-scan cameras at four inspection points along a 2Mt/yr hot strip mill pushed surface defect detection from 58% to 98.4%. Customer quality claims fell 55% in year one. Downgrade losses dropped $1.8M annually. Roll-mark root cause was identified 6–10 coils earlier than manual grading.
+40 pts
Surface defect
detection gain
98.4%
AI detection rate
vs 58% manual baseline
55%
Customer quality
claims reduction
$1.8M
Annual downgrade
losses avoided
The Mill Behind the Numbers
A flat-rolled producer operating a modern hot strip mill with continuous caster, roughing train, seven-stand finishing mill, and two down-coilers. Annual output was 2 million tonnes across API line pipe, automotive-grade, and appliance-grade coils. The quality problem was not throughput — the mill was hitting production targets. The problem was what the strip looked like when it got to the customer.
MILL PROFILE
Annual output2.0 Mt
Line speed at finishing exit18–22 m/s
Strip width range900–1,880 mm
Gauge range1.8–16 mm
Product mixAPI, auto, appliance
Inspection team12 graders, 3 shifts
QUALITY BASELINE (PRE-AI)
Manual detection rate58%
Prime-grade downgrade rate3.7%
Customer quality claims / month34
Avg claim value$18,400
Annual downgrade losses$4.2M
Auto-OEM scorecard rank3rd tier
Why 60% Was the Detection Ceiling
The 58% baseline was not a training problem. It was a physics problem. Four environmental factors at the finishing mill exit make sustained high-accuracy human inspection biologically impossible — not difficult, impossible. Understanding this is why the mill’s previous investment in more inspectors and better lighting failed to move the number.
01
Thermal Radiation Saturates Vision
900°C strip
The strip glows orange-red across the entire visible spectrum. Surface features contrast at 5–8% against the glowing background — below the threshold at which human eyes reliably discriminate. Fine cracks, low-contrast inclusions, and early-stage laminations simply do not register.
02
Scale, Steam, Dust Obscure Surface
40–60% occlusion
Descaling residue, water vapour, and airborne scale dust occlude 40–60% of the strip surface at any given moment. Inspectors are guessing at what lies beneath transient obstructions. AI vision uses timed strobe capture between descaling sprays to shoot the strip clean.
03
Strip Speed Eliminates Observation Time
50ms / m²
At 20 m/s across a 1,500mm strip, an inspector has 50 milliseconds to observe each square metre. Human saccadic eye movement takes 200–300 milliseconds to fixate. The inspector is not seeing the strip — they are seeing statistical samples of it.
04
Fatigue Compounds Every Hour
65% → 42%
Detection rate on day shift starts at 65% and drops to 42% by hour eight of a night shift. Night-watch escapes were 2.3x day-shift escapes across 18 months of forensic data. No amount of coffee changes the biology of sustained visual attention.
The Eight Defect Families — Before and After AI
Steel surface defects are not one problem — they are eight distinct families, each with its own visual signature, its own root cause upstream, and its own detection difficulty. The table below shows the mill’s human detection rates on each family versus AI vision detection after 11 months of deployment, drawn from adjudicated hold-out samples across all three shifts.
Inclusions and laminations show the largest gain — these are the defects that cost the most in customer claims because they survive downstream pickling and cold rolling, then surface during stamping or forming at the end customer. AI catches what the human eye is biologically incapable of seeing under mill conditions.
Send a Coil Sample. See Your Defect Distribution in 5 Days.
Ship coil-end samples with confirmed defects, or share 1,000+ images from your existing inspection archive. iFactory vision engineers return expected AI detection rates by defect family — before you commit to a pilot.
Four Cameras, One Strip: Inspection Coverage Across the Mill
The mill deployed line-scan cameras at four inspection points, not one. A single camera at the finishing exit is the industry default — and it is why most steel AI vision deployments underperform. Defects originate at different points along the mill, and the earlier they are caught, the sooner the upstream root cause can be corrected on the next coil.
POINT 1
Roughing Mill Exit
Line-scan cameras at 45–70mm gauge, 6–8 m/s. Catches caster-originated defects — slivers, transverse cracks, blowholes — before finishing rolling amplifies them.
Slivers
Transverse cracks
Blowholes
→
POINT 2
Finishing Mill Exit
The main inspection point. Top and bottom line-scan cameras at 20 m/s, 0.1mm resolution. Multi-angle strobe lighting synchronized to strip encoder for motion-free capture.
Rolled scale
Roll marks
Edge cracks
→
POINT 3
Coiler Entry
Post-runout cooling. Strip at 400–500°C reveals subsurface laminations that were invisible at 900°C. Thermal contrast imaging catches what visible-spectrum cameras cannot.
Laminations
Inclusions
Scabs
→
POINT 4
Coiler Exit
Final coil surface check. Verifies telescopicity, wrap alignment, and coil-break marks caused by handling. Ties defect location to VIN-equivalent coil ID for full traceability.
Telescopicity
Coil breaks
Handling marks
Camera resolution
0.1mm per pixel at 1,880mm width
Inference latency
Under 50ms per frame, on-prem NVIDIA GPU
Housing rating
IP67 water-cooled, air-purged
Defect classes trained
62 across 8 families, IPC/IIS grading
How a $50 Defect Becomes a $50,000 Claim
Every undetected defect on a hot-rolled coil enters a value amplification pipeline. It gains cost at every downstream step until it reaches the customer. A surface crack that could have been diverted at the hot mill for $200 in downgrade cost becomes a $45,000 warranty claim after cold rolling, coating, slitting, and shipping to an automotive stamper who discovers it during press forming.
HOT MILL EXIT
$50–$200
Diverted to secondary grade or scrap. Root cause identified from AI defect pattern. Loss contained on that coil.
COLD ROLL & COAT
$800–$3,500
Coil is processed further before defect is found. Cold rolling and galvanizing costs are already sunk. Downgrade or scrap decision comes late.
SLIT & SHIPPED
$5,000–$18,000
Coil is slit into customer widths and shipped. Rejection triggers expedited replacement, return freight, and truckload penalty.
CUSTOMER STAMPING
$18,000–$50,000+
Defect surfaces during forming or press cycle. Customer scorecard hit. OEM contracts under review. Warranty exposure compounds.
$1.8M
Annual downgrade savings, year 1
$3.4M
Customer claim cost reduction, year 1
9 months
Payback on full deployment
1st tier
OEM scorecard, from 3rd tier
From Defect Detection to Root-Cause Maintenance
Catching a defect on the current coil is worth something. Preventing the same defect on the next thousand coils is worth far more. The mill wired iFactory AI detection into its CMMS — every defect pattern that traced back to an asset generated an automatic work order. Progressive roll marks that used to propagate across 200–400 tonnes before an inspector noticed are now flagged after 6–10 coils.
1
AI Detects Defect Pattern
Line-scan camera captures defect. Model classifies family and severity. Coil ID, position on strip, and image evidence attached to record within 50ms.
↓
2
Pattern Traces to Upstream Asset
Roll marks with fixed periodicity map to a specific work roll. Sliver clusters near strip edge trace to caster mould. Rolled-in scale traces to descaler nozzle wear.
↓
3
CMMS Work Order Auto-Generated
Defect pattern crosses threshold. Work order created against the responsible asset with defect images, coil IDs affected, and recommended intervention. Maintenance owns the fix.
↓
4
Prevention Verified on Next Coils
After maintenance action, AI monitors the same defect signature on subsequent coils. Confirmation of resolution logged. Closed loop from pixel to work order to prevention.
Real Example: Progressive Roll Mark on F5 Work Roll
Month 4 of deployment. AI detected a faint periodic linear mark at 2,240mm periodicity on coil #48,391. Same pattern reappeared on coils #48,392 and #48,393. Pattern periodicity matched the F5 work roll circumference. CMMS work order auto-generated: inspect F5 work roll surface. Maintenance team found chipped work roll edge. Roll change scheduled for next window. Manual inspection would have flagged the pattern at approximately coil #48,600 — a 210-coil delay representing $340,000 in avoided secondary-grade downgrade on this single event.
Frequently Asked Questions
The questions this mill’s quality manager and maintenance director asked during evaluation — the same ones most integrated steel producers ask before committing to AI vision on hot-rolled coil.
How do line-scan cameras survive 900°C thermal radiation and scale dust at the finishing exit?
Camera housings are IP67-rated stainless steel, water-cooled through a closed-loop chiller, and air-purged with dry instrument air to keep the optical window clear of steam and scale particulate. Optics use heat-rejection filters tuned to the strip’s thermal emission spectrum, so the sensor sees surface features rather than the glow. Mounting frames are vibration-isolated from the mill floor. This mill has run continuous operation for 11 months without a camera failure. Contact
iFactory support for the full environmental spec sheet.
How much labelled defect data did the mill need to reach 98.4% detection?
The mill contributed roughly 12,000 confirmed defect images from three years of archived inspection records, split across the eight defect families. iFactory pre-trained models supplied the base architecture; mill-specific fine-tuning ran on the top 3 defect families first, then expanded family-by-family over the first 8 weeks. Rare families like laminations required active data mining during shadow mode to build sufficient training samples. Detection above 95% on all eight families was reached by week 20 of full production.
Does the AI system replace the human inspection team?
No. The 12-person team was reallocated, not eliminated. Six graders moved to defect adjudication and model retraining — the human-in-the-loop role that keeps AI accurate as steel grades and defect distributions shift. Three moved to upstream root-cause engineering, where they now investigate patterns that AI surfaces from the mill data. Three moved to customer quality liaison. Total quality headcount stayed constant; the work shifted from spotting defects to preventing them.
How does the system handle new steel grades or product mix changes?
The mill runs API, automotive, and appliance grades on the same line, each with different surface finish specs and different defect acceptance criteria. AI models share a common defect-classification backbone but apply grade-specific severity thresholds tuned during pilot. Adding a new grade takes 1–2 weeks of threshold calibration against 200–400 sample coils, no retraining of the base model. This is what makes the platform practical for mills with mixed product portfolios rather than single-grade operations.
What does the integration with our existing CMMS and quality management look like?
iFactory publishes defect events to a local message broker. A Level 2 bridge translates events into CMMS work orders via REST API, into MES quality records via OPC-UA, and into customer quality certificates via SAP QM. The mill kept its existing SAP QM, Aveva MES, and CMMS platforms — iFactory sits alongside them and feeds decisions in through standard protocols. No rip and replace, no shadow architecture. To scope integration for your specific stack,
book a demo with an iFactory integration engineer.
READY TO SEE 98%+ DETECTION ON YOUR COIL
Send a Coil Sample. Get a Detection Read in 5 Days.
Ship coil-end samples with confirmed defects, or share 1,000+ images from your inspection archive. iFactory vision engineers return expected detection rates on your specific defect families, a 4-point camera architecture plan for your mill layout, and a 6–12 week deployment timeline — before you commit to a pilot.
5 days
Feasibility turnaround
6–12 wk
Pilot to production
On-prem
Data stays in your mill
9 mo
Typical payback timeline