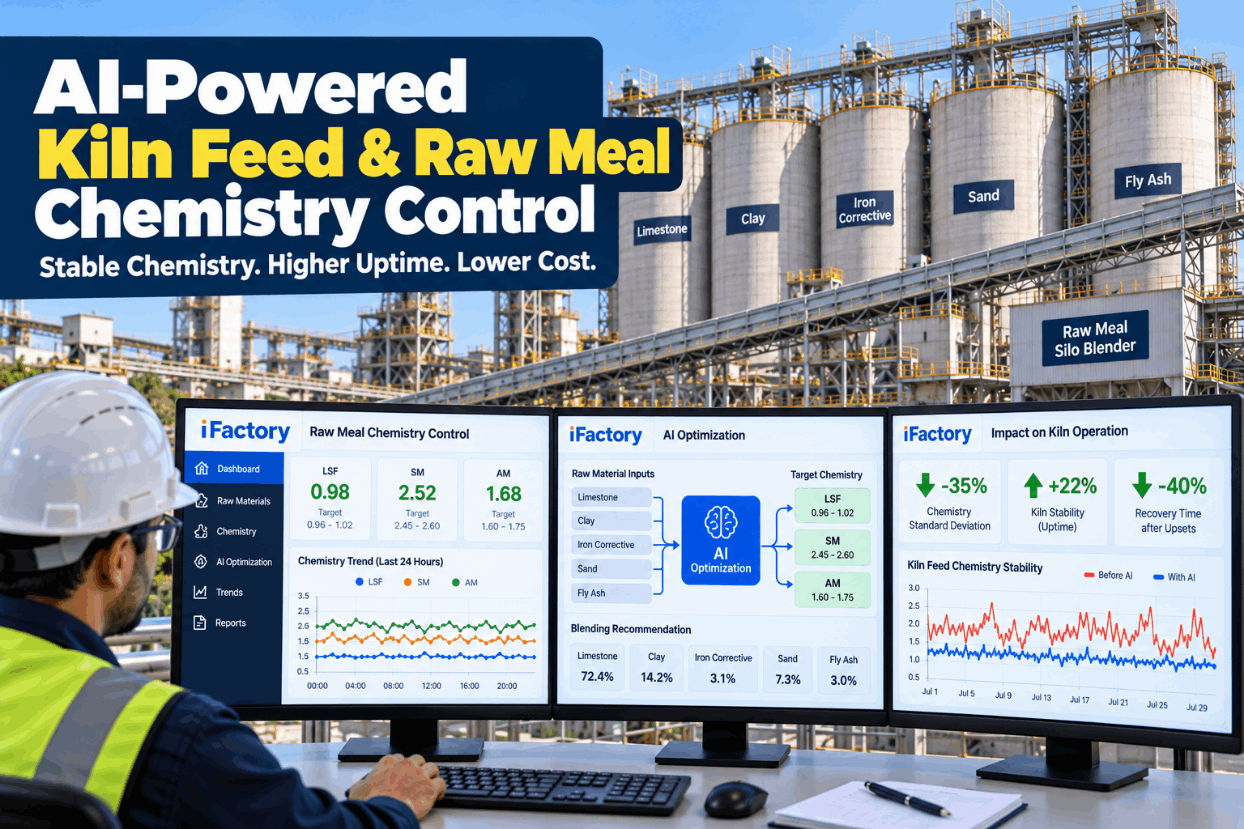
Kiln feed chemistry sets how hard the clinker is to burn long before the flame gets a say. When the lime saturation factor or the silica and alumina moduli swing from hour to hour, the kiln crew spends the shift chasing free lime, coating and fuel, and the cause is two or three hours upstream. Steady raw meal chemistry is a raw mill and blending silo job, measured by the analyzer and the lab together. See how that chain looks in a short raw meal chemistry demo.
Hold Kiln Feed LSF, SM and AM Steady Before the Kiln Feels the Swing
iFactory AI Optimization reads the cross-belt analyzer, the lab XRF and the blending silo as one chain. It suggests raw mill feeder corrections, tracks the hourly spread of each ratio in kiln feed and warns the shift when a chemistry swing is on its way to the kiln.
Three Ratios That Describe Kiln Feed Chemistry
Cement chemists compress the four main oxides into three ratios. LSF compares the lime present with the lime the silica, alumina and iron can combine with. The silica modulus sets how much melt forms, and the alumina modulus sets what that melt is made of. Understanding Cement gives typical clinker ranges of LSF 92 to 98, silica ratio 2.0 to 3.0 and alumina ratio 1 to 4. Check your plant's targets with our process support team.
The 2.8, 1.18 and 0.65 form above is the one most plants quote, and some texts round 1.18 to 1.2. Other forms exist, including one with 1.65 and 0.35. The lab, the analyzer software and the AI model should all use the same version, or their LSF values will never agree.
One Kiln Feed Sample, Worked Through Step by Step
The oxide values below are illustrative, on an as-analysed raw meal basis. Because LSF, SM and AM are ratios, the loss on ignition cancels out, so the same ratios apply to the clinker the meal will make, apart from any coal ash or dust effects. Run the same sum on your own lab data in a chemistry walkthrough.
So in this example, about 0.4 points more CaO in the meal moves LSF from 95.5 to 96.4. That shows how small a shift in limestone proportion, or in the limestone's own quality, can move kiln feed across a target band.
Two Measurement Loops With Different Jobs
A cross-belt analyzer and the lab XRF are partners, not rivals. Thermo Fisher describes its PGNAA analyzers as measuring the whole stream on the belt with a new result about every minute, while a lab X-ray loop takes roughly 30 to 60 minutes on small, intermittent samples. The analyzer steers the feeders. The lab keeps the analyzer honest. Plan the link between them with our analyzer support team.
How Much Is the Blending Silo Really Smoothing?
The homogenization factor H compares the spread of a ratio going into the silo with the spread coming out. A common form removes the analysis error, so the lab's own scatter is not credited to the silo. Fuller's CF silo literature says an H of 5:1 to 10:1 is usually needed to reach less than 1% LSF inhomogeneity. The numbers here are assumed. Measure your own silo in a silo performance review.
If the meal entering the silo is already steady, H will look poor even when the silo works well, because there is little to smooth. Practitioners on CemNet suggest judging silo efficiency only when the inlet spread is large enough, and treating an H near 1 as almost no blending.
Ask Where the Swing Started, Hear the Answer in Seconds
iFactory AI Optimization answers spoken questions from the lab or control room, using analyzer, XRF and silo data together, and repeats the request back before it logs a feeder correction for the operator to approve.
Kiln Feed Numbers Worth Watching Every Shift
The average LSF can sit on target all day while the hourly spread hurts the kiln. Fuller's silo literature links kiln feed inhomogeneity to kiln stability, refractory life and cement quality, and says that below about 1% LSF, further smoothing brings no extra benefit. That makes the spread, not just the mean, the number to watch. Ask our support team which of these your data can already show.
When a Chemistry Swing Is Already on Its Way
A pile change, a feeder blockage or a new quarry face can push off-target meal into the silo. The silo softens it but does not erase it. The chemistry side of recovery is to find the cause, estimate when the swing reaches the kiln and warn the kiln crew early, so they are not surprised. Walk through a recent upset with us in an upset review session.
Correcting From the Last Sample, or Watching the Whole Chain
Most plants already correct the mix. The difference is how much of the chain the correction can see. Sorrentino's paper on clinker chemistry notes that a high LSF and silica ratio are not favourable to burnability, so a swing upward is felt directly in the burning zone. Compare both ways of working with our process engineers.
- Feeder moves based on a result up to an hour old
- Silo treated as a black box between mill and kiln
- Kiln crew learns of a swing from free lime
- Analyzer drift noticed when results stop matching
- Feeder suggestions from minute data, checked by the lab
- Silo H and arrival time tracked every shift
- Kiln crew warned before the meal arrives
- Analyzer bias flagged while it is still small
A Chemistry Excursion Record for Every Swing
Each excursion teaches something about the quarry, the piles or the mill. Writing it down the same way every time turns one-off fixes into patterns the team can act on. Set up the record in your own system during a raw mix review call.
Chemistry Models, Analyzer Links and Edge Server in One Delivery
iFactory delivers AI Optimization and Process Analytics for raw meal as one package. A pre-configured NVIDIA AI server ships racked and ready, with the chemistry models loaded, so analyzer, XRF and silo data stay on site. You rack it, plug in power and Ethernet, and the AI is live. To scope it for your raw mill and silo, contact our support engineers.
- Pre-configured NVIDIA AI edge server, racked and ready
- Links to the cross-belt analyzer and lab XRF results
- Weigh feeder and raw mill signals from the DCS
- Silo level, draw rate and H factor tracking
- Feeder correction suggestions with operator approval
- Voice queries for chemists and kiln operators
- 24×7 remote monitoring of models and hardware
Analyzer, XRF, feeder and silo data linked, LSF formula and bands agreed.
Suggestions logged but not used, compared with what the chemists did.
Suggestions sent to operators for approval, shift reports started.
AI Optimization and Process Analytics for Raw Meal
iFactory works with the analyzer, lab and blending system you already run, and adds the link between them. See the ratio watch on your own data in a short pilot call.
What Chemists and Plant Managers Ask About Kiln Feed Control
Feed the Kiln the Same Meal, Hour After Hour
Link the analyzer, the lab and the blending silo, track the spread of LSF, SM and AM in kiln feed, and warn the kiln crew before a swing arrives. The system ships turnkey and goes live in 6 to 12 weeks.