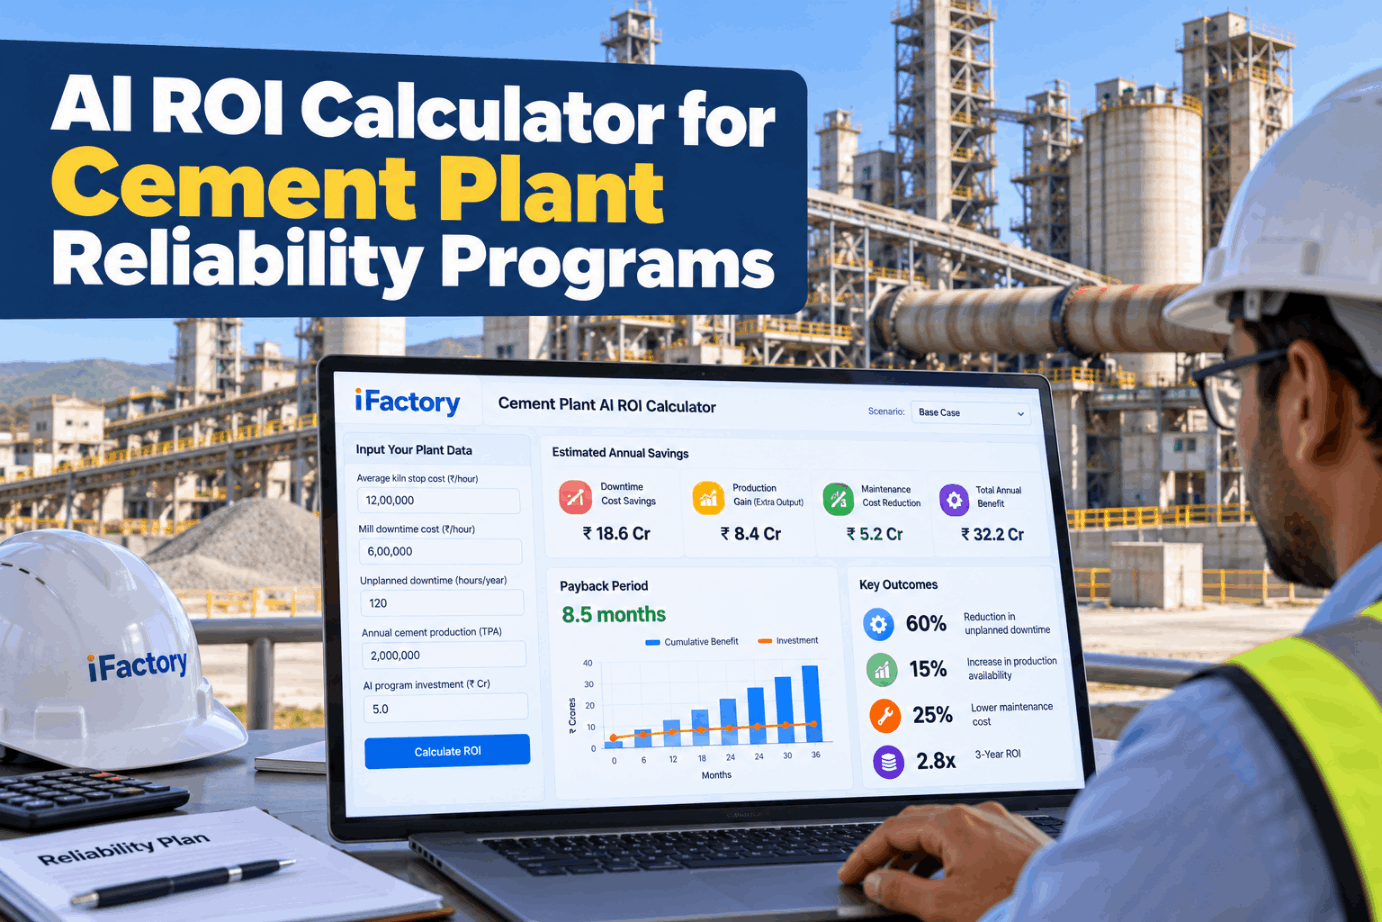
AI ROI Calculator for Cement Plant Reliability Programs

By Josh Brook on October 28, 2026

ai-roi-calculator-cement-plant-reliability

An unplanned kiln stop rarely costs what the downtime log says. Before a finance team signs off on reliability AI, it needs a plain view of where the money goes: clinker not made, fuel burned to reheat, hours spent ramping back to rate, and stress on the lining. This page builds that figure phase by phase from assumed inputs you replace with your own, then turns it into payback, NPV and a one-page board summary. To run the numbers with your kiln data, book a short session.

AI ANALYTICS · ROI MODELING FOR CEMENT

Put a Defensible Price on Every Unplanned Kiln Stop

iFactory AI Analytics links your stop log, kiln rate and cost inputs into one ROI model. Move any assumption and the annual value moves with it, so the CFO can test each number instead of taking it on trust.

Kiln stop cost per hourassumed$12,500
Unplanned kiln stop hours a yearassumed96 h
Share avoidableassumed30%
Annual value at risk $360,000 $12,500 × 96 h × 30%
CEMENT PLANT AI KILN STOP COST

Five Phases Inside One Unplanned Kiln Stop

Most stop logs record the minutes between trip and feed-on. The cost runs longer than that. A kiln that trips has to be held, reheated before feed goes back in, brought up to rate through hours of unstable running, and then lives with whatever the temperature swing did to the coating and bricks. Each phase has its own cost driver, so price them separately. Our support team can map these phases to the tags in your DCS.

1Trip and holdNo clinker while the fault is found and fixed. Priced at lost tonnes per hour
2ReheatBurner on, no feed. Fuel and power are spent before any product is made
3Ramp to rateFeed returns in steps. Output runs below target and clinker quality can wander
4Lining after-effectsThermal cycling stresses refractory and can strip coating in patches
5Repair premiumCall-outs, overtime and parts bought in a hurry rather than to plan
Why phase 4 belongs in the model

Refractory specialists describe thermal cycling from stops and restarts as harder on the lining than steady high-temperature running. Short stops add up across a campaign. Put a per-stop allowance in the model rather than ignoring it, and agree the figure with your refractory supplier.

WORKED KILN STOP

One 12-Hour Stop Priced Phase by Phase

Here is a single illustrative stop on a 4,800 tpd kiln, which makes 200 tonnes of clinker an hour. Every input is assumed and labelled. The result gives the hourly figure that the hero slider uses, so the whole page runs on one chain of arithmetic. Swap in your own figures in a working session.

Trip and hold: 12 h × 200 t/h × $40 margin per tonne, assumed$96,000
Reheat fuel and power before feed-on, assumed per stop$12,000
Ramp to rate: 6 h at half rate = 600 t × $40, assumed$24,000
Lining and coating allowance, assumed per stop$12,000
Repair premium over planned work, assumed$6,000
Cost of this stop$150,000
Cost per stop hour: $150,000 ÷ 12 h$12,500
Value lost clinker honestly

Use contribution margin only if the plant is sold out and every tonne lost is a sale lost. If clinker stock covers the gap, value it at the cost of buying or making it later. If neither applies, the two lost-clinker lines, hold and ramp, may be close to zero, and the case rests on fuel, lining and repair.

KILN SIZE AND SCALE

Kiln Size Sets the Scale of Every Number

The same 12-hour stop means very different tonnage on different lines. The EU reference document for cement BAT describes a typical kiln as around 3,000 tonnes of clinker a day, and suppliers have built single kiln systems of 12,000 tonnes a day. Start from your own rated output, not a benchmark. Ask our support team how to pull actual hourly rates from your historian.

Kiln size
Clinker per hour
Clinker lost in a 12-hour stop
How to read it
3,000 tpd
125 t/h
1,500 t
Close to the typical size cited by the EU reference
4,800 tpd
200 t/h
2,400 t
Size used in this page's example
7,200 tpd
300 t/h
3,600 t
Large modern line, illustration only
12,000 tpd
500 t/h
6,000 t
Among the largest single kiln systems built
CEMENT PLANT AI MILL DOWNTIME COST

Mill Stops Cost Little or a Lot, Depending on the Silos

A cement mill stop is priced very differently from a kiln stop. When clinker stock and cement silo space are healthy and the mill has spare hours in the week, lost grinding can be caught up later, often at the cost of extra power and overtime. When silos are low and the mill is already the bottleneck, every hour down is cement not shipped. Check which case applies before you count it, and see how the model handles both in a live walkthrough.

Buffered: silos have room, mill has spare hours
  • 10-hour stop on a 150 t/h mill, assumed
  • Lost sales: none, the tonnes are ground later
  • Cost: repair plus catch-up running, $8,000 assumed
  • Count it under repair cost, not lost margin
Unbuffered: silos low, mill is the bottleneck
  • Same 10-hour stop: 1,500 t of cement not ground
  • At $30 margin per tonne, assumed: $45,000
  • Plus repair: $8,000. Stop total: $53,000
  • Hourly lost sales: 150 t × $30 = $4,500
The same logic works for the kiln

A full clinker yard lets the cement mills keep grinding through a kiln stop, so shipments may not suffer. In that case the kiln stop cost is mostly fuel, ramp-up and lining, not lost cement sales.

Let Finance Question Every Input

iFactory AI Analytics keeps each assumption visible and linked to its source: the stop log, the kiln rate, your margin and your fuel price. When the CFO challenges a number, change it and the whole model follows.

Business case review · CFO and iFactory
CFOWhy is lost clinker valued at margin? We had stock in the yard most of last year.
iFactoryAgreed. With stock on hand, both lost-clinker lines, hold and ramp, fall to zero for those stops. Those stops fall to $2,500 per stop hour.
CFOAnd the lining allowance?
iFactoryHeld at $12,000 per stop until your refractory supplier gives a figure. It is flagged as assumed on the board page.
CEMENT PLANT AI RELIABILITY SAVINGS

Six Savings Lines, Graded by the Evidence Behind Them

Reliability AI can save money in several places, but the evidence for each is not equally firm. Grade every line before it goes into the case. Hard lines come straight from your own records. Firm lines need one agreed assumption. Soft lines are real but hard to prove, so keep them as notes rather than totals. Our support team can help you grade them.

HardKiln stop hours avoidedFrom your stop log, priced with the phase model above
HardMill lost sales avoidedOnly for stops in the unbuffered case
FirmRepair premium avoidedGap between emergency and planned cost, from past invoices
FirmRestart fuel savedFewer reheats, priced at your fuel cost per stop
SoftLonger lining campaignsFewer thermal cycles. Agree any value with your refractory supplier
SoftSmaller spare-parts stockEarlier warnings may allow leaner stock. Keep out of year-one totals
CEMENT PLANT AI VALUE CASE

How the Annual Figure Moves With the Avoidable Share

The share of stop hours a reliability program can avoid is the most uncertain input, so show the board how much it matters. With the example's $12,500 per stop hour and 96 stop hours a year, the annual figure scales directly with that share. Review your own stop causes with our team in a stop-log review.

Annual kiln value at four avoidable shares$12,500 × 96 h = $1,200,000 a year in stop cost
10% avoidable$120,000
20% avoidable$240,000
30% avoidable$360,000
40% avoidable$480,000
Ground the share in your stop causes: count only stops with a mechanical or electrical cause that gave a warning signal before it tripped.
CEMENT PLANT AI CFO VIEW

Payback and NPV From the Same Inputs

Payback tells the board how quickly the money comes back. Net present value tells it what the program is worth today after the time value of money. Both use the same inputs. Here, the annual benefit adds the kiln figure to the mill figure: 30 unbuffered mill hours a year at $4,500, with 30% avoidable. Investment and running costs are assumed placeholders until you have a quote, which our team can provide.

Kiln value: $12,500 × 96 h × 30%$360,000
Mill value: $4,500 × 30 h × 30%$40,500
Annual running cost, assumed−$60,000
Net annual benefit$340,500
Upfront investment, assumed$300,000
Payback: $300,000 ÷ $340,500 × 1210.6 months
Present value, 3 years at 8% assumed: $315,278 + $291,924 + $270,300$877,502
NPV: $877,502 − $300,000$577,502

Use your company's own discount rate and evaluation period. If the case only works at the high end of the avoidable share, say so on the board page rather than hiding it.

CEMENT PLANT AI BOARD SUMMARY

A One-Page Summary the Board Can Read in Two Minutes

Boards approve cases they can follow. Keep the summary to one page, show where every number comes from and state the biggest uncertainty plainly. The fields below follow the worked example. Fill them from your own model, or have iFactory produce the page from your data in a short demo.

Decision askedApprove a reliability AI program on Kiln 1 and both cement mills
Problem in one line96 unplanned kiln stop hours last year at about $12,500 each
Source of the stop hoursDCS stop log, 12 months, causes coded by maintenance
Annual net benefit$340,500, base case
Payback and NPV10.6 months · $577,502 over 3 years at 8%
Biggest uncertaintyAvoidable share, 30% assumed. At 10% it is $120,000 a year
Lines left outLining life and spare-parts stock, graded soft
How we will check itStop hours and causes reviewed quarterly against the baseline
TURNKEY AI DEPLOYMENT

A Fixed-Scope Server That Firms Up the Cost Line

A business case is only as firm as its investment line. iFactory ships a pre-configured NVIDIA AI server, racked and ready, with analytics and ROI models pre-loaded and your kiln and mill tags mapped during setup. You rack it, plug in power and Ethernet, and the AI is live. Data stays on site, and the scope is fixed up front. Ask our support team for a turnkey quote.

What's Included
  • Pre-configured NVIDIA AI server, racked and ready
  • Links to DCS, historian and stop log
  • Failure models for kiln drive, fans and mills
  • ROI model with every assumption editable
  • Board summary built from live plant data
  • Operator and engineer training
  • 24×7 remote monitoring of models and hardware
Live in 6–12 weeks
Wk 1–4
Ship, Connect and Baseline

Server installed, data links made, 12 months of stop history loaded and coded.

Wk 5–8
Train and Pilot

Models trained on your assets and run alongside the team. ROI inputs agreed with finance.

Wk 9–12
Go-Live and Review

Alerts switched on, staff trained, first quarterly stop review scheduled.

HOW iFACTORY FITS

Cement Plant AI ROI Calculator Software With the Plant Data Behind It

iFactory combines reliability analytics with the ROI model, so the value case is rebuilt from real stop data every quarter instead of written once and forgotten. See it in a 30-minute demo.

1
Prices each stop in phases. Hold, reheat, ramp, lining and repair are costed separately from your tags and inputs.
2
Knows when silos cushion a stop. Clinker and cement stock levels decide whether lost hours are lost sales.
3
Keeps assumptions in the open. Every input is labelled, sourced and editable by finance.
4
Tracks the case after approval. Quarterly stop reviews compare actual hours with the baseline.
1000+
Industrial clients running iFactory
99.9%
Platform uptime for continuous kiln lines
6-12 wks
From racked server to a live value model
FREQUENTLY ASKED QUESTIONS

What Cement CFOs and Plant Managers Ask About AI ROI

What does an unplanned kiln stop really cost?
It depends on your kiln size, margin, fuel price and stock position, which is why this page uses assumed inputs. Price five phases separately: trip and hold, reheat, ramp to rate, lining after-effects and repair premium. In the worked example, a 12-hour stop on a 4,800 tpd kiln comes to $150,000, or $12,500 per stop hour.
Should lost clinker always be valued at margin?
No. Use margin only if the plant is sold out and lost tonnes are lost sales. If clinker stock covers the gap, value it at the cost of making or buying it later. Applying margin when stock is available is the most common way business cases get overstated. You can walk through your stock position with us to set the right rule.
How do we estimate the avoidable share?
Go through a year of stop causes. Count stops with a mechanical or electrical cause that showed a warning signal beforehand, such as vibration, temperature or current. Leave out process upsets, power cuts and planned work. Then show the board the annual figure at several shares, as on this page.
Which discount rate should the NPV use?
Use the rate your finance team applies to other capital projects. The example uses an assumed 8% over three years only to show the arithmetic. If your company uses a hurdle rate or a longer period, change both and recalculate. Our support team can set the model to your finance rules.
Can the model include mill downtime?
Yes, but split it into two cases. When silos have room and the mill has spare hours, a stop mostly costs repair and catch-up running. When silos are low and the mill is the bottleneck, lost hours are lost sales. Only the second case belongs on the lost-margin line. To see both cases handled from live silo levels, see it on your own data.
How do we start building the case?
Export twelve months of kiln and mill stop records with causes, agree the five phase costs with finance and maintenance, and grade every savings line before adding it up. Then fill in the one-page board summary. To build it with our team, book a 30-minute demo.

Take a Board-Ready Kiln Case to Your Next Review

Bring your stop log and cost inputs. iFactory prices each kiln stop phase by phase, separates buffered from unbuffered mill time and gives you payback, NPV and a one-page summary built on your own data.
Example board page · Kiln 1
Cost per stop hour$12,500, phased
Stop hours a year96, from the stop log
Net annual benefit$340,500, base case
Payback10.6 months
Every input labelled and editable

Share This Story, Choose Your Platform!