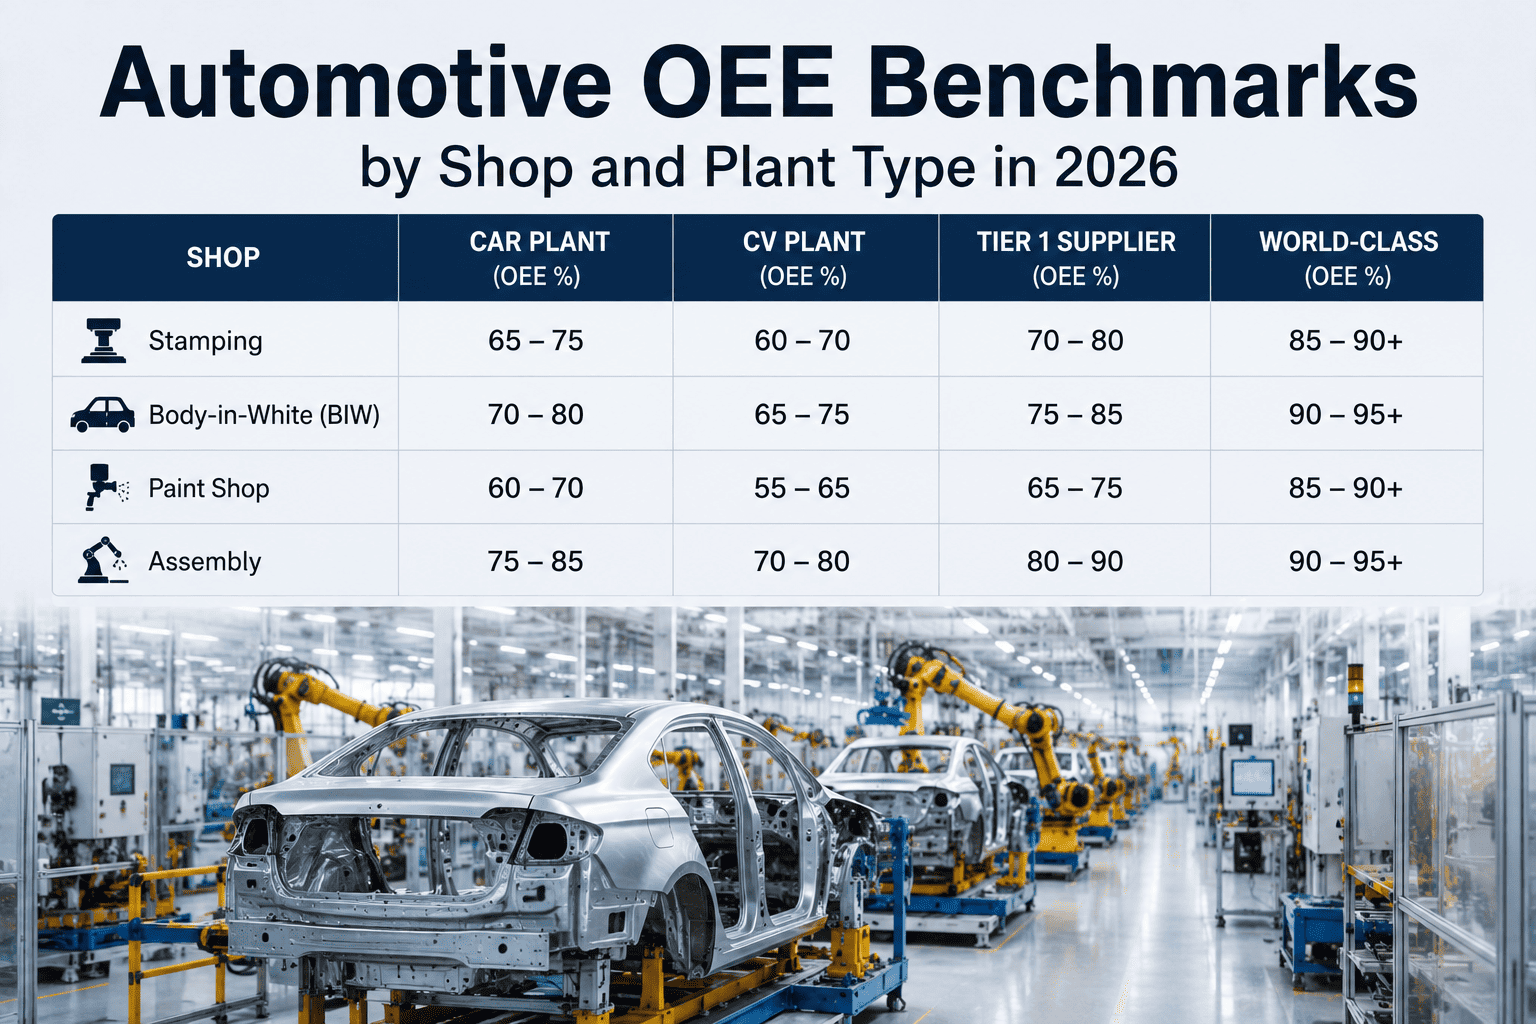
An automotive Tier 1 plant's OEE lives in one of two places. Either it lives on a 65-inch screen above the weld cell where operators, team leads, and the plant manager can all see the same number in real time — or it lives in an Excel spreadsheet on someone's laptop, updated the morning after the shift ended, discussed in a 9 AM production meeting, and forgotten by 10. The second version doesn't move OEE. The first version does. The best-in-class US automotive Tier 1 plants run at 80–85% OEE. The median runs at 60–65%. The bottom quartile — 45–55%. And the single most consistent difference between top and bottom is not equipment, headcount, or process. It's whether the shop floor can see the score. Ford, GM, Stellantis, Toyota North America, Honda — every OEM's 2026 supplier scorecard now systematically requests real-time OEE evidence, not monthly Excel reports. Plants with live OEE displays score 15–25% higher on operations dimensions. Stellantis identified $5.4M in previously invisible annual losses on eight lines through real-time measurement alone. A single platform de-listing costs a Tier 1 plant $20–100M in annual revenue. iFactory Plant Floor Live Scoreboards + Andon put the score on the wall — on-prem, AI-driven, and IATF 16949-aligned.
iFactory Plant Floor Scoreboards + Andon
Put the Score on the Wall — Live OEE, Output vs Target, Downtime Alerts Every Operator Sees
Large-screen shop floor displays with AI-driven OEE, real-time andon alerts, per-shift performance, and Six Big Losses breakdown. On-prem AI, no cloud dependency. IATF 16949 audit-ready.
$5.4M
Stellantis losses found
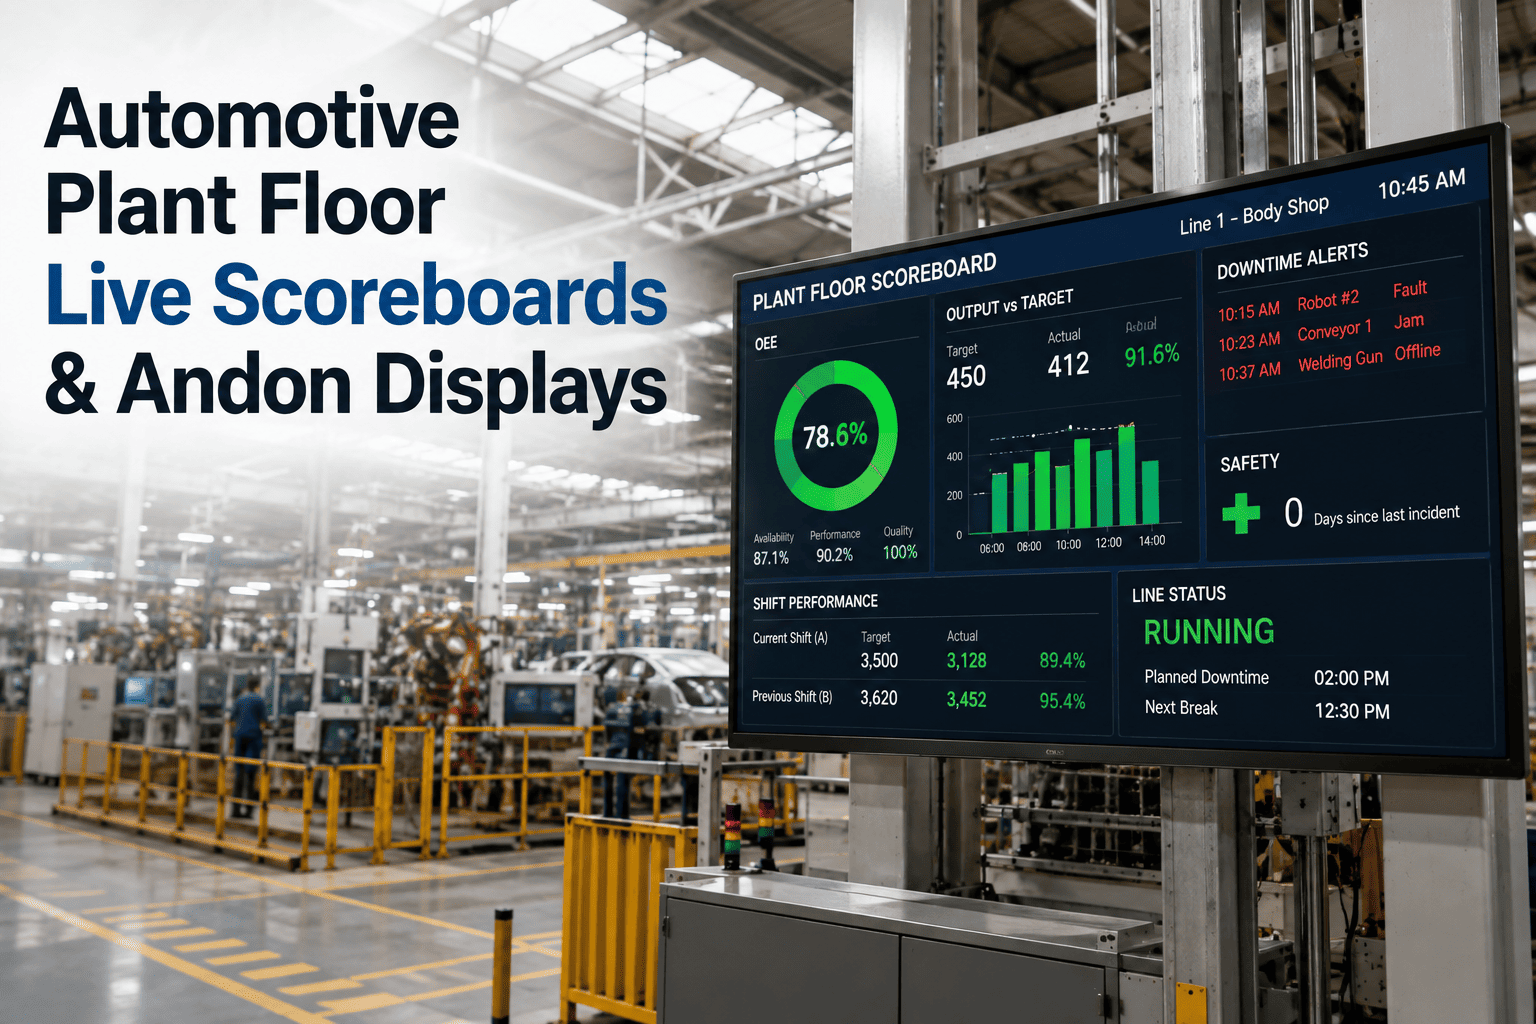
The Scoreboard Mockup — What Operators Actually See
This is the anatomy of a live scoreboard mounted at a weld cell or assembly line. Every number updates in real time. Every color has meaning. When operators can see their score, they run to catch it.
Live OEE
78.4%
Target 82.0%
Availability
92.1%
above target
Performance
86.7%
below target
Andon Alert
Station 06 · slow cycle detected · 47s over ideal · 4 consecutive parts
Top Losses This Shift
Micro-stops Station 06
18 min
Material feed delay
10 min
Weld quality reject
5 min
Where the OEE Gap Actually Hides — The Six Big Losses
OEE is one number. But it's built from six loss categories, and the losses that quietly kill Tier 1 productivity are usually the ones nobody's tracking in real time. Traditional physical andon and shift-end log sheets underreport every one of these. Live scoreboards catch all six as they happen.
Availability
Unplanned Stops
Equipment breakdowns, tooling failures, jam-ups. Traditionally logged after the fact; live scoreboards capture start and end automatically.
Availability
Planned Stops
Changeovers, meal breaks, tool changes. Duration variance vs plan is where changeover overrun losses hide.
Performance
Small Stops
Micro-stops under 5 minutes. Never make it into shift reports. Represent 20–40% of hidden losses in most Tier 1 plants.
Performance
Slow Cycles
Cycle time drift below ideal — invisible until the shift target is missed. Cycle sensors + scoreboard catch it in the moment.
Quality
Production Rejects
Defects during steady-state run. Rolled up to PPM for OEM scorecards; live capture eliminates transcription errors.
Quality
Startup Rejects
Defects during warm-up or post-changeover. Isolating this loss reveals the real changeover cost.
Traditional Andon vs iFactory Digital Andon
The physical andon cord — an operator sees a problem, pulls the light, a team lead comes over — has been the automotive gold standard for decades. Digital andon doesn't replace the discipline. It replaces the dependence on human perception and reaction time with data-driven detection that fires before an operator would even notice the drift.
Traditional physical andon
Operator-triggered, reactive
Depends on operator perception and willingness to pull the cord
Micro-stops and slow cycles never trigger a signal
Escalation delay while operator finds a supervisor
No historical data — the light goes off, the record ends
OEM auditors see reactive tooling, not measurement
iFactory Digital Andon
Data-triggered, proactive
Cycle sensors detect slow cycles and small stops automatically
Configurable thresholds — no more underreporting
Auto-escalation to supervisor via floor screen, mobile, and comms
Every event logged with duration, reason, resolver, and impact
OEM auditors see live dashboards, not shift-end summaries
Curious what a live scoreboard would show on your bottleneck line right now? Book a demo — we'll walk through your current shift data on the display format your operators would use.
The OEM Scorecard Play — Why This Directly Wins Business
OEM supplier scorecards in 2026 don't ask for OEE as a nice-to-have. They ask for it as evidence. Plants with real-time measurement systematically outscore plants running monthly Excel — and the score directly affects future platform awards.
Real-time OEE dashboards
Auditors expect to see live displays on the plant floor — not monthly reports pulled up on a laptop for the audit.
Downtime Pareto by line, product, shift
6–12 month trend evidence. iFactory auto-generates Pareto reports with the granularity auditors expect.
Systematic improvement evidence
Kaizen loop tied to top 5 losses. Auditors look for the connection between measurement and action, not just data.
Capacity forecast accuracy
How well the plant's stated capacity matches actual delivery. Live OEE feeds accurate forecasting straight to the OEM.
Cross-functional accountability
Top-quartile plants share OEE across production, maintenance, quality, engineering. Same scoreboard, same score, same daily review.
The Stellantis Case — What $5.4M Looks Like Hidden
A public case study every Tier 1 leader should read. Stellantis deployed real-time OEE measurement on 8 production lines. Nothing about the equipment changed. Nothing about the process changed. What changed was that losses previously invisible in shift-end estimates became visible in the moment. The result: €4.8M — about $5.4M — in annual losses identified.
Availability loss
Undocumented changeover overruns
Planned 45-minute changeovers routinely running 62–68 minutes. Never logged as loss. Live capture surfaced the pattern.
Performance loss
Hidden micro-stoppages
2–4 minute stops throughout the shift. Individually invisible. Aggregated: 40+ minutes of lost run time per shift per line.
Quality loss
Unrecorded quality rejects
Rejects reworked at station without being logged. Live counter captured every one. Actual reject rate 2.3x reported.
The On-Prem AI Deployment — Why It Matters for Automotive
Automotive IP is sensitive. Weld cycle data, cycle-time signatures, and defect patterns are the operational fingerprint of a plant. iFactory runs on-prem — a pre-configured NVIDIA AI server delivered racked and cabled — so no data leaves the plant unless you route it out deliberately. And no cloud latency means the scoreboard is truly live, not "live-ish."
Phase 1 — Weeks 1-3
Install & Integrate
NVIDIA AI server arrives racked, cabled, and pre-loaded. Site team plugs power and Ethernet. Cycle sensors and PLC integration on pilot line. Large-format displays mounted at agreed cell locations.
Phase 2 — Weeks 4-8
Baseline & Configure
AI learns line signatures — ideal cycle, changeover pattern, micro-stop baseline. Scoreboard layout finalized with operators. Andon thresholds set. Team leads and supervisors trained on the loss review workflow.
Phase 3 — Weeks 9-12
Live Scoreboards + Andon
Full digital andon running. Scoreboards live at pilot cells. Top losses ranked automatically. First quarter OEE gain measured. IATF 16949 audit evidence package finalized. Plant-wide rollout schedule locked.
What Tier 1 Plants See in the First Quarter
Automotive Tier 1 plants running iFactory Live Scoreboards + Andon typically report measurable outcomes inside a quarter. These are the numbers Ops and QA leaders use to justify the investment upward — and to defend line performance in OEM audits.
15-29%
Efficiency gain
on pilot lines
15-25%
OEM scorecard lift
operations dimension
On-prem
NVIDIA AI server
no cloud dependency
6-12
Week deployment
turnkey, racked, ready
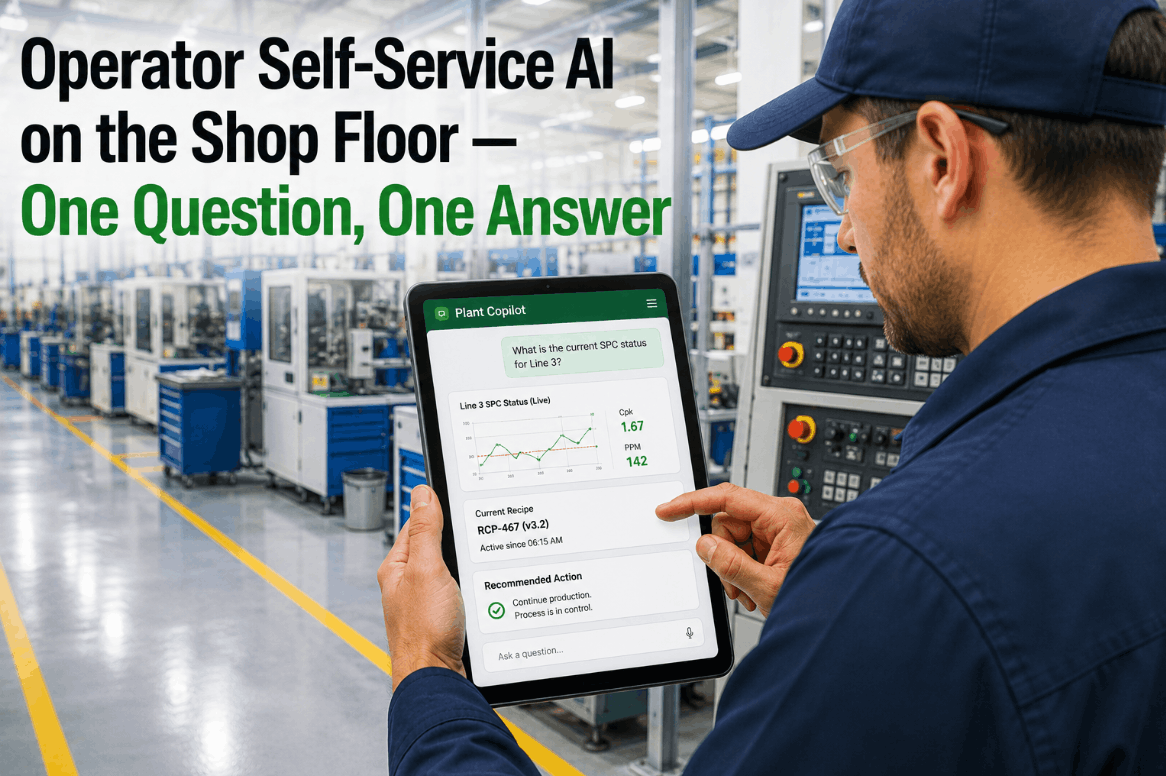
Ask the AI on the Plant Floor
Plant manager
Line A-14 is running below target again this shift. What's driving it?
iFactory AI
Line A-14 OEE at 78.4% vs 82.0% target. Primary loss is Station 06 — 18 minutes of micro-stops this shift, cycle time drifted 47 seconds over ideal. Pattern matches robot gripper drift from the last two shifts. Recommend gripper calibration at next planned stop.
Plant manager
Pull the OEE trend for the OEM audit next week.
iFactory AI
Generated 12-week trend for all A-lines with Six Big Losses Pareto, downtime by shift, and kaizen action-to-improvement mapping. Formatted to Ford, GM, and Stellantis scorecard requirements. Attached to your audit prep folder in the DMS.
Frequently Asked Questions
We already have OEE tracked in Excel. Why do we need scoreboards on the floor?
Excel OEE is retrospective — it shows what already happened. Live scoreboards make the current shift's score visible to the operators who can still affect it. That single change consistently drives 15–29% efficiency gain on pilot lines. It's also what OEM auditors now expect to see — Ford, GM, Stellantis, Toyota North America, and Honda all systematically request evidence of real-time measurement, not monthly reports. Excel doesn't score points on the scorecard anymore.
Do we need to replace our existing PLCs, sensors, or MES?
No. iFactory reads cycle data from existing PLCs across Rockwell, Siemens, Mitsubishi, Omron, and most other automation platforms. Additional cycle sensors can be added on constraints where PLC signals aren't clean — usually a small install per line. MES integration works with Ignition, Rockwell FTPS, Wonderware, SAP DM, and others. The scoreboards run on standard commercial displays we spec for the plant.
Why on-prem instead of cloud?
Two reasons. First, automotive plant data is sensitive — weld cycle times, defect patterns, and cycle signatures reveal process detail that OEMs and Tier 1 leadership prefer to keep on-site. Second, cloud latency breaks the "live" promise. On-prem NVIDIA AI processes cycle data in milliseconds, so the scoreboard is truly real-time — not "updates every 30 seconds." No data leaves the plant unless you deliberately route it out.
How does this help us in IATF 16949 and OEM audits?
Directly. Live OEE measurement satisfies process control audit requirements. Automatic downtime Pareto by line, product, and shift with 6-12 month trend is exactly what IATF and OEM auditors request. Kaizen actions linked to top 5 losses give auditors the systematic-improvement evidence they look for. The audit-prep report exports match Ford, GM, Stellantis, Toyota NA, and Honda scorecard formats.
Can we start on one line before rolling out plant-wide?
Yes — pilots are standard and recommended. Pick your worst-performing bottleneck line, or the line where an OEM has flagged concerns. We deploy scoreboards, cycle sensors, and digital andon in 12 weeks and produce hard per-line OEE gain numbers to justify plant-wide rollout. Each subsequent line takes 4–6 weeks because the AI, PLC integration library, and dashboard templates are already validated.
What about union or workforce concerns about visible tracking?
The scoreboard is line-level, not operator-level. The score measures the equipment and process, not individual performance. In practice, most plants find operators become the strongest advocates within weeks — the display gives them agency to catch issues in the shift, escalate through the digital andon, and win against a visible target. Plants that frame it as a team scoreboard rather than a surveillance tool see the fastest adoption.
The score matters. Put it on the wall.
See Live Scoreboards + Andon Running on Your Line
Pick your bottleneck line — the one where OEE is quietly costing you the most. In 12 weeks we'll deploy the scoreboard, cycle sensors, digital andon, and Six Big Losses breakdown, then measure the OEE gain against your baseline. On-prem NVIDIA AI. IATF 16949 aligned. Ford, GM, Stellantis, Toyota NA, and Honda audit-ready reports built in.