Every food plant has a few machines that fail again and again. The same tray sealer faults after every night clean, the same conveyor gearmotor gets noisy every few weeks, and the same pump seal is replaced so often nobody writes down why. Bad actor analysis finds these repeat failures in your work order history, ranks them by downtime, cost and repeat count, and turns the top ones into improvement actions that are checked until the fix holds. See it on real failure history in a short bad actor ranking demo.
Find the Machines That Keep Failing and Fix Them for Good
iFactory Reliability Analytics ranks bad actors by downtime and cost, drafts root cause hypotheses from work order text for your engineers to verify, and tracks each improvement on a reliability kanban until MTBF proves it worked.
Three Ways to Rank, Three Different Lists
A bad actor is an asset whose failures keep costing you output, money or both. One common method, described by Reliabilityweb, ranks assets in a Pareto by the cost of their failures, then ranks the failure modes inside the top assets by how often they occur. Ranking by downtime, cost and repeat count side by side shows more, because each measure points to a different problem. Talk through your own failure history with our reliability team.
A Worked Pareto by Downtime
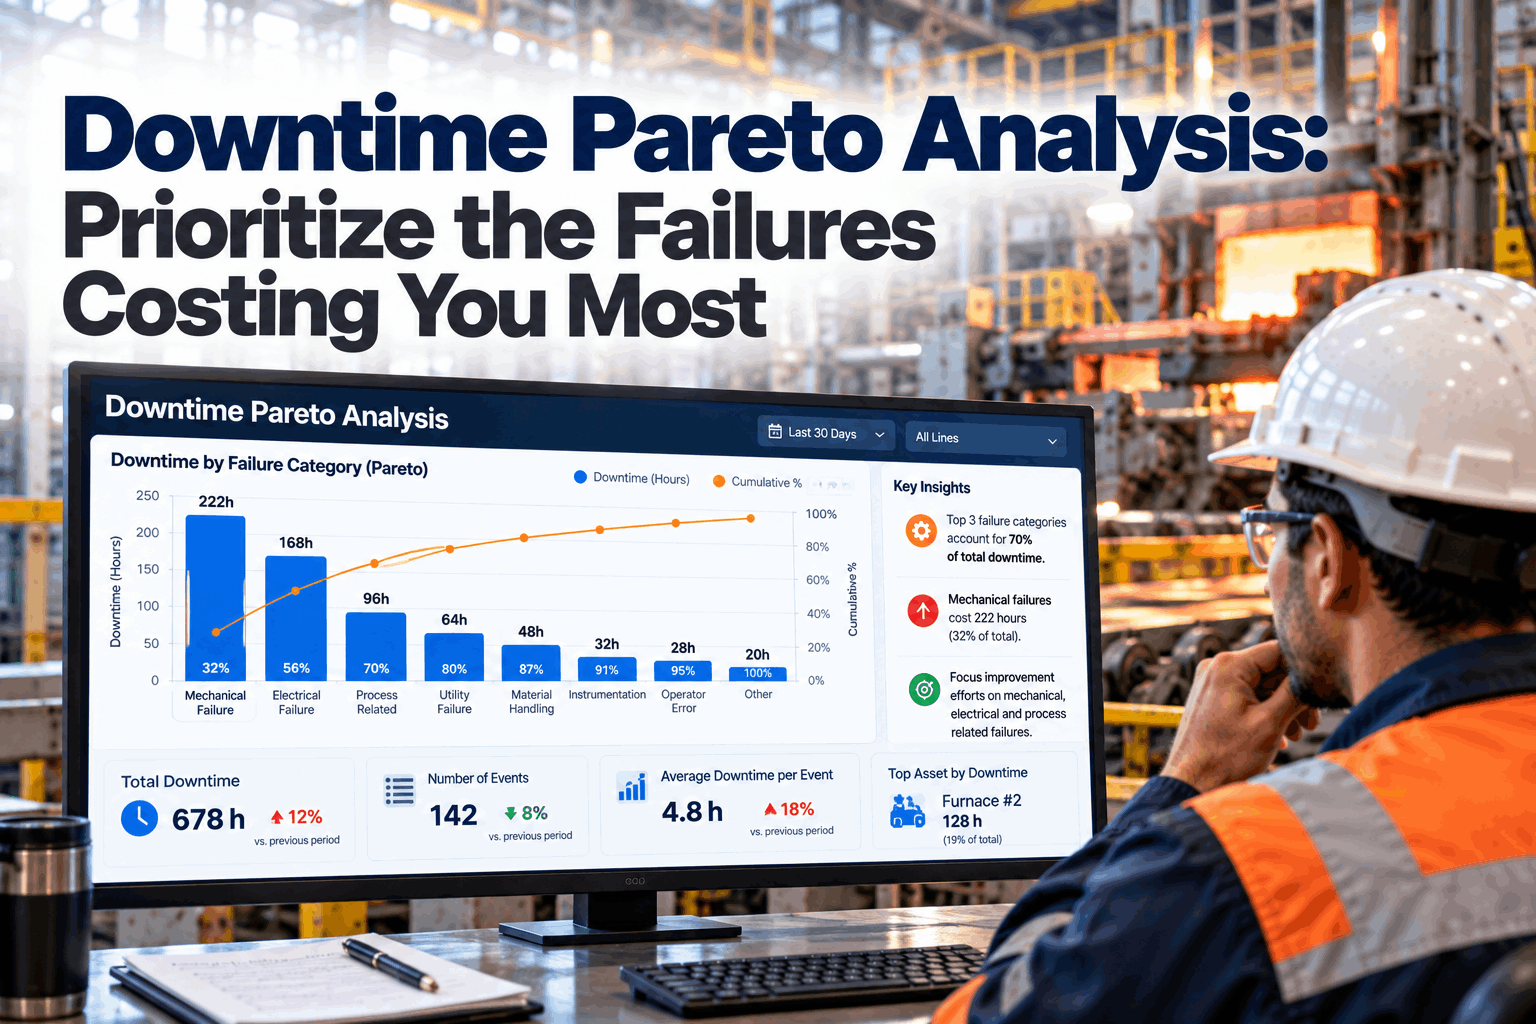
The example uses illustrative numbers for six assets over 12 months. Sort them by unplanned downtime, then add a running total as a share of all downtime. Here the top three assets give 71.5 of 97.5 hours, or 73.3%. Downtime often clusters like this, but the famous 80/20 split is a rule of thumb, not a measured law: ReliaMag found no published study of that ratio for equipment. Rank your own data. Walk through yours in a Pareto walkthrough.
Stop One Long Outage From Running the List
The spiral freezer tops the downtime Pareto, but 30 of its 34 hours came from a single event. That outage deserves its own root cause analysis, yet it says little about chronic failure. Normalise before you rank: cap each event at a set length, divide by operating hours where assets run different hours, or turn values into ranks. Keep the full hours in the record. The cap below is assumed. Agree your own rules with our support team.
One Combined Score From Three Measures
To combine the measures, put each on a 0 to 100 scale by dividing every value by the highest one, then average the three scores. This example uses equal weights and the capped downtime. Weights are a choice, so agree them before you see the result. This score finds chronic problems. Food safety risk belongs in your asset criticality ranking, which should decide priority when the two disagree. Test your weights in a ranking session.
Failures 14 ÷ 14 = 100. Downtime 21 ÷ 21 = 100. Cost 9,800 ÷ 18,000 = 54.4. Combined (100 + 100 + 54.4) ÷ 3 = 84.8. Combined values are averaged from the rounded scores shown. Failures total 53, cost totals $52,000.
A Ranking That Explains Itself
Ask iFactory why an asset sits where it does and it shows the numbers behind the score, the events it capped and the work orders it read. Your engineers decide what gets fixed first.
Make Failure Codes Good Enough to Rank
A ranking is only as good as the codes behind it. ISO 14224:2016 comes from the petroleum industry, but its structure works in any plant. It sets a nine-level taxonomy from industry down to part, and splits each failure into a mode, the "effect by which a failure is observed", a mechanism, the "physical, chemical or other process that leads to a failure", and a cause. Code at equipment unit (level 6) and maintainable item (level 8). Get a starter code list from our support team.
Every work order names the asset at equipment unit level. The failure mode comes from a short list, and "other" is rare. Downtime start and end times are filled in. Short lists beat long ones: too many codes confuse technicians, too few hide history.
Three Repeat Failure Patterns Food Plants Know Well
Food plants clean hard and often, and that shapes their failure history. Machine Design names the washdown threat simply: high pressure, hot water and caustic chemicals, with water in a sealed bearing that "deteriorates lubrication, corrodes raceways and rollers". The IP69K test sprays 80°C water at 80 to 100 bar from 10 to 15 cm, a useful bar for replacement parts. H1 lubricants are made for possible incidental contact, and 21 CFR 178.3570 caps listed substances at 10 ppm in food. Spot these patterns in a failure history review.
From Work Order Free Text to Root Cause Hypotheses
The best failure history is often in the free text, written fast by a technician at 3 a.m. iFactory reads every work order for one bad actor and drafts hypotheses, each with the evidence and the work orders behind it. These are hypotheses, not root causes. A reliability engineer must verify each one on the equipment, with data and with the people involved, before any fix is approved. See how review works with our reliability specialists.
- "Heater fault on start-up, reset, ran OK"
- "Jaw temp low, swapped thermocouple"
- "Seal rejects after san, dried connector"
- "Heater fault again, connector wet, replaced"
- Water reaches the heater connector during washdown. 9 of 14 faults were logged within an hour of sanitation.
- Thermocouple swaps treated a symptom. Faults continued after 4 swaps.
- Hose angle or pressure may have changed. Nothing in the records, so ask the sanitation lead.
Improvement Cards on a Reliability Kanban
A ranking is only useful if it leads to action. Each top bad actor gets an improvement card that moves across a reliability kanban, from ranked to verified. Keep a limit on cards in progress, so engineers finish fixes instead of starting new ones. A card closes only when the numbers show the failure has stopped, not when the work order is signed. Build your board in a kanban setup call.
Asset and failure mode, confirmed cause, the fix, owner, due date, MTBF before, and the date the after window ends.
Check the Fix Stuck With MTBF Before and After
Compare MTBF, operating hours divided by failures, for the same asset over equal windows before and after the fix. Reliabilityweb suggests a yearly check too: each past bad actor's failure cost should be lower than in the last analysis, and it should not keep failing from the same mode. Small counts are weak evidence, so keep the card in verifying until there is enough run time. The numbers below are illustrative. Review your own results with our support team.
Reliability Analytics, AI Models and Server in One Package
iFactory delivers Reliability Analytics as a turnkey system. A pre-configured NVIDIA AI server ships racked and ready, with the ranking engine and work order language models loaded, so your failure history is processed on site. You rack it, plug in power and Ethernet, and the AI is live. To scope it for your plant, request a turnkey quote.
- Pre-configured NVIDIA AI server, racked and ready
- Connector to your CMMS and work order history
- Failure code mapping to an ISO 14224 style list
- Bad actor ranking with your weights and caps
- AI hypothesis drafts from work order text
- Reliability kanban with improvement cards
- MTBF before and after tracking on every card
Work order history loaded, asset tags and failure codes mapped, coding gaps flagged.
First ranking and hypotheses reviewed with your engineers, weights and caps agreed.
Kanban live, monthly bad actor review started, MTBF tracking switched on.
Reliability Analytics Built for Food Plant Failure History
iFactory does the sorting, scoring and reading so your engineers can spend their time on the fixes. Our support team can plan a pilot on one line.
What Plant Managers Ask About Bad Actor Analysis
Stop Fixing the Same Failure Twice
Rank your bad actors, read every work order behind them and track each fix until MTBF proves it held. The full system is delivered turnkey and goes live in 6 to 12 weeks.