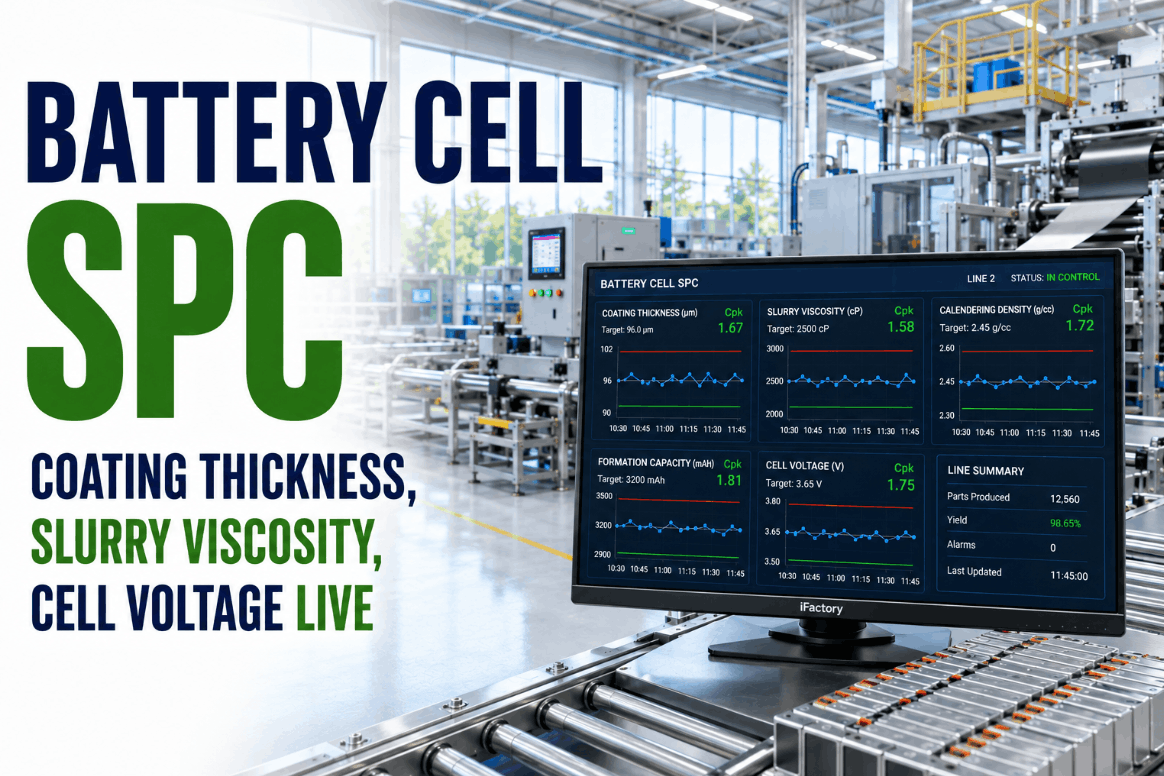
Battery cell manufacturing SPC is redefining quality control at gigafactories and EV battery production lines where thousands of critical parameters move simultaneously across coating, calendering, formation, and cell finishing operations. For Battery Cell Quality Leads, the gap between a 50 µm coating thickness deviation and a failed formation cycle can mean entire lots of cells outside specification — and in EV battery production, that translates directly to yield loss, warranty exposure, and capacity shortfalls. As the industry scales from pilot lines to multi-GWh volumes, teams that Book a Demo with iFactory are discovering that live SPC across coating, slurry viscosity, calendering, and formation data is the single most effective lever for driving Cpk above 1.33 on every critical cell parameter.
Live SPC for Coating Thickness, Slurry Viscosity, Calendering, Formation & Cell Voltage
iFactory streams every critical battery cell parameter into real-time SPC — with live Cpk tracking, automated out-of-control alerts, and full process traceability across your entire cell manufacturing line.
Why Battery Cell Lines Demand Real-Time SPC Across Every Process Stage
Modern battery cell manufacturing runs at a speed and complexity that traditional quality systems were never designed to handle. A single gigafactory coating line can produce hundreds of meters of electrode per minute, with coating thickness tolerance windows measured in single-digit microns. Slurry viscosity upstream determines coating uniformity downstream. Calendering density affects electrolyte uptake and internal resistance. Formation protocol precision governs initial SEI layer quality and long-term cycle life. In this environment, end-of-line testing catches defects too late — after energy, materials, and capacity have already been consumed. Teams evaluating real-time process control frequently Book a Demo to understand how iFactory's battery cell connector maps each process stage into live SPC with Cpk calculated continuously, not retrospectively.
iFactory's platform integrates directly with coating machines, calendering presses, formation cyclers, and inline metrology systems to stream every critical measurement into a unified SPC engine. This gives Quality Leads a real-time view of process stability across the entire cell manufacturing line — from slurry mixing through to cell voltage at end-of-formation — with automated Western Electric Rule alerts that flag instability before it propagates into finished inventory.
Coating Thickness Drift
Micron-level deviations in anode or cathode coating thickness directly impact energy density and capacity uniformity. Live SPC detects systematic drift before it shifts the process mean outside specification limits.
Slurry Viscosity Variation
Viscosity excursions upstream cause coating weight nonuniformity and edge bead defects. Real-time Cpk tracking on slurry lines gives mixers actionable signals before coating begins.
Calendering Density Control
Electrode compaction directly governs porosity and electrolyte uptake. SPC on calender roll gap and electrode thickness ensures consistent electrode density across every roll.
Formation & Cell Voltage
Formation protocol deviations create inconsistent SEI layers and early capacity fade. Live SPC on cell voltage at end-of-formation catches abnormal cells before they enter the finished cell pool.
"Running a high-volume pouch cell line means our coating and calendering parameters need to stay within specification continuously — not just at shift-end sampling. Before iFactory, our Quality team was reacting to SPC data that was already 30 minutes old. With live streaming SPC across coating thickness and formation voltage, we cut our Cpk reporting lag to under two minutes and reduced cell sorting yield loss by 22% in the first quarter. This is what gigafactory-scale quality control actually looks like."
Critical Parameters Monitored in Live SPC Across the Cell Line
Effective battery cell SPC requires complete parameter coverage — from slurry through finished cell — with control charts and Cpk indices calculated in real time for every critical measurement. iFactory's battery cell connector streams each of the parameters below into the SPC engine continuously, with configurable control limits aligned to your product specifications and process capability targets. Book a Demo to review the full parameter library for your cell chemistry and format.
| Process Stage | Key Parameter | SPC Chart Type | Cpk Target | Failure Impact |
|---|---|---|---|---|
| Slurry Mixing | Viscosity (cP) | Xbar-R / Individuals | ≥ 1.33 | Coating weight nonuniformity |
| Electrode Coating | Coating Thickness (µm) | Xbar-R | ≥ 1.33 | Capacity & energy density loss |
| Electrode Coating | Coating Weight (mg/cm²) | Xbar-S | ≥ 1.25 | Cell-to-cell capacity variance |
| Drying / Solvent | Residual Moisture (ppm) | Individuals / MR | ≥ 1.00 | SEI degradation, gassing |
| Calendering | Electrode Thickness (µm) | Xbar-R | ≥ 1.33 | Porosity & electrolyte uptake |
| Calendering | Compaction Density (g/cc) | Xbar-S | ≥ 1.25 | Internal resistance increase |
| Formation | Cell Voltage at EOC (V) | Individuals | ≥ 1.33 | Early capacity fade, sorting loss |
| Formation | Charge Capacity (mAh) | Xbar-R | ≥ 1.33 | Pack-level balancing failure |
How iFactory's Battery Cell SPC Engine Is Structured
iFactory's battery cell SPC platform is built around four interconnected modules that cover the full electrode and cell manufacturing process. Each module streams live data into the central SPC engine, enabling Quality Leads to monitor process stability across every stage from a single dashboard — with full drill-down to individual control charts, Cpk trends, and out-of-control event histories.
Slurry & Coating SPC
Direct integration with mixing and coating equipment streams viscosity, solid content, coating weight, and thickness data into live Xbar-R and individuals charts. Automated alerts trigger on Cpk degradation or Western Electric Rule violations before the coating run continues to downstream processing.
Drying & Solvent Control
Residual moisture monitoring across drying zones with SPC on oven temperature profiles and outlet moisture levels. Early detection of drying excursions prevents moisture-induced SEI layer degradation and formation gassing events that are costly to recover from downstream.
Calendering Process SPC
Roll gap, nip pressure, electrode thickness, and compaction density are monitored per-roll with continuous Cpk calculation. Process capability trending across calender campaigns identifies roll wear patterns and flags the need for roll grinding before density variability propagates into finished electrode inventory.
Formation & Cell Voltage SPC
Formation protocol data streams from cyclers in real time — charge capacity, end-of-charge voltage, internal resistance (DC-IR), and self-discharge are all plotted in live SPC. Abnormal cells are automatically flagged for sorting before entering finished cell inventory, reducing downstream pack assembly yield loss.
Measurable Quality and Yield Gains on Battery Cell Lines
Battery cell manufacturers using iFactory's live SPC platform report consistent improvements across yield, Cpk performance, and quality event response time. The metrics below reflect outcomes across EV cell production sites within 90 days of full SPC deployment across coating, calendering, and formation stages. Reliability and quality leads building the business case for gigafactory SPC frequently Book a Demo to review iFactory's ROI model for their specific cell format and line speed.
Battery Cell Manufacturing SPC — Frequently Asked Questions
Which battery cell process stages does iFactory's SPC connector cover?
iFactory covers slurry mixing, electrode coating, drying, calendering, formation, and cell finishing — streaming each stage's critical parameters into live SPC with continuous Cpk monitoring.
How does live coating thickness SPC improve cell yield compared to offline sampling?
Live SPC detects thickness drift within seconds of an excursion, allowing the coating operator to correct before an entire roll is out of specification — replacing offline sampling that catches defects only after material is already consumed.
Can iFactory integrate with existing formation cyclers and inline metrology systems?
Yes. iFactory connects to major formation cyclers and inline thickness gauges via OPC-UA, Modbus, and direct API, with a pre-built battery cell connector that maps parameters to SPC charts automatically.
Does the platform support multiple cell chemistries and formats on the same line?
Yes. Control limits, Cpk targets, and chart configurations are defined per product code, so pouch, cylindrical, and prismatic cell programs run under separate SPC parameter sets on the same platform instance.
How quickly can a gigafactory line be onboarded to iFactory's battery cell SPC platform?
Most EV cell production sites achieve live SPC across coating and formation within 4–8 weeks, depending on line complexity and the number of process stages included in the initial deployment scope.
Gigafactory Quality Starts With Live SPC — Not Shift-End Reports
At the production volumes and tolerance windows that define modern battery cell manufacturing, reactive quality control is not a viable strategy. Coating thickness, slurry viscosity, calendering density, and formation cell voltage are not parameters that can be managed with delayed batch reports — they require live SPC with real-time Cpk monitoring and automated alerting that gives Quality Leads the ability to act before defects propagate into finished inventory. iFactory's battery cell SPC platform delivers exactly this capability, with a pre-built connector that integrates across every process stage and a unified dashboard that puts live process performance in the hands of the people who need it most. If your team is scaling cell production volume or driving Cpk improvement programs across your gigafactory line, the most important next step is to see the platform in action. Book a Demo and see iFactory's battery cell SPC engine running on live production data.
Scale Battery Cell Quality with Live SPC Across Every Process Stage.
iFactory's battery cell SPC connector streams coating thickness, slurry viscosity, calendering density, and formation cell voltage into real-time control charts — purpose-built for high-volume EV cell production.