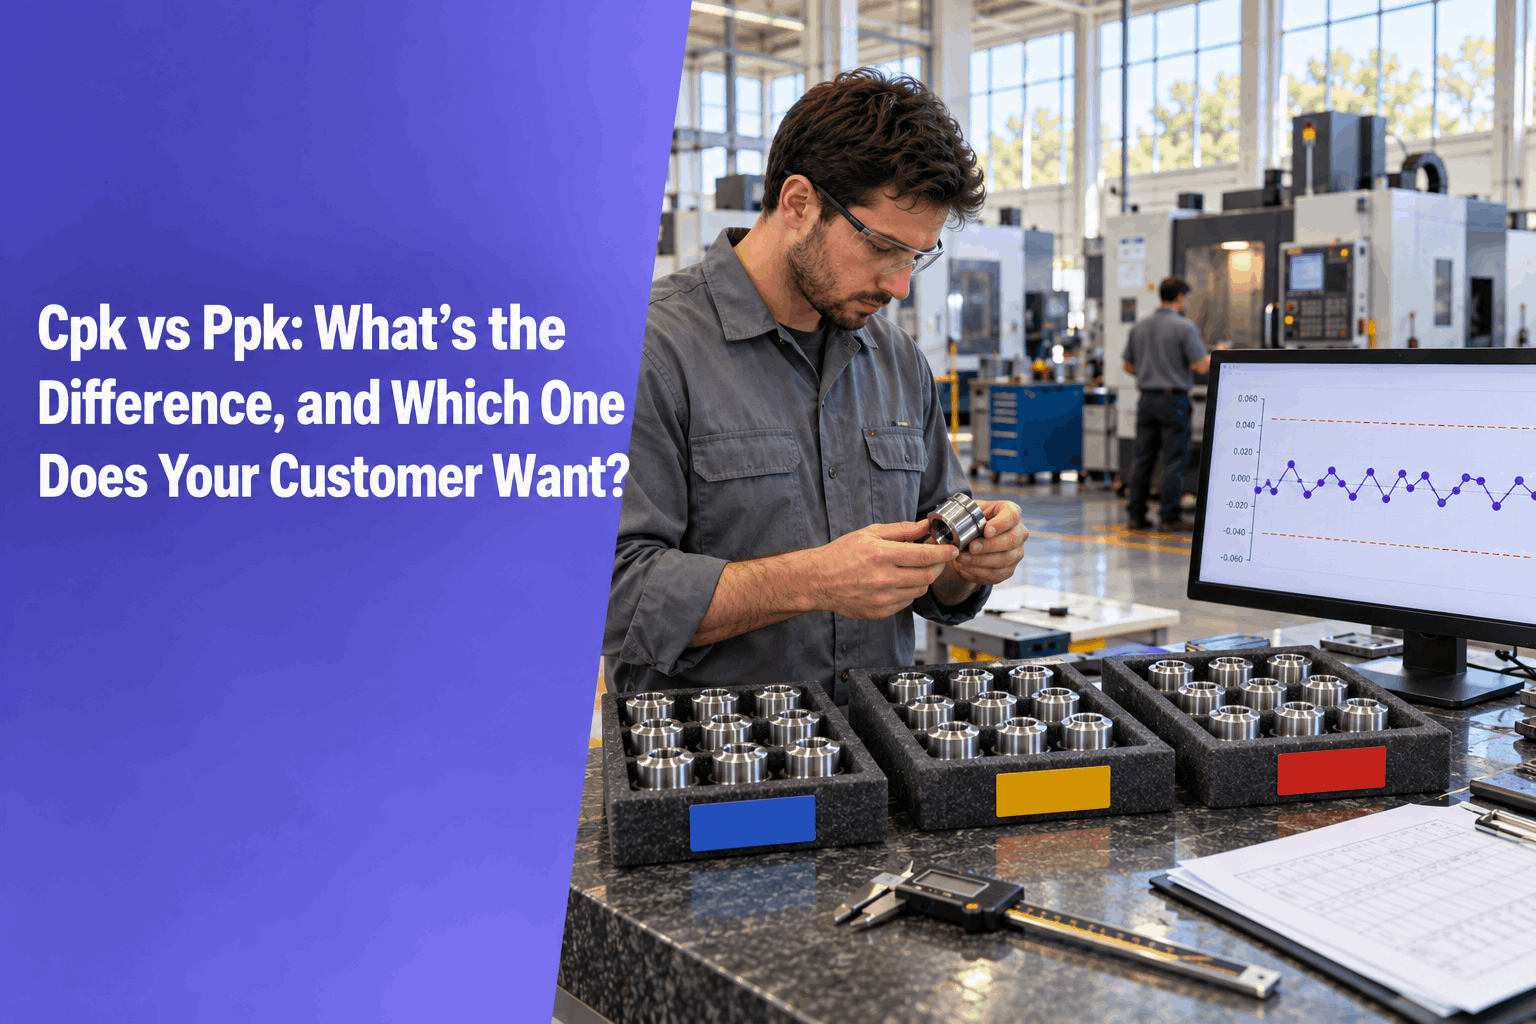
Cpk vs Ppk comes down to one thing: which standard deviation goes into the formula. Cpk uses the short-term spread inside each subgroup. Ppk uses the overall spread of every part you measured. In one line, Cpk is what the process can do when it runs steady, and Ppk is what it actually delivered. If Cp and Cpk are still new to you, read Cp vs Cpk first.
Same formula, different sigma
Two numbers that look alike can tell very different stories. When they disagree, the gap itself is the most useful thing on the report: it shows how much your process moves over time.
Cpk vs Ppk at a glance
Here is the difference between Cpk and Ppk in four lines.
The formulas, side by side
The formula shape is the same for both pairs. Only the sigma changes.
That is the whole Ppk formula. If you work in a spreadsheet, STDEV.S across all your values gives the overall sigma, which is why the same steps in Excel so often produce Ppk by accident when people meant Cpk. For the within-sigma side, see how to calculate Cpk.
Why Ppk is lower than Cpk
Overall sigma includes everything that shifts between subgroups: tool wear, material lots, shift changes and set-ups. Within sigma leaves those shifts out. So Ppk is usually equal to or lower than Cpk.
Look at the first lane. Each shift makes tight parts, so the within-subgroup sigma is small and Cpk looks healthy. But the mean moves from shift to shift. Pool all the parts, as the customer does when they open the box, and the spread is much wider. Ppk reports that wider spread.
Get Cp, Cpk, Pp and Ppk from your own data: paste your measurements and get a one-page capability report. 14-day free trial, no card needed.
Which one your customer wants
The answer depends on where the part is in its life. Either way, the customer's own requirements decide.
Ppk
The AIAG PPAP manual uses Ppk for initial process studies:
Often Cpk, on a stable process
Once a process is running and charted, many quality plans track Cpk, because a stable process with steady control limits is what Cpk assumes. Some customers still ask for Ppk, or both.
For typical targets on either index, see what a good Cpk value looks like.
How to close the gap between Cpk and Ppk
The gap is made of whatever shifts between subgroups. Closing it means finding those shifts and taking them out.
- Plot the data in time order. A run chart or control chart shows whether the mean steps, trends or wanders.
- Group by likely causes. Split the data by shift, material lot, machine, tool change or set-up and compare the means.
- Fix the biggest mover first. Common culprits are tool wear without compensation, set-up targets that differ by operator and lot-to-lot material changes.
- Collect fresh data and recalculate. When the shifts are gone, Ppk moves up toward Cpk and both numbers start to mean something.
Stability first
Neither number means much on an unstable process. Cpk assumes the process runs steady, so on a drifting process it describes a state you never actually stay in. Ppk describes what happened during the study, but it cannot predict next month if the process keeps changing.
Check stability on a control chart before you report either index. Two common signals to look for:
If you see either signal, find and remove the cause, then collect new data. Only report capability once the chart is steady.
Get both from your data
Whether your team calls it Cpk vs Ppk or Ppk vs Cpk, the useful part is the gap between them, and you only see it when both come from the same data. The Cp/Cpk Report Generator calculates both indices from one paste of data, so the gap is visible straight away, and gives an estimate you can review.
Get Cp, Cpk, Pp and Ppk from your own data: paste your measurements and get a one-page capability report. 14-day free trial, no card needed.
Frequently asked questions
What is the difference between Cpk and Ppk?
Both use the same formula shape. Cpk uses the within-subgroup, short-term sigma, so it shows what the process can do when it runs steady. Ppk uses the overall standard deviation of every value, so it shows what the process actually delivered, including shifts between subgroups such as tool wear or material lots.
Why is my Ppk lower than my Cpk?
Overall sigma includes everything that changes between subgroups: tool wear, material lots, shift changes and set-ups. Within sigma leaves those out, so Ppk usually comes out equal to or lower than Cpk. A large gap means the process moves over time, and that drift should be fixed before you trust either number.
Does PPAP use Cpk or Ppk?
The AIAG PPAP manual uses Ppk for initial process studies. Above 1.67 meets the criteria, 1.33 to 1.67 may be accepted with customer approval, and below 1.33 does not. Your customer's own requirements can differ, so always check their drawing or quality manual before you submit results.
Can Ppk be higher than Cpk?
It can, but only by a small amount, usually when the range-based estimate of within sigma comes out slightly high by chance. A Ppk noticeably above Cpk is a reason to recheck the calculation, especially the subgroup order and whether the right sigma went into each formula.
Are Pp and Ppk the same as Cp and Cpk on a stable process?
Close, but not identical. On a truly stable process, very little shifts between subgroups, so overall sigma and within sigma come out close and the two pairs of indices nearly match. When they drift apart, the process is not as stable as it looks, and the control chart should show why.