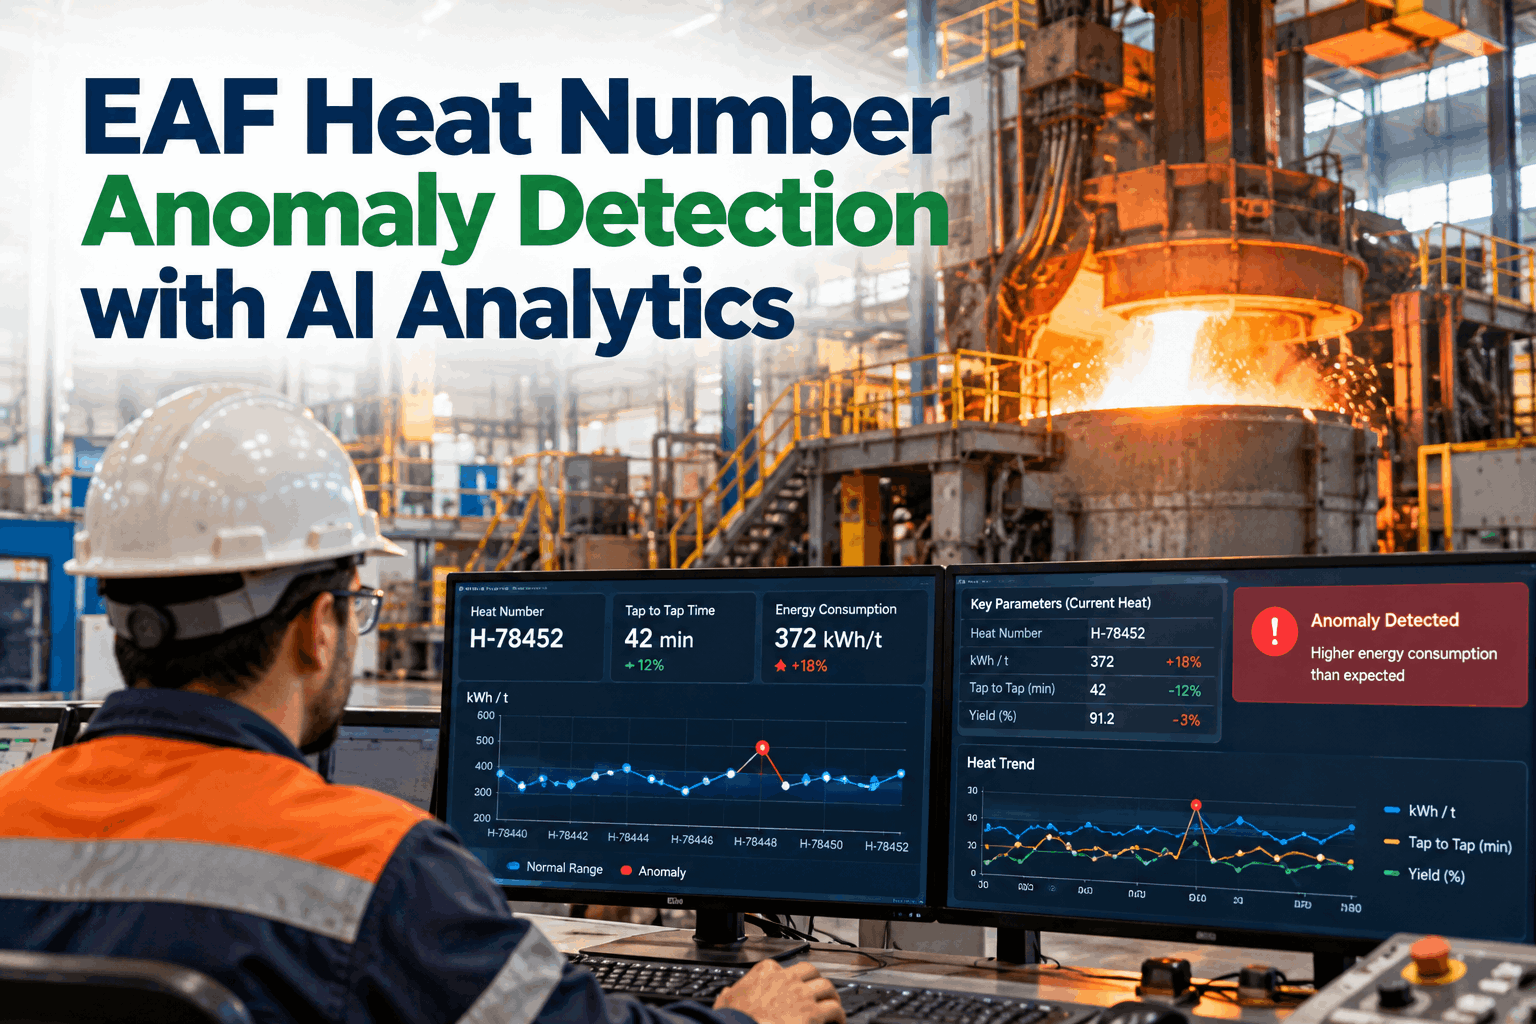
Most melt shops find a bad heat in the next morning's report, after three more heats have run the same way. Heat-level anomaly detection flags it at tap, so the melter can act before the next charge. To try it on your own heat log, book an EAF heat review.
EAF Heat Anomaly Detection with AI Analytics
Every heat compared with what it should have used, given its scrap, heel, delays and oxygen. Deviations in kWh/t, tap-to-tap and yield reach the melter with a likely cause, before the next bucket goes in.
- Why a fixed kWh/t target hides the real outliers
- Six heat anomalies worth catching, and their usual causes
- How to stop one bad heat turning into three
Eleven heats sit inside their own expected band. Heat 4312 sits well above it. A plant-wide average would not have shown this, because heats vary widely for good reasons.
Why Bad Heats Are Found Too Late
A heat lasts under an hour. The report arrives the next day.
Most shops judge heats against a shift or monthly kWh/t target. But one heat can use more power for good reasons, such as heavy scrap or a cold furnace, and another can waste power for bad ones, such as a long delay or poor foaming slag. A single target cannot tell them apart. Our steel support team can help you see which is which in your own data.
Averages hide heats
A good shift average can hide two or three costly heats behind many normal ones.
Targets ignore context
Scrap mix, hot heel and delays change what a heat should use, sometimes by a lot.
Reports come late
By the time the report is read, the same practice has run again on several heats.
Causes go unrecorded
Without a reason logged, the same problem returns next week, and nobody connects the two.
kWh per tonne
Electrical energy for the heat, divided by tapped tonnes. The headline cost figure.
Tap-to-tap
Total heat time, split into power-on and power-off, with every delay coded.
Yield
Tapped steel as a share of metallic charge. Small changes cost a lot of scrap.
Consumables
Electrodes, oxygen, carbon and lime per tonne, each against its own band.
The key idea is simple. Judge each heat against what that heat should have used, given its inputs, not against the plant average. Only then does a real outlier stand out from a heat that was simply harder.
Six Heat Anomalies Worth Catching
Not every deviation is a problem. These six usually are.
Each anomaly below leaves a clear trace in the heat data, and most have a short list of usual causes that your melters will recognise. Catching them early turns a vague "bad day" into a specific fix. To map these to your furnace, book a melt shop session.
Delays with the power off still cost energy, because the furnace keeps losing heat through water cooling, radiation and the off-gas. Studies of EAF energy models note that delay time is often left out, even though longer heats naturally lose more.
Not every flag is a fault. A heat on a new scrap grade or a trial practice may sit outside its band for a known reason. Mark it, so the model learns, and keep the alert list for the heats nobody can yet explain.
What sets a heat's expected value
- Charge. Weight, scrap grades and buckets.
- Furnace state. Hot heel, refractory, time since last tap.
- Chemistry. Oxygen, carbon and lime added.
- Time. Power-on time and every delay.
What usually explains the gap
- Power-off delays the heat could not avoid
- Scrap that was not what the bucket card said
- A power profile that did not suit the charge
- Slag that did not foam well enough
One Bad Heat, Explained
Here is heat 4312 broken down. The model's expected value accounts for the charge and furnace state. The gap is split into the causes most likely behind it.
Before the Next Charge: Stopping the Cascade
One bad heat rarely stays alone. The fix has to land before the next bucket does.
A small hot heel, a slow crane or the wrong scrap in the yard can carry straight into the next heat, then the one after. The window to act is the few minutes between tap and charge. That is when an alert is worth most. If you want help setting alert rules, our engineers can help.
Tap
Heat closes. Final kWh/t, time, yield and temperature recorded automatically.
Compare
Actual against the heat's expected value, within seconds of tap.
Explain
Likely causes ranked, with the evidence behind each one.
Alert
Melter and scrap yard see the flag on the pulpit screen and mobile.
Act
Bucket, heel or power profile adjusted for the next heat, if the melter agrees.
Confirm
Next heat checked to see if the fix worked, and the result logged for the record.
The scrap pile
One pile loaded lighter or dirtier than its grade. Every bucket from it raises kWh/t and cuts yield until the yard notices.
The hot heel
A small heel after one tap means a colder start for the next heat, which then runs long and leaves another small heel.
The crane
One slow lift delays charging. If the cause is a schedule clash, it repeats at the same point in every cycle.
Making Alerts the Melter Trusts
Too many alerts get ignored. Too few miss the heats that matter.
The aim is a handful of clear alerts per shift, each with a reason. That means a model that knows your furnace, bands that fit each kind of heat, and alerts that say what to check, not just that something is wrong. Anything less soon gets switched off. To tune alerts for your shop, book an alert tuning call.
Explain every flag
An alert without a likely cause is just noise on a busy pulpit, and soon gets ignored.
Fit bands to grades
Special grades and first heats after a stop get their own bands, so they are not flagged every time.
Learn from feedback
Melters mark alerts as useful or not, and the model gets better each week.
Begin with bands wide enough to catch only clear outliers, so melters see few alerts and learn to trust them. Tighten them over the following weeks as the model learns your furnace and the team learns the alerts.
A useful alert says
- Which heat. Number, grade and furnace.
- How far off. Actual against expected.
- Why, probably. Top causes, ranked.
- What to check. One clear next step.
A useless alert says
- "kWh/t high" with no context
- The same warning every heat
- A reason nobody can check
- Something only an analyst can read
Research on EAF energy models warns that a good fit is not enough. The inputs a model leans on should make physical sense, such as delays raising energy use. Ask any vendor to show why a heat was flagged, not just that it was.
How iFactory EAF Energy AI Detects Heat Anomalies
Built on your heat log, running at the pulpit, explained in plain words.
iFactory's EAF Energy AI reads heat data from your furnace automation, scrap yard records and power system. It learns what each kind of heat should use, flags heats outside their band at tap, and works with Power Profile Optimization to suggest changes for the next charge. Melters stay in control of every decision on the furnace, as they should. Questions on fit go to our support desk.
Connect
Furnace PLC, level 2 heat records, scrap yard and power data, read without changing control.
Learn
Expected kWh/t, time and yield for each kind of heat, from your own history and grades.
Flag
Out-of-band heats raised at tap, with ranked likely causes and the evidence behind them.
Suggest
Next-heat adjustments to scrap, heel or power profile, for the melter to decide.
What the melter sees
- Flag at tap, with the likely cause
- A check to make before the next charge
- Whether the last fix worked
What process engineers see
- Anomalies by grade, shift and scrap supplier
- Causes that repeat week to week
- Energy lost to delays, in kWh and money
Results depend on your furnace, scrap and data quality. We measure them on your own heats during the pilot rather than quoting a general saving.
Turnkey AI: Delivered, Connected and Live in 6–12 Weeks
You do not build this. It arrives ready.
iFactory ships as a pre-configured NVIDIA AI server, racked and ready, with the software pre-loaded. Rack it, plug in power and Ethernet, and the AI is live on your network.
Our team handles cabling, network setup, PLC and SCADA integration, operator training and 24×7 remote monitoring. The server sits inside your own network, so heat and power data stay on site. For a scope matched to your melt shop, request a turnkey quote.
Ship, network and data
Server installed. Furnace, level 2, scrap yard and power data connected. Heat history loaded.
Model training and pilot
Expected-value models trained on your heats. Alerts run in the background and are checked by your melters and process engineers.
Go-live and training
Alerts live on the pulpit screen for every heat. Melters and process engineers trained. 24×7 remote monitoring begins.
Frequently Asked Questions
What is EAF heat anomaly detection?
Comparing each heat's actual results, such as kWh per tonne, tap-to-tap time and yield, with what that heat should have achieved given its charge and furnace state, and flagging the heats that fall well outside. The point is to find real problems, not just expensive heats.
Why not just use a kWh/t target?
Because heats differ. Heavy scrap, a cold furnace, a long stop or a special grade can need more power for perfectly good reasons. A fixed target flags those and misses wasteful heats that happen to land near the average. Expected values fix both errors.
How quickly does an alert arrive?
At tap, or within seconds of it, so the melter and scrap yard can act before the next charge. Some signs, such as a long delay or a slow melt-down, can be flagged during the heat itself, while there is still time to adjust.
How much heat history is needed?
Several months of heats is a good start for most shops, with charge, delays, oxygen, power and tap data. More is better for rare grades. Gaps and errors in the heat log matter more than its length, so part of the pilot is cleaning and checking the data.
Does it change the furnace automatically?
No. It flags heats and suggests changes for the next one. The melter decides, and every decision is logged with the heat. Any link to automatic control would be agreed with your team and go through your change process.
What is a "cascade" of bad heats?
When one problem, such as a poor scrap pile, a small hot heel or a slow crane, carries into the next heats. Catching it at the first heat stops it repeating, and saves the energy, time and yield the next heats would have lost.
Can it work with our level 2 system?
Usually, yes, without replacing it. iFactory reads heat records from common level 2 and furnace automation systems, alongside scrap and power data. To check your set-up, contact our team.
Find Your Costliest Heats
In thirty minutes we go through a sample of your heat log, show which heats sat outside their expected band, and point out the causes that repeat. You keep the findings whether or not you go further with iFactory.
- 1A month of heat records from level 2
- 2Bucket and scrap grade data per heat
- 3Your delay codes and delay log
- 4Power and oxygen data per heat
- 5Your current kWh/t targets by grade