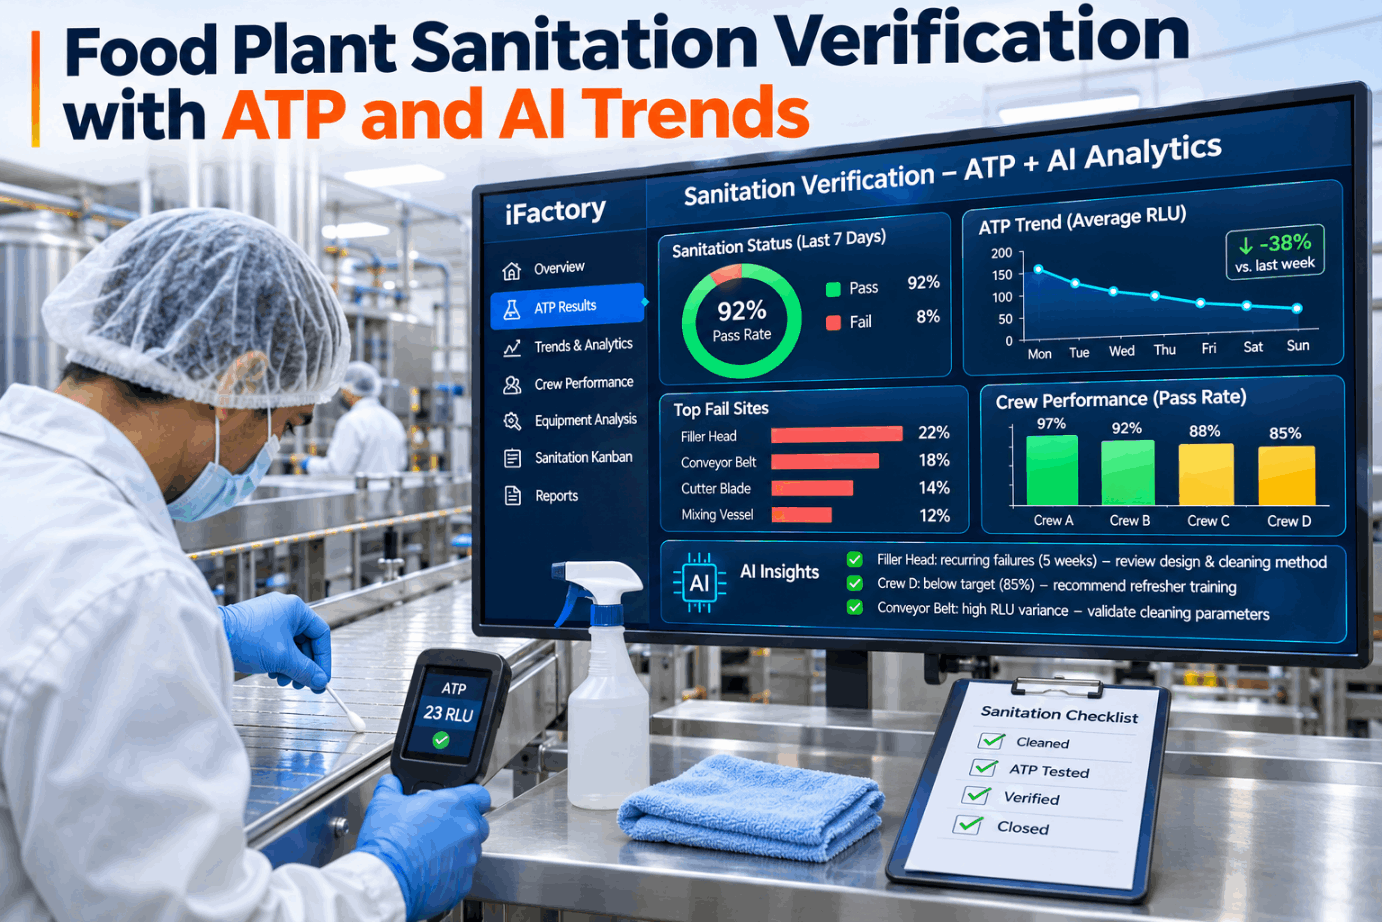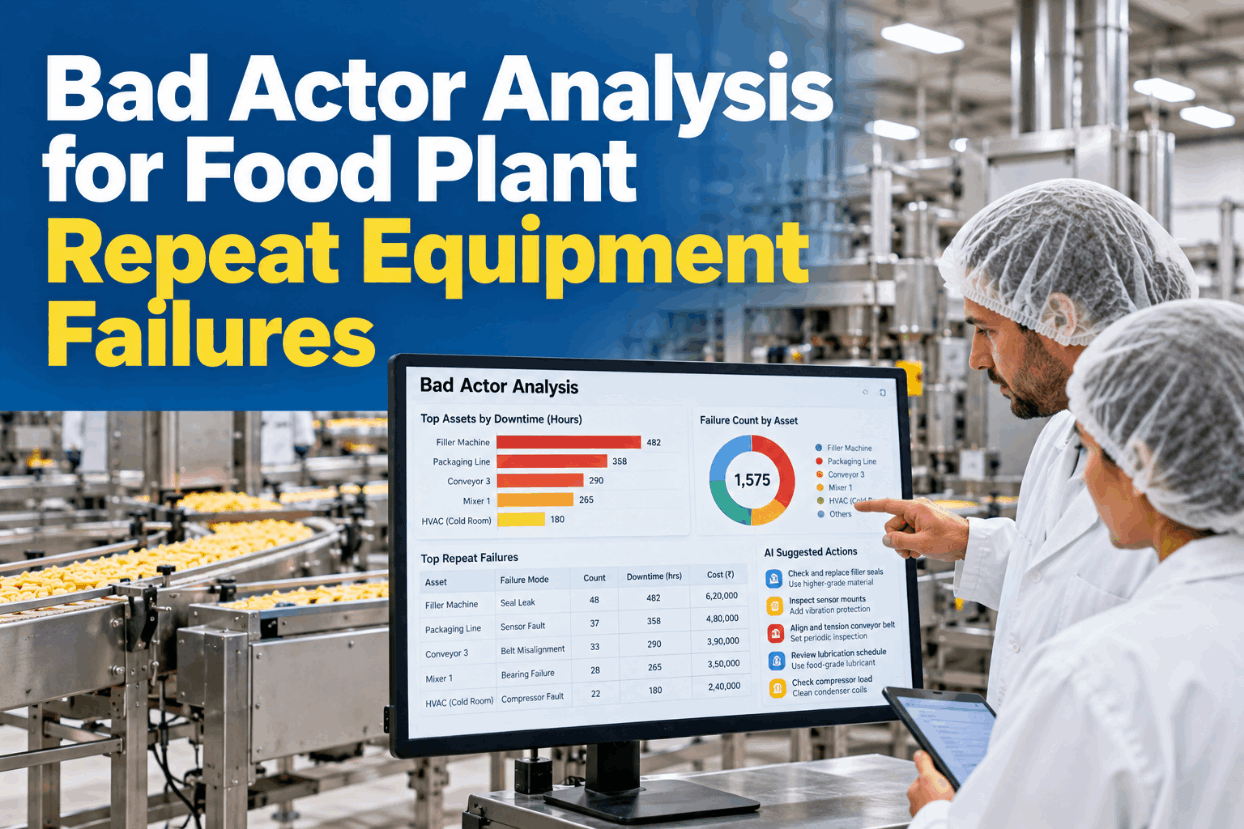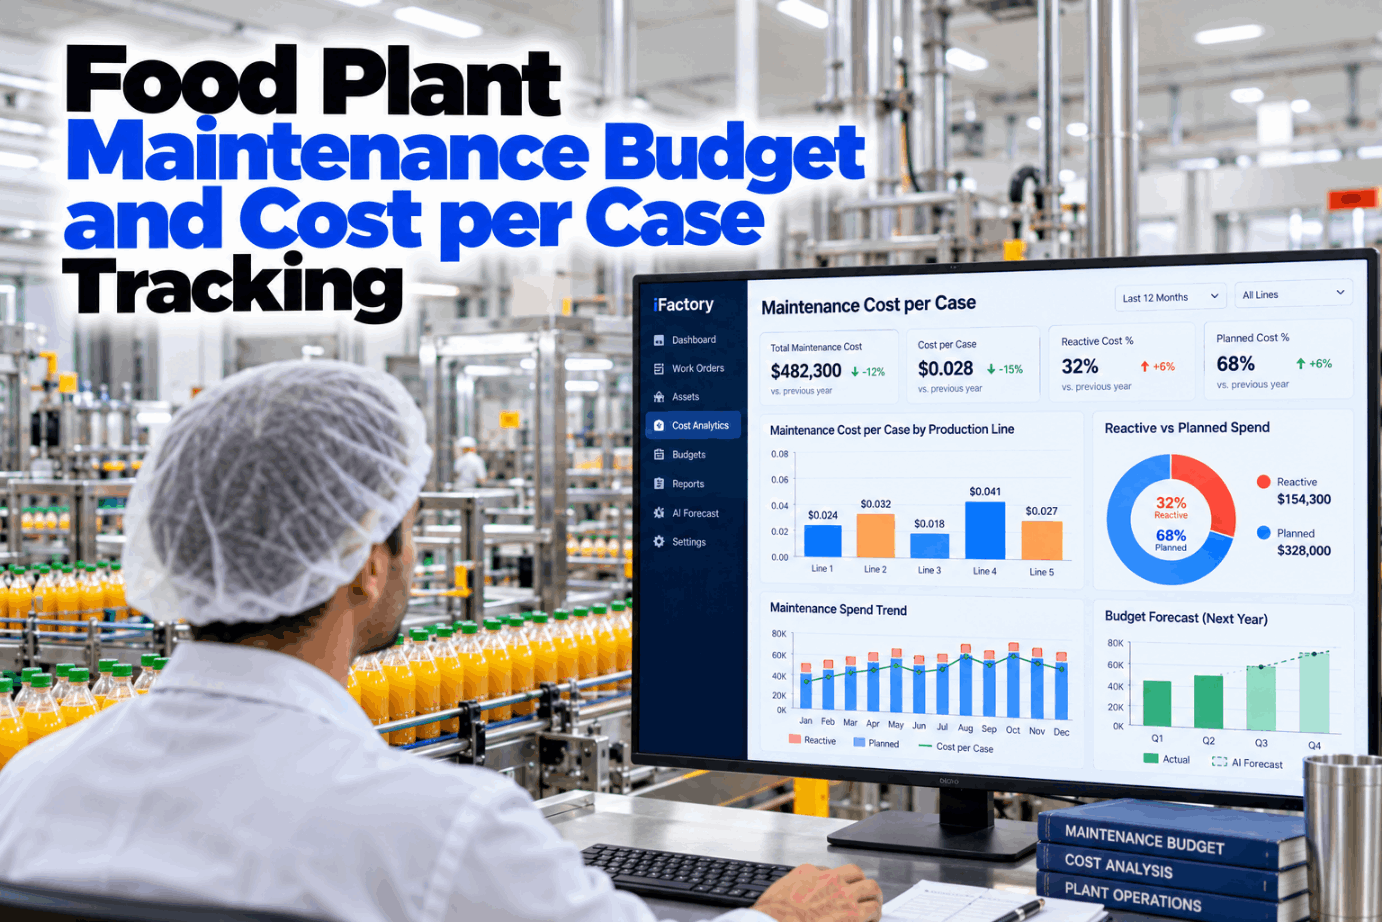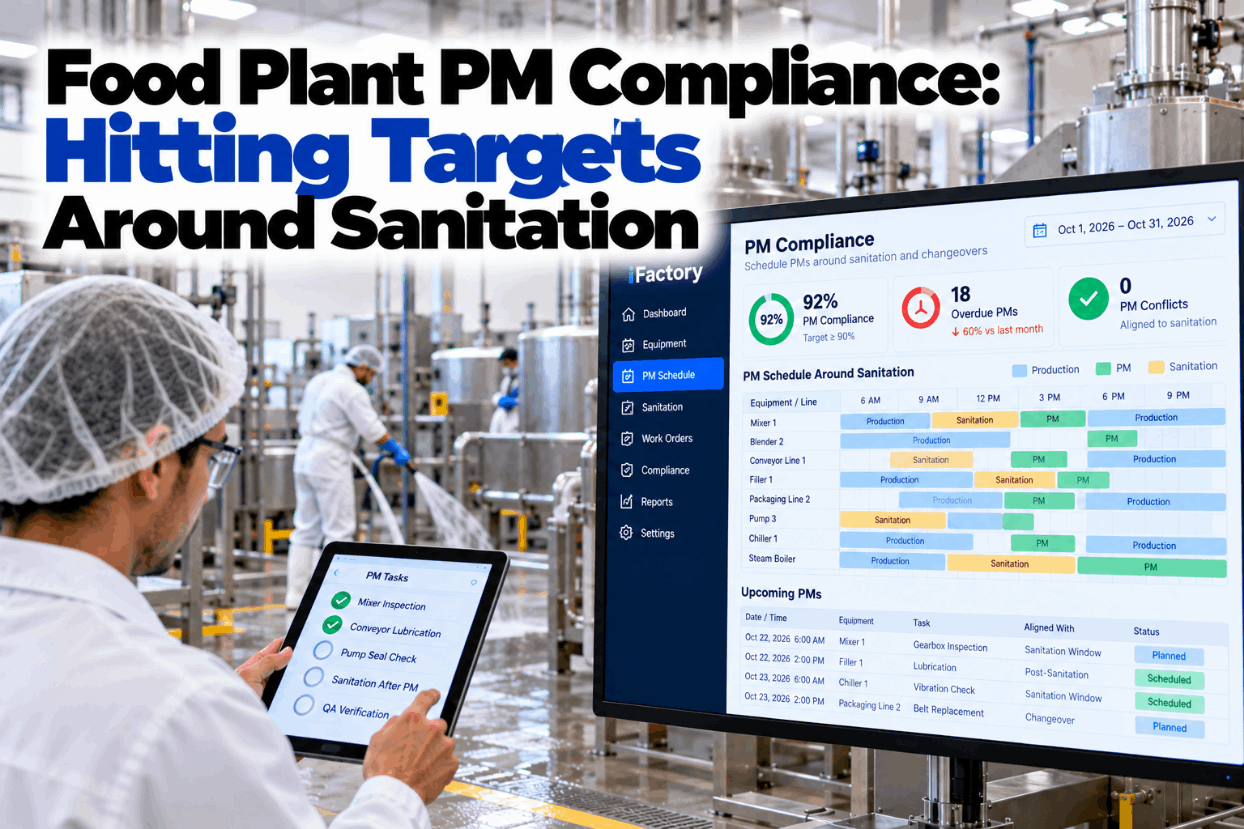
An ATP swab answers one narrow question in seconds: did cleaning leave organic residue on this surface? Six weeks of readings sorted by site, crew, equipment and shift tell you much more: which surfaces are hard to clean, which methods are not working and where a crew needs support. See it on your own results in a 30-minute sanitation trends demo.
Find the Swab Sites That Keep Failing, and the Reason Behind Them
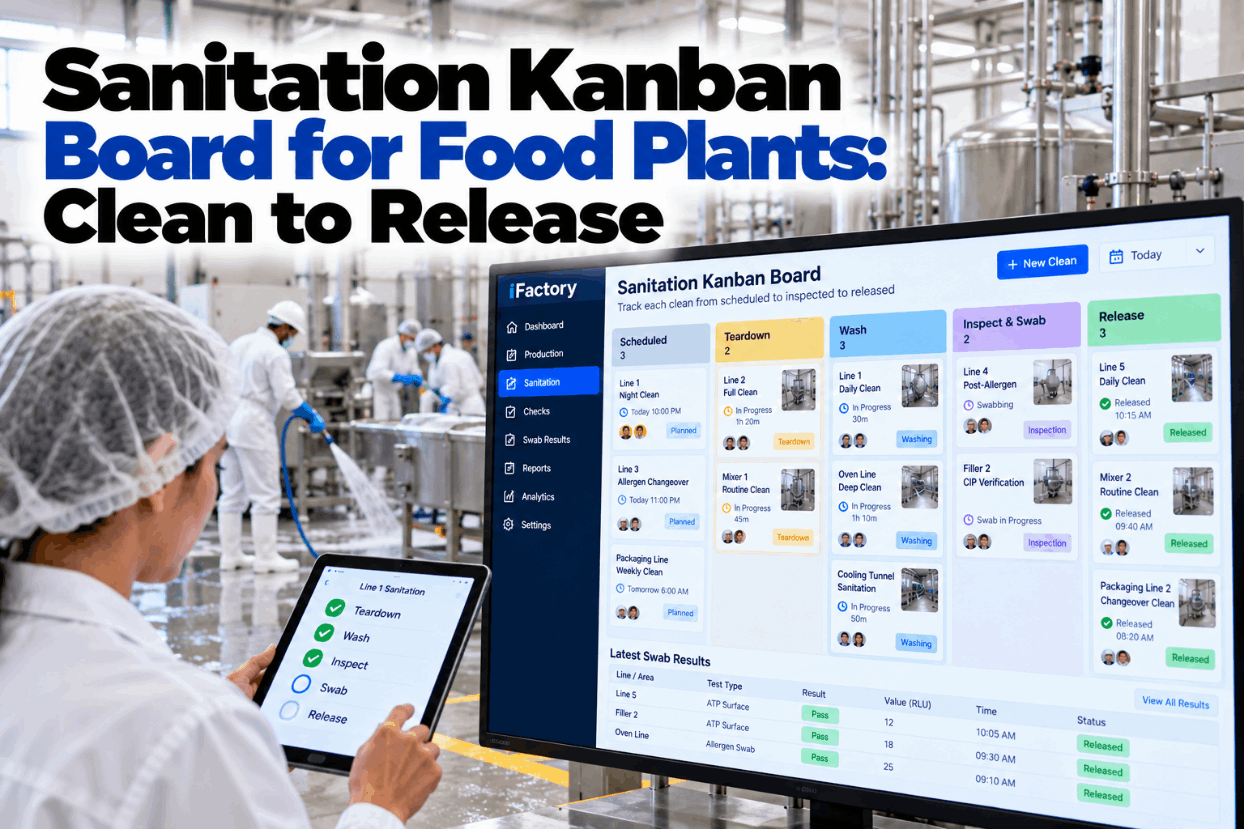
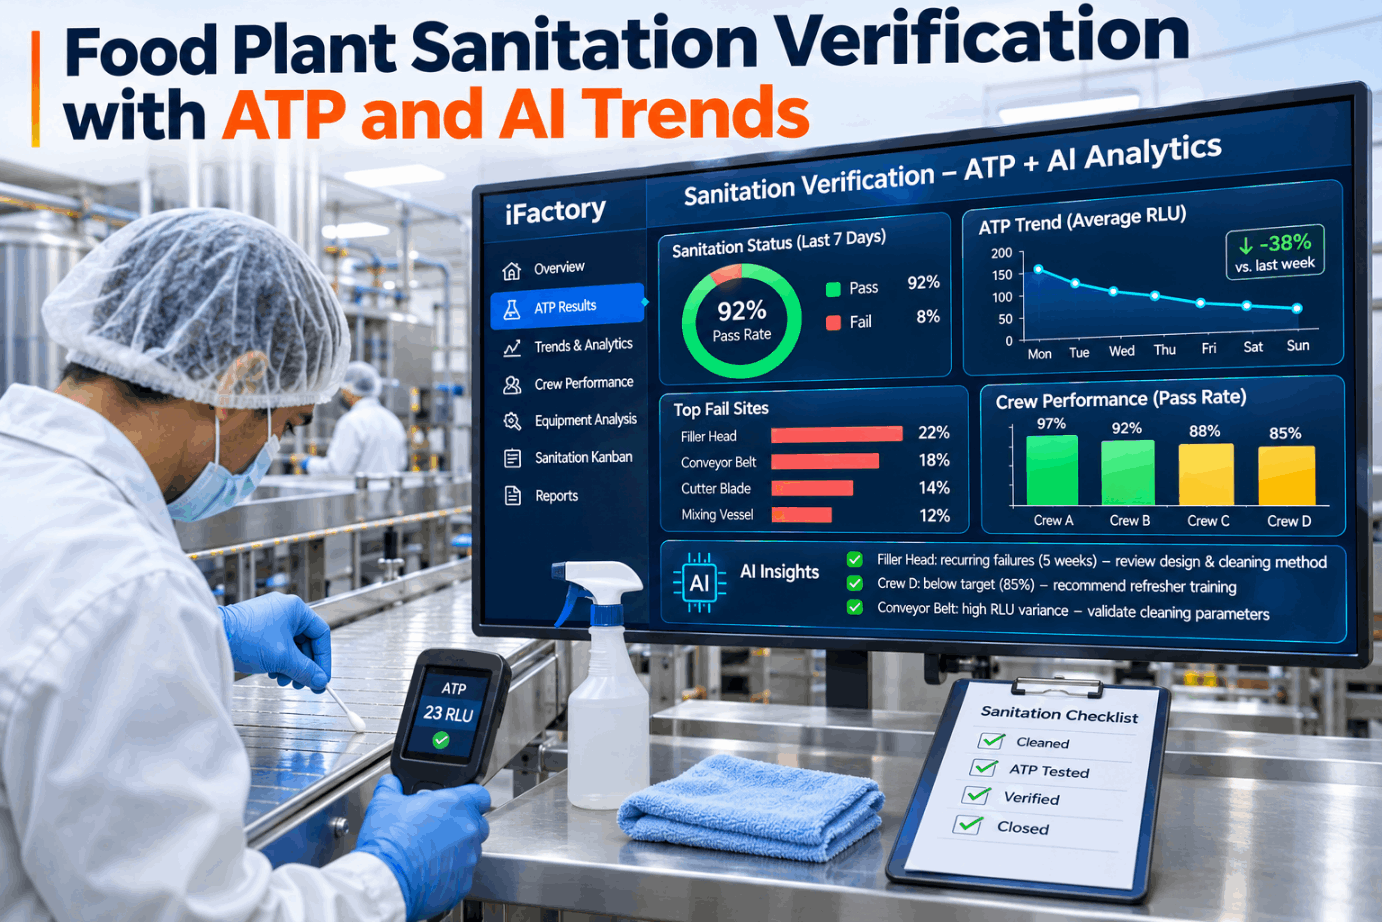
iFactory Sanitation Analytics files every ATP result by site, crew, equipment and shift. The AI ranks chronic fail points and opens design or training actions on your sanitation kanban, so a weak spot gets fixed instead of re-cleaned every night.
What a Low RLU Reading Does and Doesn't Prove
ATP bioluminescence detects adenosine triphosphate, which is found in food residue and in all living and once-living cells. The luminometer reports it in relative light units (RLU). That makes ATP a fast residue check, not a bacteria count and not a pathogen test. RLU also has no fixed physical meaning. A Food Safety Magazine sanitation column notes that RLUs are often not comparable between different manufacturers' instruments, so a limit written for one brand does not carry over to another. Check the scope of your own program with our hygiene support team.
- Organic residue is still on that surface after cleaning
- How the site compares with its own history on the same device
- Whether a re-clean brought the reading back down
- Where results drift by crew, shift or equipment over time
- Whether Listeria or any other pathogen is present
- Whether an allergen protein has been removed
- How many live bacteria are on the surface
- How its RLU compares with a reading from another brand
Some sanitizers and some product types can raise or lower a reading. A 3M application bulletin found common sanitizers at working strength stayed inside its interference threshold, and it advises swabbing after cleaning and before sanitizing. Confirm the effect of your own chemicals with your device maker.
Fixed Sites, Rotating Sites and Why You Need Both
A swab plan that tests the same ten spots every night only ever tells you about those ten spots. Most programs keep a core of fixed sites, swabbed at every clean for a continuous trend, and rotate a longer list so every food contact surface is covered over a few weeks. Build a rotation for your lines in a swab plan session.
Limits Belong to a Site, a Surface and a Device
There is no industry-wide ATP pass mark. Limits are set per site and per surface on the luminometer you actually use, normally from a baseline of readings taken after cleans that were known to be good. The same sanitation column gives a common rule of thumb: readings above two to three times the background of a clean surface suggest residue. Worn steel, belting and boards read differently from new stainless. Talk through limit setting with our support team.
Four Ways to Slice the Same Swab Results
Each reading is stored with its site, crew, equipment, shift and device, so iFactory can read the same results four ways. A site that fails on every shift points at the surface or the method. A crew that fails across many sites points at training or time. The chart is an illustration, not plant data. See all four views on a sample week in a live analytics demo.
Ask Which Site Fails Most and Hear Why
Sanitation and QA leads can ask iFactory about swab trends by voice on the floor or typed at a desk. The answer names the site, the pattern behind it and the action already sitting on the kanban.
When the Same Spot Fails Week After Week
A chronic fail point is a site that fails or sits at caution again and again, whoever cleans it. Often the cause is built in: a crevice, hollow frame or fastener that no brush can reach. Hygienic design guidance covers these features, including EHEDG Guideline 8, Hygienic Design Principles (fourth edition, December 2025), and the 3-A Sanitary Standards used for dairy and food equipment in the US. iFactory ranks the patterns. It does not prove a design fault. Review your repeat fail list with our hygiene support team.
Check the method alongside the design: chemical strength, contact time, tools and teardown. A method gap can look exactly like a design gap in the data.
Coaching That Starts With the Pattern, Not a Name
ATP results can easily become a scoreboard crews learn to fear. People stop raising problems and start cleaning to pass the swab. Robert Powitz, writing in Food Safety Magazine, puts it simply: never use the results punitively. iFactory shows crew patterns to sanitation leads as coaching prompts,, never as a league of names. Set up coaching views with our team in a sanitation coaching demo.
What Happens After a Caution or a Fail
Your sanitation SOP should say exactly what follows a reading above the limit, so night crews never have to guess. Your own food safety plan decides the details, such as how many re-cleans come before QA steps in. Ask our support team to load your re-swab rules.
ATP Next to Visual Checks, Allergen Swabs and EMP
ATP is one tool in sanitation verification, not the whole program. Visual inspection comes first. Allergen changeovers need protein or allergen-specific tests, since ATP is not an allergen test. Environmental monitoring for Listeria is a separate program with its own zones, sampling plan and lab methods. Map how each check fits your plan in a program walkthrough.
Validation, in Codex food hygiene terms, is obtaining evidence that a control measure can control the hazard when it is properly applied. Verification checks that it is being applied as intended. Nightly ATP swabs are verification. Proving that a cleaning procedure works in the first place is validation and usually needs microbiological or allergen data too.
Three Patterns and the Kanban Cards They Opened
These are illustrations, not case studies. In each one the AI flagged a pattern and opened a kanban card that a named person owns. Bring your own trend questions to our support team.
From Luminometer Exports to a Ranked Fail List
Most plants already hold months of ATP results. The work is mapping each site to equipment, crews and shifts. Walk through the four stages with our team in a setup demo.
Count the Night Crew Hours Spent Re-Cleaning
The clearest cost of a chronic fail point is the nightly re-clean. Every input is assumed and is there only to show the sums. Leave avoided product holds out unless your records show them. Our team can help you pull the inputs from your logs.
Sanitation Analytics and an Edge AI Server, Shipped Ready
Sanitation Analytics arrives as one turnkey package. Its pre-configured NVIDIA AI server ships racked and ready with the trend models loaded, so your sanitation data stays on site. You rack it, plug in power and Ethernet, and the AI is live. For pricing on your lines, ask for a turnkey quote.
- Pre-configured NVIDIA AI edge server, racked and ready
- Import of results from your luminometer software exports
- Swab site register linked to equipment, crews and shifts
- Chronic fail ranking by site, crew, equipment and shift
- Design and training actions opened on the sanitation kanban
- Voice and typed questions for sanitation and QA leads
- Remote monitoring of models and hardware
Sites, surfaces, limits and crews mapped. Past ATP results imported.
Trends built and the first ranked fail list reviewed with QA.
Kanban actions switched on, leads trained, first weekly trend meeting held.
Swab Data That Turns Into Owned Actions
iFactory sits between your luminometer and your sanitation kanban, so results lead somewhere instead of filling a binder. Ask our support team how it would sit inside your current program.
What QA and Sanitation Leads Ask About ATP Trends
Stop Re-Cleaning the Same Spot Every Night
Trend every ATP result by site, crew, equipment and shift, find the chronic fail points and send them to the right owner. Delivered turnkey and live in 6 to 12 weeks.