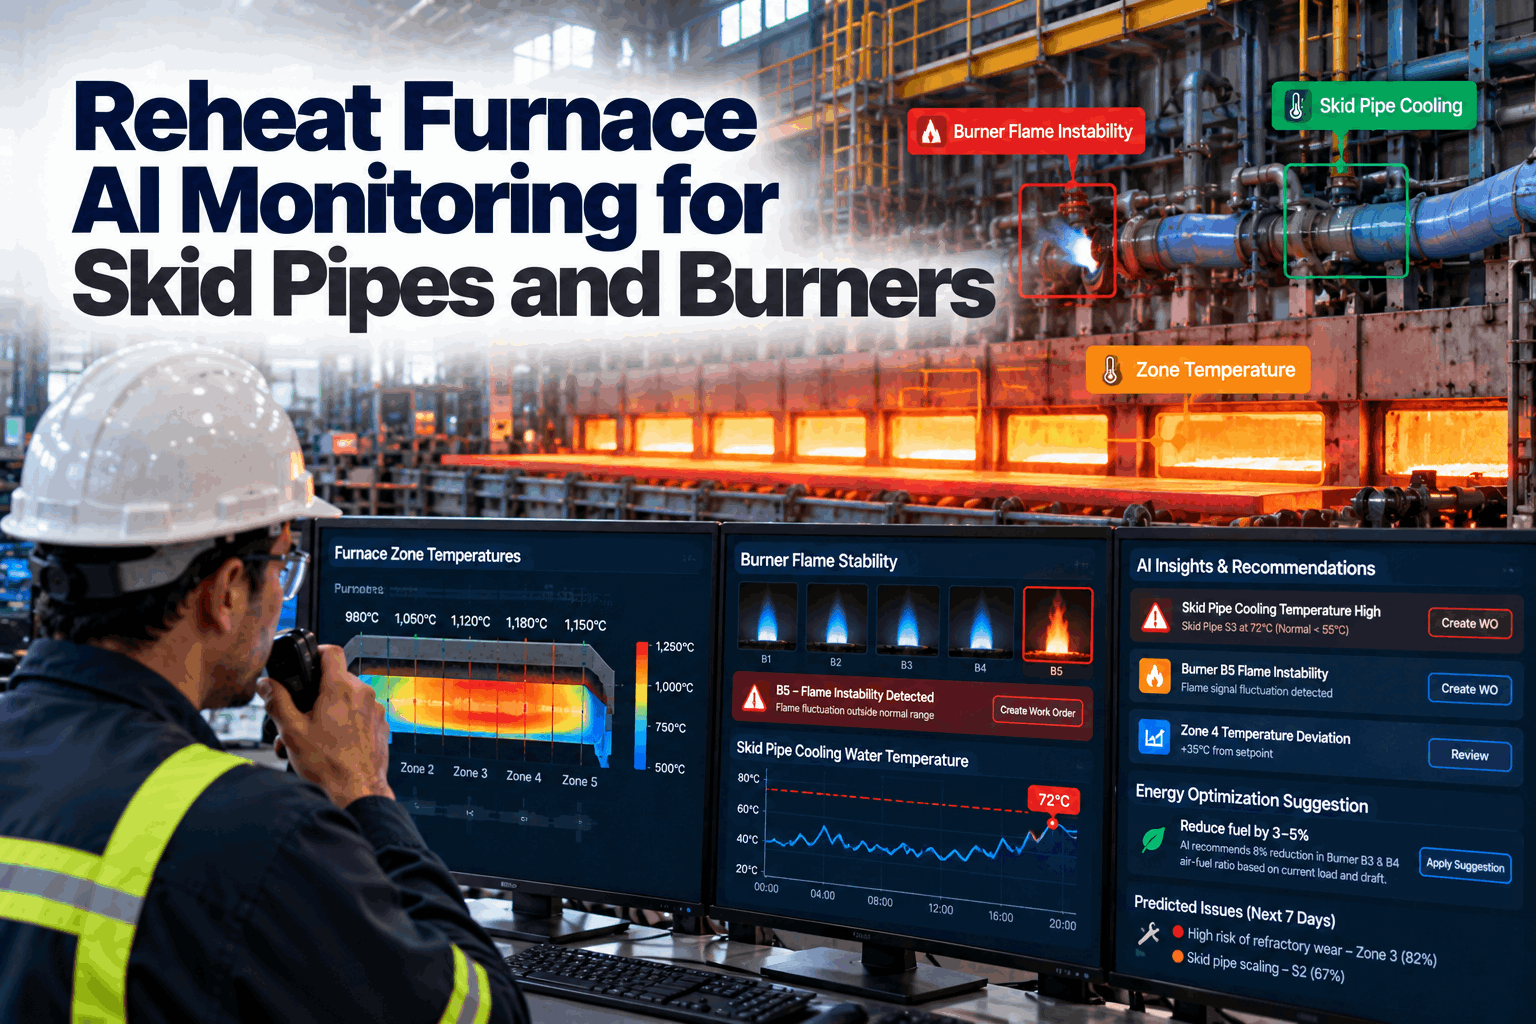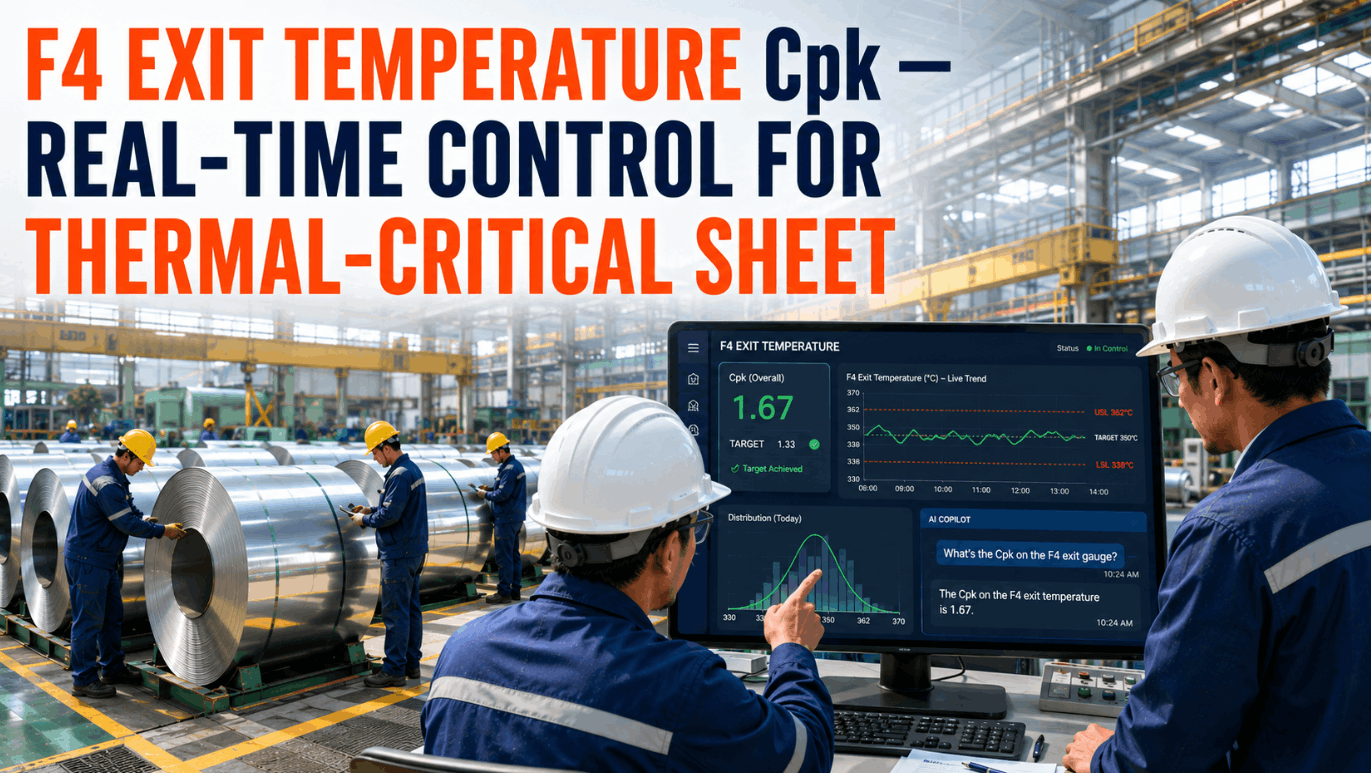
A reheat furnace discharge temperature that is drifting below target is not a single-variable problem — and treating it like one is exactly why process engineers spend hours pulling data from four different systems before they can even form a hypothesis. The discharge temp is the output of a combustion process that depends on combustion air flow and pressure, fuel supply pressure and composition, soak zone dwell time, the thermal load of the current production schedule, furnace pressure balance, and the most recent recipe change. Any one of these variables, or a combination of several, can drive a discharge temp deviation. Without a system that pulls all of them simultaneously and correlates them against the temperature signal in real time, diagnosis is serial, slow, and dependent on which engineer happens to be on shift. iFactory's Plant Copilot changes that entirely. When a process engineer asks "why is the furnace discharge temp dropping?", the Copilot pulls combustion air data, fuel pressure history, soak time records, and recent recipe changes — and returns a structured diagnosis in seconds, not shift-review cycles. Engineers who have Book a Demo consistently describe the same shift: from chasing data across five screens to reading a ranked causal analysis in a single response.
Why Discharge Temp Diagnosis Takes So Long in Conventional Process Engineering
The reheat furnace discharge temperature is the final measured output of a multi-zone, multi-variable combustion system. By the time a deviation registers on the discharge thermocouple, the causal condition has typically been present in one or more upstream variables — combustion air ratio, fuel supply pressure, soak zone temperature profile, furnace pressure balance, or scheduling-driven load changes — for anywhere from minutes to hours. The diagnostic challenge is not identifying that the temperature has dropped. The challenge is determining which upstream variable, or combination of variables, is responsible — and doing it fast enough to correct the condition before the discharge deviation produces out-of-spec metallurgical results on material already in the furnace.
In conventional process engineering workflows, this diagnosis requires sequential access to the historian for combustion air flow tags, the combustion control system for fuel pressure records, the furnace scheduling system for current soak time and load density, and the recipe management system for recent parameter changes. Each query is manual, each system has its own interface, and the engineer doing the diagnosis is racing against a furnace that continues to discharge under-temperature material while they work. Process engineers who Book a Demo with iFactory see, for the first time, all five diagnostic data layers pulled and correlated automatically from a single natural-language question.
The Five Variables Plant Copilot Pulls and Correlates for Every Discharge Temp Query
A discharge temperature deviation is the downstream symptom of an upstream process imbalance. Plant Copilot is configured to query and correlate five specific data layers simultaneously — each one addressing a distinct class of cause — and to rank the resulting findings by their statistical contribution to the observed deviation at the current timestamp.
Combustion Air Flow and Ratio
The combustion air-to-fuel ratio is the primary determinant of combustion completeness and flame temperature in every furnace zone. A drop in combustion air flow — from recuperator fouling, damper position drift, or fan inlet restriction — reduces flame temperature directly and produces a discharge temp decline that can appear gradual or sudden depending on the rate of air flow change. Plant Copilot pulls the combustion air flow tag and the computed air-fuel ratio for each zone over the configurable lookback window, flagging deviations from the target stoichiometric ratio and the time-in-deviation for each zone individually.
Fuel Supply Pressure and Calorific Value
Fuel supply pressure fluctuations — from header pressure drops, regulator drift, or supply network demand variability — reduce the fuel delivery rate to the burners, lowering heat input below the level required to maintain the target discharge temperature. In natural gas systems, changes in gas composition (calorific value variability) produce an equivalent effect: the same volumetric flow delivers less heat energy. Plant Copilot queries the fuel pressure tag at the burner manifold level, not just the header, identifying zone-specific pressure drops that zone-averaged readings would mask.
Soak Zone Dwell Time and Load Density
The soak zone performs the final temperature equalization across the cross-section of the product before discharge. If the furnace is being pushed at a higher extraction rate than the current heat input can support, soak zone dwell time decreases, and pieces exit before reaching thermal equilibrium — producing a discharge temperature that reads correctly at the surface thermocouple but is under-temperature in the product core. Plant Copilot cross-references the current extraction rate against the production schedule heat input target, flagging conditions where throughput demand has outpaced the furnace's thermal capacity.
Furnace Pressure Balance
A reheat furnace operating at negative pressure relative to atmosphere draws cold ambient air through door seals, skid openings, and structural leakage points — introducing an uncontrolled cooling mass flow that competes directly with combustion heat input. This condition is particularly common during high-extraction periods when the discharge door opening frequency is elevated. Plant Copilot monitors the furnace draft pressure tag and correlates negative pressure events with the discharge temperature decline timeline, distinguishing air-infiltration-driven cooling from combustion-system-driven causes.
Recent Recipe Changes and Setpoint History
Recipe changes — zone temperature setpoint adjustments, air-fuel ratio target revisions, or production schedule grade transitions — are among the most common undocumented contributors to discharge temperature deviations. A setpoint change made by the previous shift to accommodate a different grade or a different thermal load can produce a discharge temperature effect that only becomes visible several furnace transit times later. Plant Copilot checks the recipe version log for every zone setpoint change within the configurable attribution window and flags parameter deltas that correlate with the onset of the discharge temperature decline. Book a Demo to see how this attribution works on your furnace configuration.
Discharge Temp Deviation: Cause Classification and Copilot Response Matrix
Each class of discharge temperature deviation has a distinct diagnostic signature — a combination of which tags are deviating, in which direction, and at what rate relative to the temperature drop. The matrix below documents how Plant Copilot classifies each deviation class, what data it surfaces, and what corrective action it recommends. Book a Demo to see how the classification logic is calibrated to your furnace's specific zone configuration and burner type.
| Deviation Class | Primary Diagnostic Signal | Secondary Confirmation Tag | Typical Onset Pattern | Copilot Recommended Action |
|---|---|---|---|---|
| Combustion Air Deficit | Air-fuel ratio below target; combustion air flow tag declining | Flue O₂ reading below normal; flame appearance change | Gradual decline, often coincides with recuperator fouling cycle | Check recuperator differential pressure; inspect air damper position; review fan inlet condition |
| Fuel Pressure Drop | Burner manifold fuel pressure below setpoint in one or more zones | Gas header pressure trending down; valve position unchanged | Step-change drop, often linked to external supply event or regulator drift | Check fuel supply header pressure; inspect pressure regulator; verify burner control valve position vs. demand signal |
| Soak Dwell Reduction | Extraction rate above scheduled thermal load target | Soak zone thermocouple readings uniform — surface temp OK, core underheated | Appears at schedule acceleration; discharge temp lags heating response | Reduce extraction rate to match current heat input; review production schedule vs. furnace thermal capacity |
| Air Infiltration (Negative Furnace Pressure) | Furnace draft tag at or below atmospheric; elevated during discharge door open cycles | Cold zone thermocouple readings near floor level dropping; scale formation increase | Episodic, worsens with high extraction frequency or door seal wear | Adjust draft control to restore positive furnace pressure; inspect door seals and skid openings |
| Recipe / Setpoint Change | Zone temperature setpoint reduced in recent commit; deviation appears 1–3 transit times later | Recipe version change timestamp within attribution window; setpoint delta flagged | Delayed onset after parameter change; often attributed incorrectly to equipment issue | Review recipe change log; confirm whether setpoint change was intentional for current grade; revert if unintended |
Where Traditional Furnace Troubleshooting Breaks Down — and What Plant Copilot Changes
The operational gaps that slow discharge temp diagnosis are structural, not individual. They exist because the data required for multi-variable correlation lives across systems that were never designed to communicate with each other — and because the engineer doing the diagnosis has to build the correlation manually, from scratch, on each occurrence. iFactory closes these gaps by connecting those data sources through a single Copilot interface that any qualified engineer can query in plain language.
Sequential Manual Data Access
Combustion air, fuel pressure, soak time, and recipe records live in separate systems. Manual sequential access extends diagnosis time to 45–90 minutes — during which the furnace continues discharging off-spec material. Plant Copilot queries all five layers simultaneously from a single prompt.
Zone-Level vs. Header-Level Monitoring
Header-level fuel and air pressure averages can mask a zone-specific burner or damper issue that is driving the discharge deviation. Plant Copilot queries tag data at the zone and burner-manifold level, not just the header, so localized causes are visible.
Undocumented Recipe Changes Across Shifts
Setpoint adjustments made by the previous shift are frequently undocumented in the diagnosis workflow because they happened before the current engineer's shift started. Plant Copilot automatically checks the recipe version log within the attribution window regardless of which shift made the change.
No Ranked Causal Attribution
Even when an engineer identifies multiple deviating variables, manually determining which one is the primary driver requires experience and judgment that varies by individual. Plant Copilot returns a ranked probable-cause list with supporting evidence from each data layer, standardizing the diagnostic output across every shift team.
Expert Perspective: Why Furnace Discharge Temp Diagnosis Needs Multi-Variable AI, Not Better Alarms
"I have been doing combustion engineering and furnace optimization work at U.S. steel and aluminum rolling facilities for nineteen years. The most persistent frustration I encounter — at every facility, regardless of how sophisticated their controls are — is the diagnosis latency problem. A discharge temperature alarm fires. The process engineer goes to the combustion control HMI. Fuel pressure looks fine. Air-fuel ratio looks acceptable. They go to the historian. Soak zone temps are within range. They check with the previous shift. No one mentioned a recipe change. Forty minutes later, someone notices that the zone 3 burner manifold pressure has been two psi low since the 6 AM shift change — a zone-level detail that the header-level display was averaging away. The entire diagnostic process was manual, sequential, and depended on knowing which screen to look at next. What a platform like iFactory's Plant Copilot changes is not the engineering knowledge required to interpret the finding. It changes who has to do the data retrieval work. When the Copilot surfaces the zone 3 manifold pressure deviation in the first response to the question — alongside the combustion air ratio for that zone, the soak time record, and the recipe log — the diagnosis is available to any qualified operator on any shift, not just the engineer who has been troubleshooting this particular furnace for a decade."
— B. Reyes, PE — Senior Combustion Systems Engineer, Reheat and Heat Treatment Furnaces, Rolling Mill Operations, 19 Years
Conclusion: The Diagnostic Data for Every Discharge Temp Drop Is Already in Your Historian
Every reheat furnace discharge temperature deviation leaves a multi-variable evidence trail in the process data — combustion air ratio dropping before the temp decline registered, fuel manifold pressure declining in zone 3 while the header showed normal, a recipe setpoint change committed at 05:47 that produced a discharge effect at 07:30, a soak zone dwell reduction that occurred when the extraction rate was accelerated without a corresponding increase in heat input. The data to diagnose each of these conditions is already being recorded in your historian and your combustion control system right now. What has been missing is an AI layer that retrieves all of it simultaneously, correlates it against the discharge temperature timeline, and returns a ranked causal attribution to the process engineer who needs to act.
iFactory's Plant Copilot delivers exactly that: a single natural-language query interface that pulls combustion air, fuel pressure, soak time, furnace pressure balance, and recipe change records simultaneously — and returns a structured diagnosis in under fifteen seconds. The result is a process engineering team that resolves discharge temperature deviations in minutes rather than hours, on every shift, regardless of which engineer is on duty. The diagnostic capability your facility needs already exists in your process data. Plant Copilot connects the engineer to it.
Frequently Asked Questions: Furnace Discharge Temp AI Diagnosis
Plant Copilot simultaneously queries the combustion air flow and air-fuel ratio tags, fuel supply pressure at the burner manifold level, soak zone dwell time and extraction rate records, furnace draft pressure history, and the recipe version log — returning all findings correlated against the discharge temperature timeline in a single ranked response.
No — iFactory connects to existing combustion control historians, PLC networks, and furnace SCADA systems via OPC-UA and standard industrial protocols, reading tag data without replacing or modifying any existing control infrastructure. Most reheat furnace integrations are completed within 3–5 weeks of go-live. Book a Demo to confirm compatibility with your specific furnace control platform.
Yes — iFactory maintains a continuous recipe version ledger with timestamps and parameter deltas, and Plant Copilot checks this log within the configurable attribution window for every discharge temp query regardless of which shift made the change, surfacing setpoint changes that the current engineer would have no other way of knowing about.
The two causes produce distinct tag signatures: an air deficit shows as air-fuel ratio below target with unchanged fuel pressure, while a fuel pressure drop shows as burner manifold pressure declining with the air-fuel ratio controller compensating by reducing air proportionally — Plant Copilot reads both tag sets simultaneously and ranks the primary cause by which deviation preceded the discharge temp decline and by which has the larger statistical contribution to the observed temperature change.
Yes — every confirmed diagnosis where an engineer validates the Copilot's ranked cause and closes the corrective action is written back to the correlation model as a labeled event for that facility's specific furnace, progressively improving the accuracy of causal ranking and reducing false-positive candidate causes as the model learns each furnace's characteristic deviation patterns.