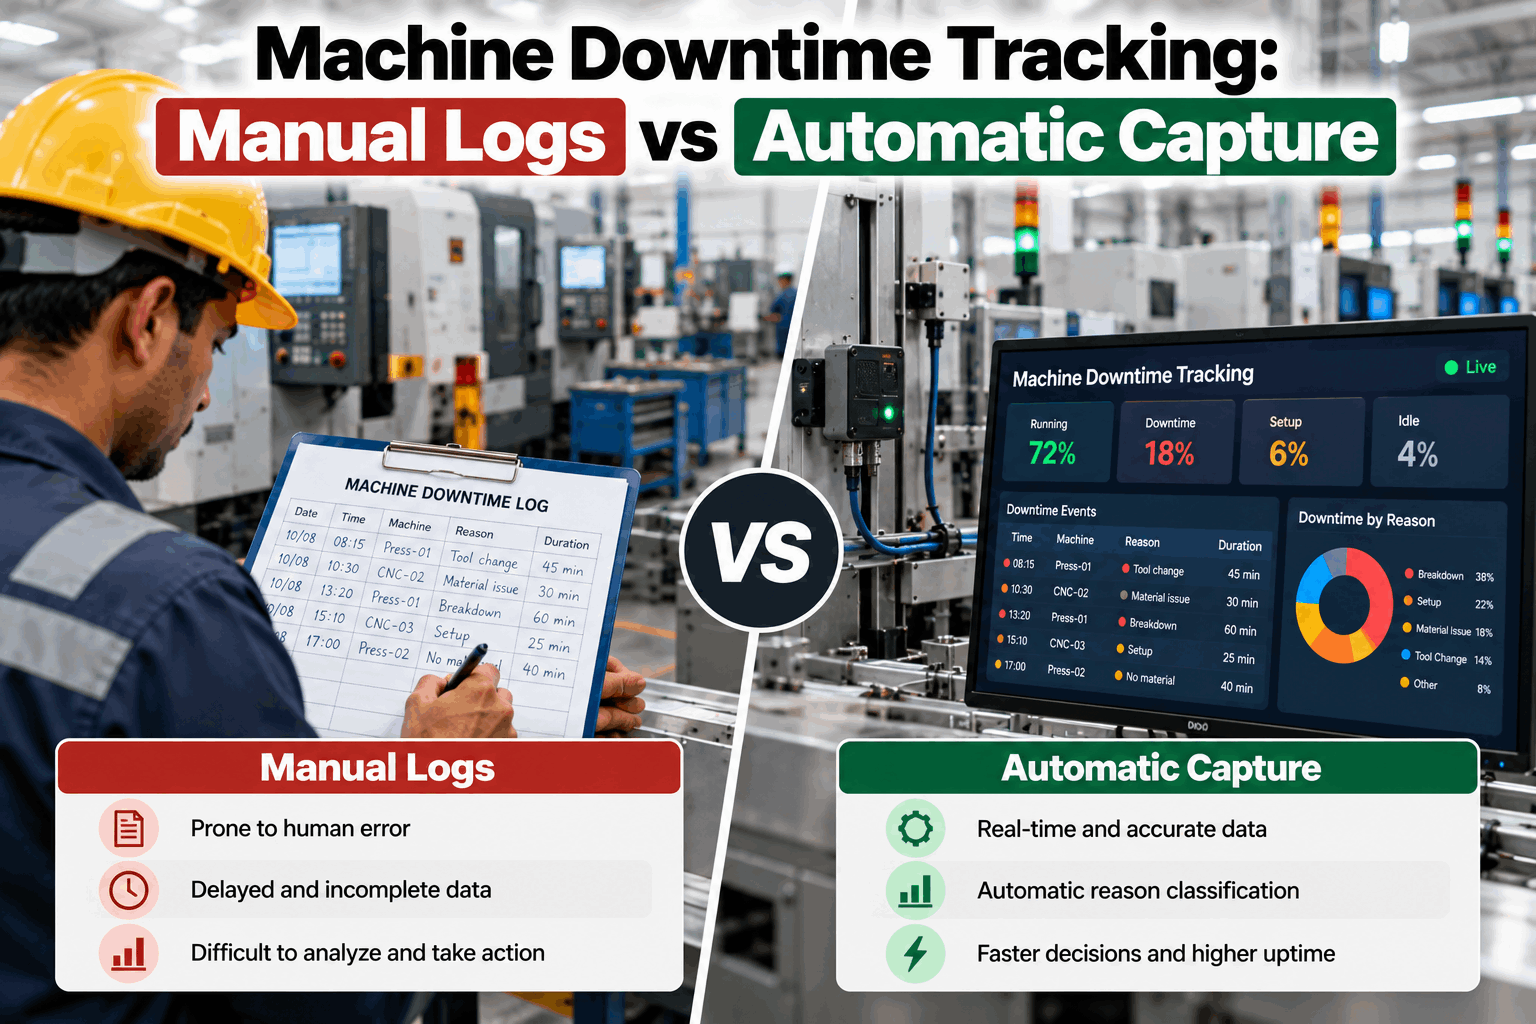
Ask three shifts why Line 4 stopped last Tuesday and you may get three answers, or none at all. The log says 26 hours of downtime this week, yet the machine was idle for much longer. Short stops were never written down, a few start times were rounded to the nearest quarter hour and one shift filled in the sheet from memory at the end of the day. Manual logs are cheap to start and easy to understand, but they can only record what people notice and remember. Automatic capture records every stop from the machine itself, then asks the operator for the one thing a machine cannot know: why it stopped. This guide compares manual logs and automatic capture across accuracy, effort and use cases, and shows how to measure the return. To see it on your own line, book a downtime tracking walkthrough.
Machine Downtime Tracking: Manual Logs vs Automatic Capture
A practical comparison for operations and reliability teams: where manual logs lose time and detail, what automatic capture records on its own and which approach fits which line.
- Where manual logs lose time and detail
- What automatic capture records without anyone typing
- Which approach fits which line, and what it is worth
Three causes explain more than 80% of the gap. The dashed line marks where the cumulative share passes 80%. Manual logs are rarely dishonest, they simply cannot see short stops and they depend on memory.
What Downtime Tracking Really Is
Downtime tracking records when a machine stopped, for how long and why.
With manual logs, operators write or type the start time, end time and reason into a sheet, a log book or a spreadsheet. With automatic capture, the machine's own signals, such as running state or a part counter, timestamp every stop without anyone typing. The operator then picks a reason from a short list. Both aim to answer the same question: where does the planned production time go? Our downtime analytics team can show how this looks on your own machine data.
Spot every stop
From the machine signal, not from memory.
Measure the length
Start and end, to the second.
Add the reason
Picked from a short, agreed list.
Fix the top causes
Ranked by hours lost and by value.
A machine can record the exact moment it stopped. Only a person can say that a film roll ran out or a guard was reset. The best downtime data uses each for what it does well.
Manual Logs vs Automatic Capture
The two methods differ most in what they can see.
Manual logs are low in cost and easy to start, which is why so many plants begin there. Automatic capture needs a signal from the machine, but removes most of the effort and most of the gaps. The table compares them across the points that matter. To see how your own logs compare with machine data, book a downtime data review.
A log kept by a careful operator can be a good record of long stops and their causes. What it cannot do is capture the many short stops that add up to hours, which is why the two sets of numbers rarely match.
Where Each Approach Fits
The right method depends on the line, not on the technology.
Automatic capture is not needed everywhere. A simple matching of method to situation avoids spending effort where it will not pay back, and puts it where short stops and shift differences hide the most loss.
Pick the line with the most frequent stops and the highest value per hour. That is where automatic capture shows the biggest gap against the manual log, and where the first fixes pay back fastest.
What Better Downtime Data Is Worth
Eight hours a week can look small on a chart. Multiplied by the share you can recover, a year of production and the contribution of a running line hour, it becomes a number worth acting on.
From Stop to Fix
The value of tracking is in what happens after the stop is recorded.
Capturing downtime is only the first half. The second half is ranking causes, assigning owners and checking that each fix worked. A good tracking system makes that loop short, so the same stop does not return every week.
Detect
Machine signal shows the stop.
Time
Start and end recorded.
Prompt
Operator asked for a reason.
Classify
Reason code attached.
Rank
Causes ordered by hours lost.
Fix
Owner assigned and result checked.
How to Measure the Return
Measure before you change anything, then measure again.
The return on downtime tracking comes from several places, and most of them can be measured with the data the system already collects. Agree the measures at the start, take a baseline of about four weeks and compare like with like.
When hidden downtime becomes visible, reported availability often falls. That is not a loss of performance, it is a more honest starting point, and it is the number every later improvement should be measured against.
Common Downtime Tracking Mistakes
Most weak programmes track plenty and fix little.
Both manual and automatic systems can produce numbers nobody uses. A few simple habits keep the data trusted and the actions moving.
Good practice
- Capture stop times from the machine, not from memory
- Keep the reason list short and agreed with operators
- Review the top stops with the floor every week
Common mistakes
- Trusting manual logs for short stops
- Using dozens of reason codes nobody can remember
- Treating the tracking tool as the fix itself
If operators enter reasons and never see anything change, the entries get careless. Show them the top stops each week and what was done about them, and the quality of the reasons improves.
How iFactory Downtime Tracking Works
Machine signals in, ranked causes out.
iFactory reads machine states and counters from your PLCs, SCADA or added sensors, timestamps every stop and asks the operator for a reason from a short list. It shows downtime by machine, line, shift and cause, ranks the top losses by hours and value, and feeds the figures into OEE. It runs on an on-prem server inside your network, with one view across lines and sites. Questions on fit go to our support desk.
Every stop
From PLC, SCADA or added sensors.
Operator reason
Short pick list, confirmed at the machine.
Top losses
By machine, line, shift and cause.
Fix and verify
Owners, dates and a check against the baseline.
Results depend on your lines, the signals available and how consistently reasons are entered. We measure the gap between manual logs and machine data on your own lines during the pilot, rather than promising a general figure.
Turnkey AI: Delivered, Connected and Live in 6–12 Weeks
You do not build this. It arrives ready.
iFactory ships as a pre-configured NVIDIA AI server with the software pre-loaded. Rack it, plug in power and Ethernet, and the AI is live on your network. Our team handles cabling, network setup, PLC, SCADA and sensor integration, team training and 24×7 remote monitoring. Data stays on your own network. For a scope matched to your lines, request a turnkey quote.
Ship, network and signals
Server installed. Machine signals connected for the pilot lines.
Reasons and baselines
Reason lists agreed with operators. Baseline against manual logs checked with your teams.
Go-live and training
Dashboards live. Teams trained. 24×7 remote monitoring begins.
Frequently Asked Questions
What is machine downtime tracking?
It is the recording of when a machine stops, for how long and for what reason, so that the biggest causes of lost production can be ranked and fixed.
Are manual logs ever good enough?
Sometimes. On a few machines with long, rare stops and clear causes, a well-kept log can be enough. On fast lines with many short stops, manual logs usually miss a large share of the lost time.
Do operators still enter reasons with automatic capture?
Yes. The machine records when it stopped, but not why. Operators choose a reason from a short list, which takes seconds and gives far more consistent data than free text.
Can older machines be tracked automatically?
Often, yes. If a running signal or part counter can be tapped, or a simple sensor added, the machine can be tracked. If not, start with a short manual log and add capture where it pays back.
How do we calculate the ROI of downtime tracking?
Take a baseline, then measure hours of downtime removed, short stops reduced and response time. Multiply recovered hours by the contribution of a running hour, and count it only if the hours are used.
How do we start?
With one line that has frequent short stops. A 6-week pilot connects the machine signals, agrees the reason list and shows the first comparison against your manual log. To plan it, contact our team.
See How Much Downtime Your Logs Miss
In thirty minutes we look at your logs, your machine signals and how you rank downtime today. You keep the notes whether or not you go further with iFactory.
- 1A week of manual downtime logs for one line
- 2The machine signals available, such as PLC tags or counters
- 3Your current list of downtime reason codes
- 4The contribution value of a line hour
- 5The line with the most short stops