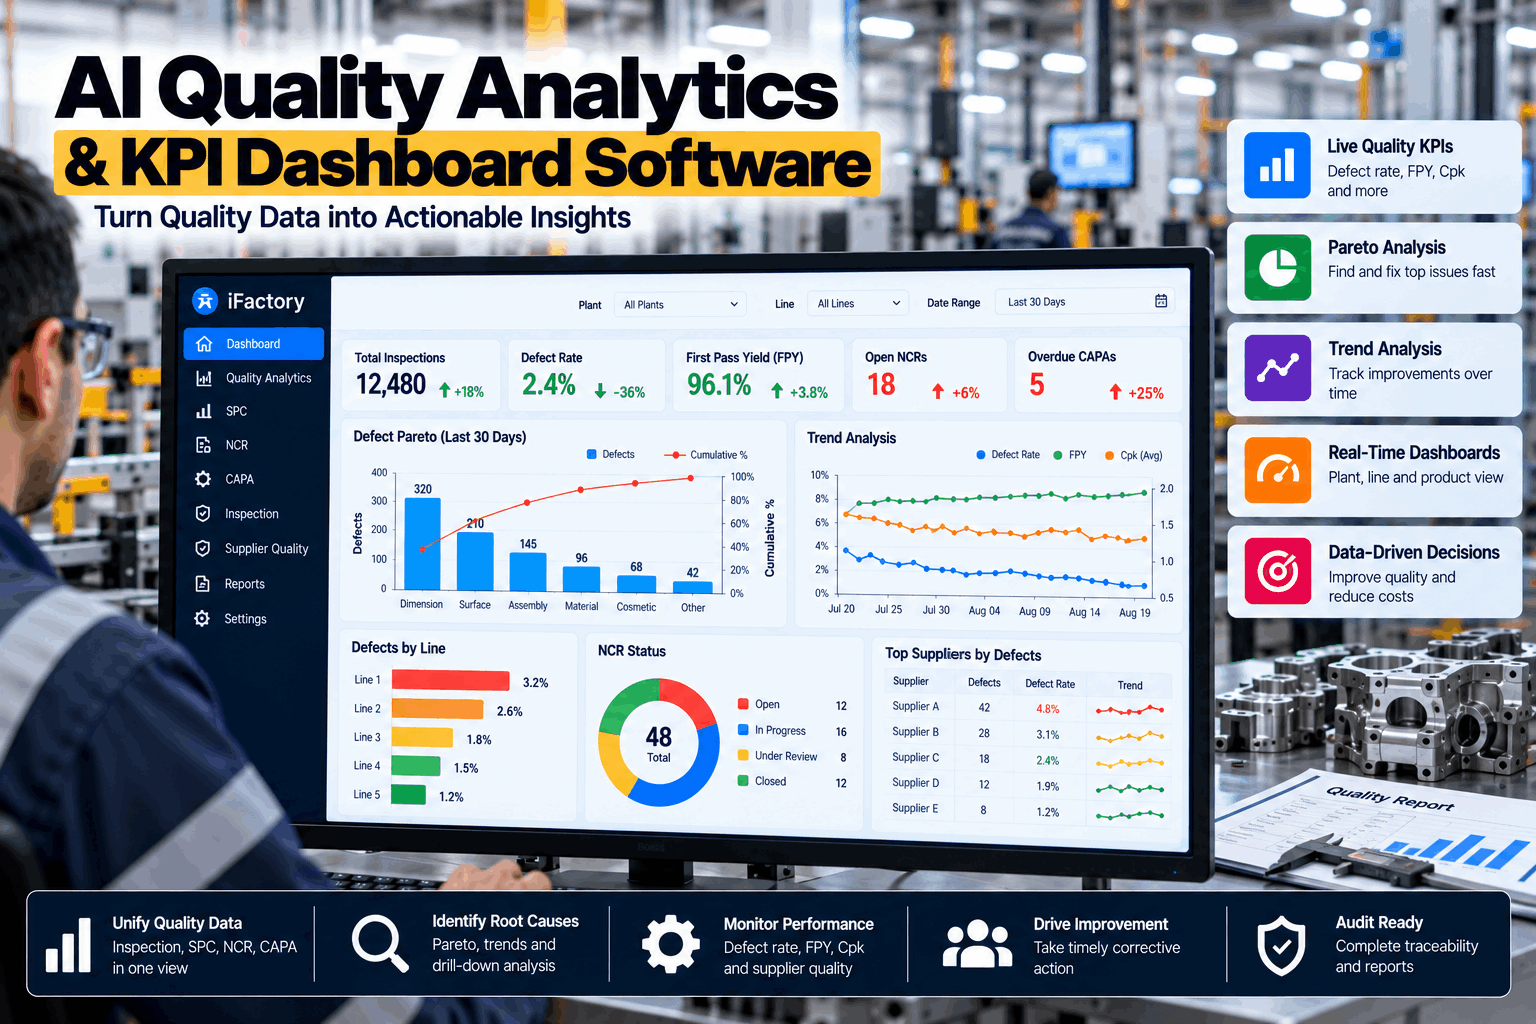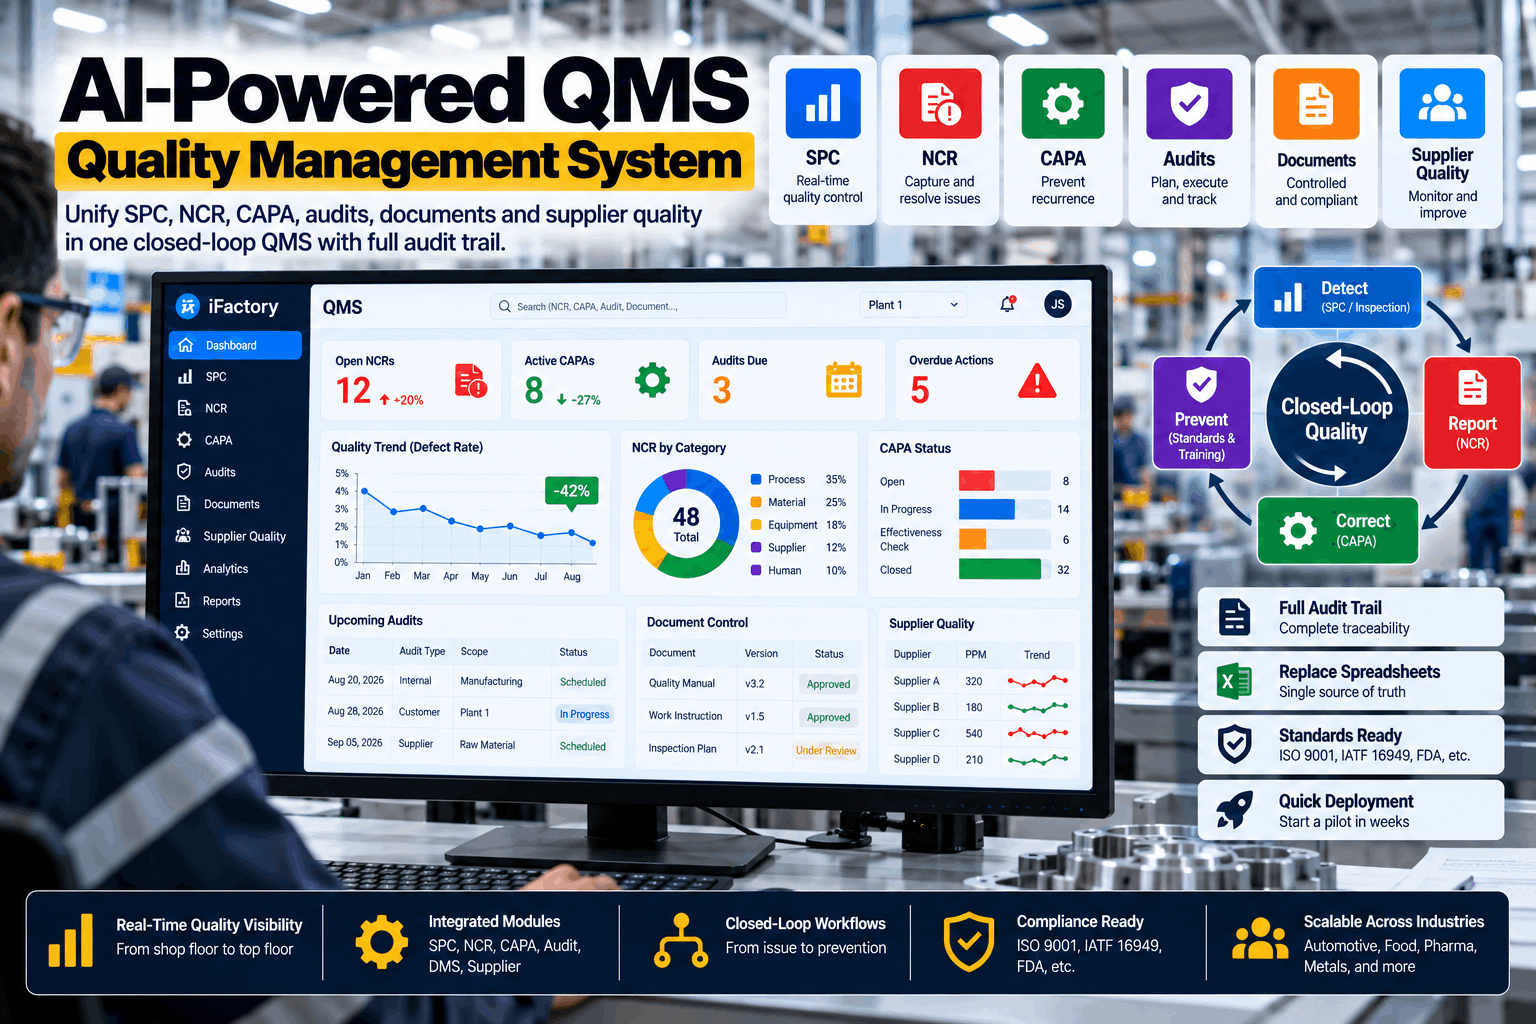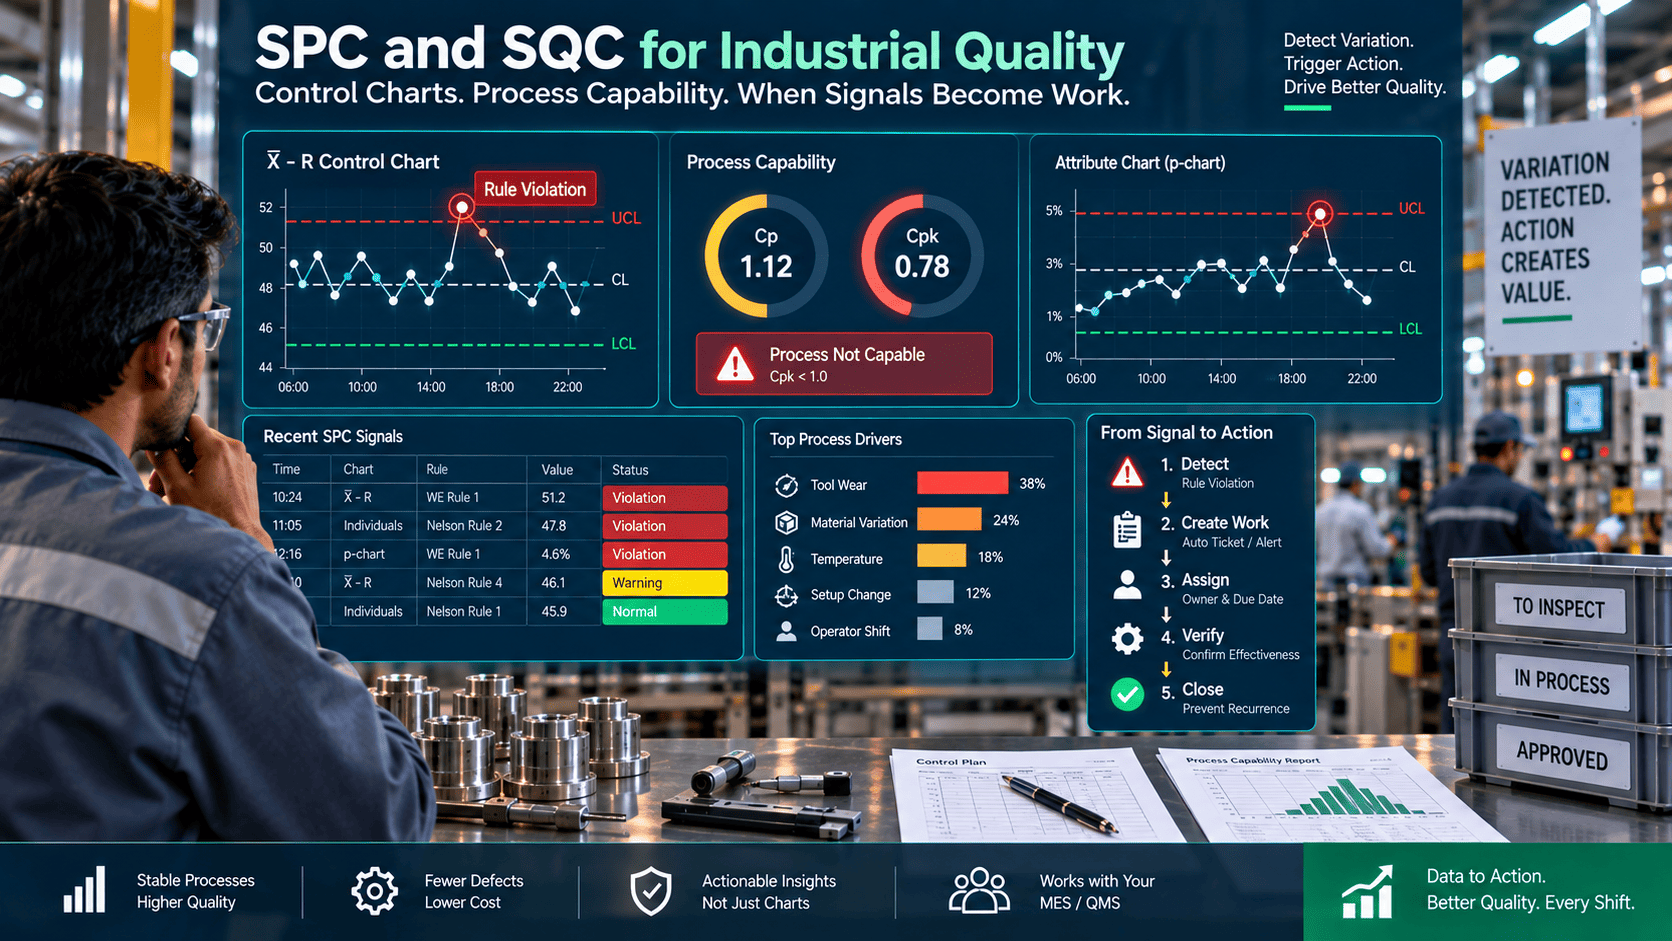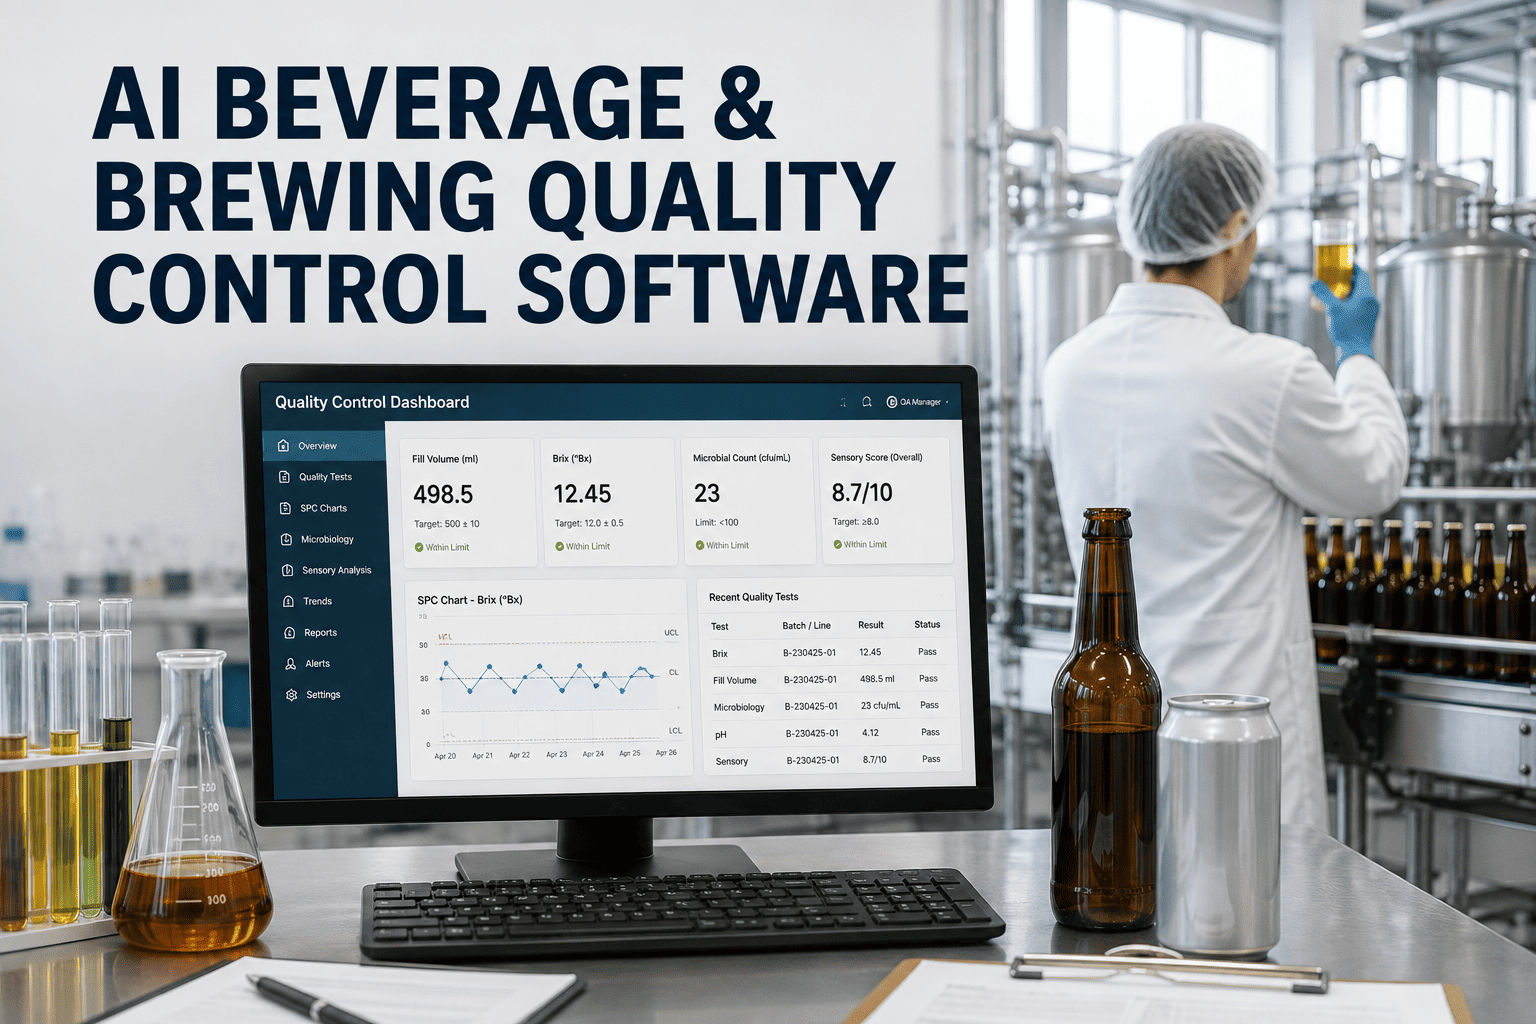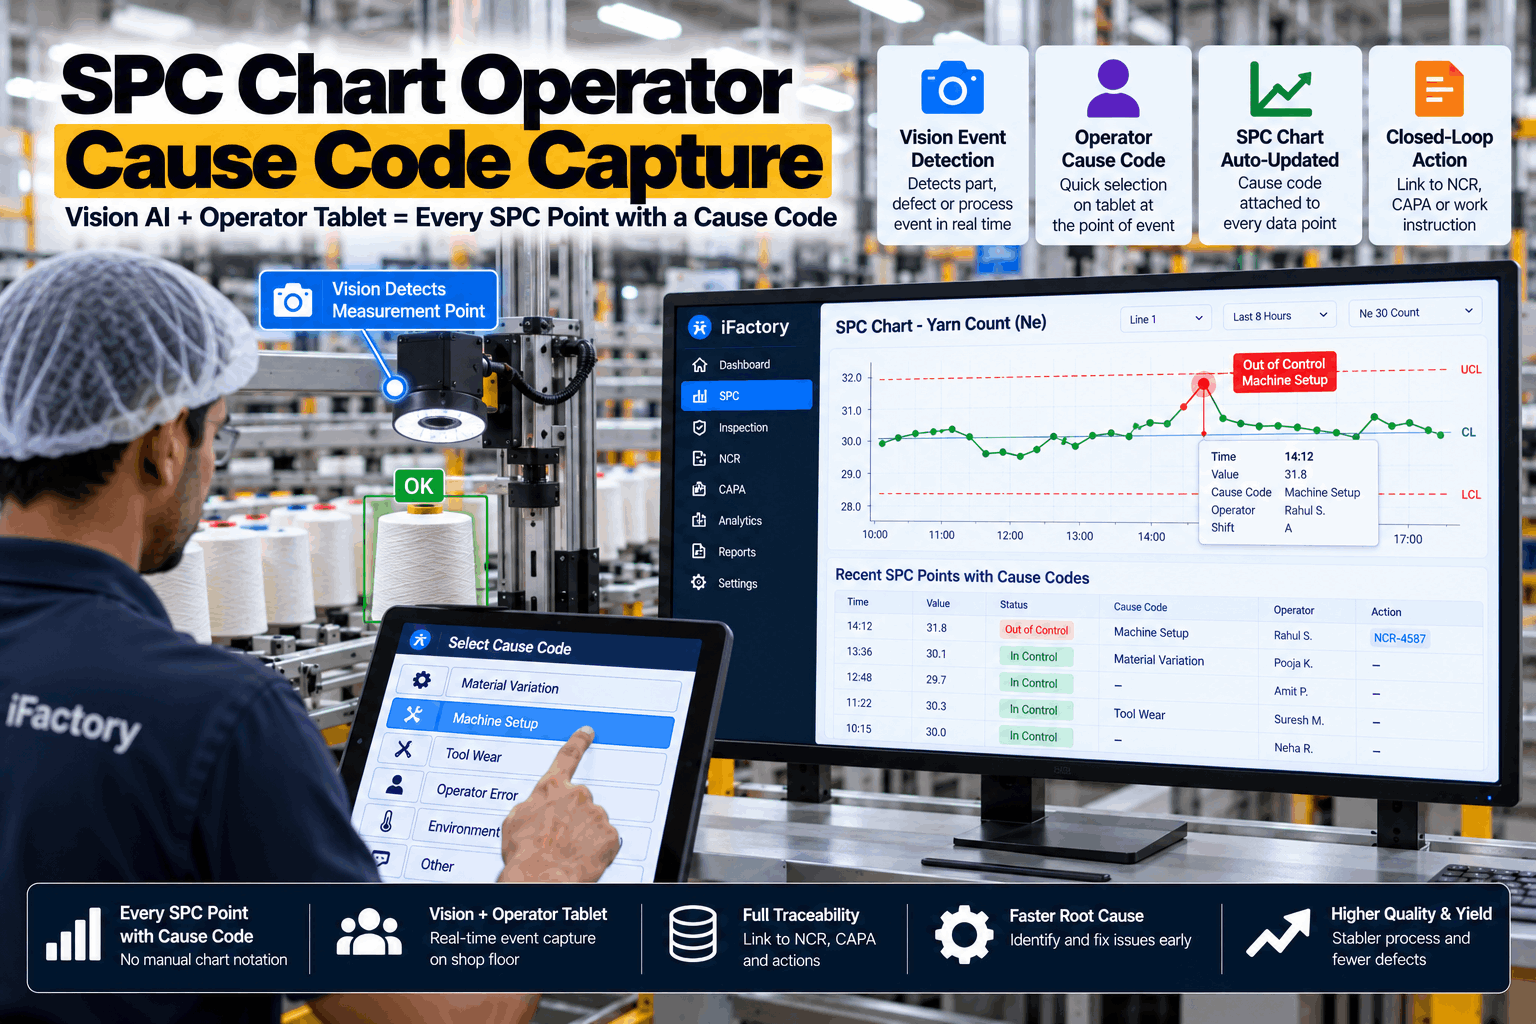
A control chart tells you when a process changed. It does not tell you why, and in most mills the why is a pencil note that never gets written, or a "cause: other" picked at the end of the shift. iFactory pairs two witnesses at every SPC point: cameras that log what happened at the machine — a doff, a creel change, a cover opened for maintenance — and an operator touchscreen that offers those events as likely causes the moment a signal appears. One tap attaches the cause code to the point, and the chart, the cause and the fix become one record. To see it on one of your own charts, book a working demo.
Every SPC Signal Answered With a Cause Code — Without Anyone Writing on the Chart
When a point breaks a rule, iFactory looks back through the camera's event log for that machine, ranks what changed, and asks the operator to confirm on a touchscreen. The cause code, the evidence and the corrective action stay attached to the point.
- Vision events time-stamped per machine
- One-tap cause confirmation at the station
- Cause, action and re-test linked to the point
A Signal Without a Cause Is Half a Record
Statistical process control was built on a simple loop: the chart signals, someone finds the assignable cause, the cause is removed, the process improves. The NIST engineering statistics handbook describes the engineer looking for an assignable cause by following the out-of-control action plan attached to the chart. In practice the loop breaks at the second step. A 2021 study of yarn count in a spinning mill found the ring department out of statistical control and the winding department in control — the charts did their job, and naming the causes was left as separate work. That gap is where most SPC programmes stall. If your charts are full of signals and short of explanations, our SPC team can review how causes are captured today.
Written later, from memory
The note is added at the end of the shift, or at the weekly review. By then three doffs and a lot change have blurred into one.
Free text nobody can count
"Roller issue", "rlr prob", "m/c fault". Three notes, perhaps one cause. Free text cannot be turned into a Pareto without someone reading every line.
"Other" as the top cause
A long code list on a small screen, with no evidence to choose by. The quickest honest answer is the last option on the list.
No link from point to fix
The chart is in the SPC system, the repair in the maintenance log and the re-test in the lab book. Nothing joins them when an auditor asks.
Why Every Signal Needs a Quick Answer — Including "No Cause Found"
A control chart will sometimes signal when nothing has changed. With the three-sigma rule alone, an in-control process gives a false signal about once in 370 points. Add the other three Western Electric run rules — codified in 1956 and still the basis of most SPC software — and the rate rises to about once in 91.75 points. Take a mill running 60 charts at 12 points a day: 720 points, around two chance signals a day on the first rule and nearly eight with all four. If each one demands a paragraph of handwriting, operators learn to ignore the chart. If each takes one tap, and "no assignable cause found" is an honest answer that can be counted, the chart keeps its authority. To size this for your own charting volume, book a signal review.
Two Witnesses at Every Point: the Camera and the Operator
Cameras at the machine do not measure quality. They record events: things that happened, at a time, on a machine. That is exactly the evidence an out-of-control point lacks. The operator supplies what a camera cannot — judgement about which event mattered and what was done about it. Our vision engineers can map which events are worth detecting on your machines.
Events logged
Cameras log doffs, creel and lot changes, can changes, cleaning, covers opened and maintenance access, each with machine and time.
Signal fires
A point breaks a run rule, whether it comes from an inline sensor or from a lab result entered against the machine.
Look back
iFactory gathers the events on that machine inside a look-back window set for the characteristic, and ranks them.
Operator confirms
The touchscreen shows the ranked candidates. The operator taps one, or "no assignable cause found", and adds the action taken.
Loop closed
The next in-control point closes the signal. Cause, evidence, action and re-test stay attached to the chart.
- The camera proposes, the operator decides. A cause code is never attached to a point without a person confirming it.
- Ranked by evidence. Candidates are ordered by how close they are in time, whether they are on the same machine, and whether that kind of event has explained this kind of signal before.
- Always a way out. "No assignable cause found" and "other" are each one tap, so nobody is pushed into a wrong code.
- Detail in their own words. A spoken or typed note can be added in the operator's language and is kept with the code.
Put Cause Capture on One Section in Six Weeks
Choose one group of machines. We connect your existing charts and limits, fit cameras for the few events that matter most, trim your cause list to one screen, and report signals, causes and time-to-answer every week.
A Cause Code Structure Operators Can Use in One Tap
The familiar categories still work. What changes is that each one arrives with evidence, and that not every cause needs a camera — humidity comes from a sensor, a shift handover from the roster. The examples here are for a spinning or weaving mill and are meant as a starting list, not a standard. To build the list around your own process, book a code workshop.
Keep the list short. A cause list an operator can scan in a few seconds — two levels, a few dozen codes at most — gets used. A list of two hundred gets "other".
What the Chart Looks Like Afterwards
A coded chart is a different object from an annotated one. Each signal carries a small, structured record, and those records can be counted, compared and audited.
- A Pareto of causes. Which code accounts for most signals on each machine, section and product.
- Time to answer. How long a signal waits for a cause, and how long for the point that closes it.
- Repeats. The same cause after the same kind of event, which is a procedure problem and not a machine problem.
- An honest no-cause share. The proportion closed as "no assignable cause found", compared with what the run rules would produce by chance.
- Evidence on request. The images behind any confirmed event, for a customer or an auditor.
What the AI Adds Beyond the Tap
The first job of the models is to recognise events at the machine. The second is to learn, from every confirmation, which events tend to explain which signals. Both run on a GPU server in your mill, so images and process data stay on site.
- Better suggestions over time. Each confirmed cause teaches the ranking which event to offer first for that characteristic.
- Patterns across machines. The same cause appearing after the same event on several frames is flagged as one issue.
- A check on the chart itself. If far more signals are closed without a cause than chance would explain, the limits or the sampling may need review.
- Answers in plain language. SPC leads ask about signals, causes and machines and get the records behind the answer.
Pencil Notes, SPC Software Alone, and Vision Plus Touchscreen Compared
Conventional SPC packages already let an engineer assign a cause to a point by clicking on it and picking from a list. The feature exists; the difficulty is who uses it, when, and with what evidence. Our support team can compare this with the SPC system you run now.
Where Cause Capture Meets Your Audit
Mills supplying automotive customers — seat fabric, airbag fabric, tyre cord — work to IATF 16949, which expects significant process events to be recorded and a reaction plan to exist for characteristics that are out of control or not capable. ISO 9001 asks for the same discipline in broader terms through its clauses on analysis and corrective action. Buyer audits in apparel and home textiles increasingly ask what was done when a chart signalled. In each case the auditor's question is the one a paper chart cannot answer. These summaries paraphrase the standards; check the wording against your own copies.
Delivered as a Turnkey AI System — Hardware and Software Together
iFactory ships as a complete bundle: a pre-configured NVIDIA AI server, racked and ready, with the SPC, vision and AI software pre-loaded, plus the cameras and station touchscreens for your machines. Rack it, plug in power and Ethernet, and the AI is live on your network — images and process data stay in your mill. Our team handles camera mounting, cabling, network setup, PLC and SCADA integration, links to your lab and SPC systems, operator training and 24×7 remote monitoring. For a scoped proposal, book a deployment call.
Ship, network and data
Server delivered and racked. Cameras and touchscreens fitted on the first section. Charts, limits and cause list brought in. Event footage collected.
Model training and pilot
Event models trained on your machines. One section runs live: signals prompt the operator, causes are confirmed, results reviewed weekly.
Go-live and training
Remaining sections fitted. Operators, supervisors and SPC leads trained. Cause list and look-back windows handed over to your team.
Frequently Asked Questions
What is an assignable cause, and why give it a code?
An assignable cause is a specific, identifiable reason a process changed, as opposed to the ordinary variation that is always present. Recording it as a code instead of free text means causes can be counted, ranked and compared across machines and shifts, which is what turns a chart into an improvement tool.
Does the camera decide the cause?
No. The camera records events and the system ranks them as candidates. A cause code is attached only when an operator or supervisor confirms it, and they can always choose "no assignable cause found" or "other".
Which events can the cameras detect?
Typically visible, repeated events such as doffing, creel and can changes, lot trolleys arriving, cleaning, covers being opened and maintenance access. What is reliable depends on the machine and camera position, so the event list is agreed and tested on your machines during the pilot.
Do the cameras identify operators?
No. The models detect machine and material events, not identities, and face recognition is not used. Who confirmed a cause comes from the touchscreen login, in the same way as any other quality record.
Does it replace our SPC software?
It does not have to. iFactory can run its own charts, or attach cause records to signals from an existing SPC or lab system where that system can share its points and limits. Which route fits is settled during scoping.
What if no cause can be found?
That is a valid answer and it is recorded as one. Run rules produce some signals by chance, so a share of "no assignable cause found" is expected. The system tracks that share so you can see whether it is in line with chance or hiding causes nobody looked for.
How long does deployment take, and what do we need to provide?
A typical mill is live in 6–12 weeks. You provide rack space, power, an Ethernet connection, camera mounting points, your charts and limits, your current cause list and a process owner for the pilot section. iFactory supplies the pre-configured NVIDIA AI server, cameras, touchscreens, software, integration and training. To scope your mill, contact our project team.
Close the Loop Between the Chart and the Fix
One turnkey system — NVIDIA AI server, cameras, touchscreens, SPC and vision software, integration and training — delivered and live inside 12 weeks. Start with the section whose charts signal most and explain least.
- 1Which cause signals most often on each machine
- 2How long a signal waits for an answer
- 3Which events tend to come before trouble
- 4Whether the no-cause share matches chance
- 5Whether a fix stopped the repeat