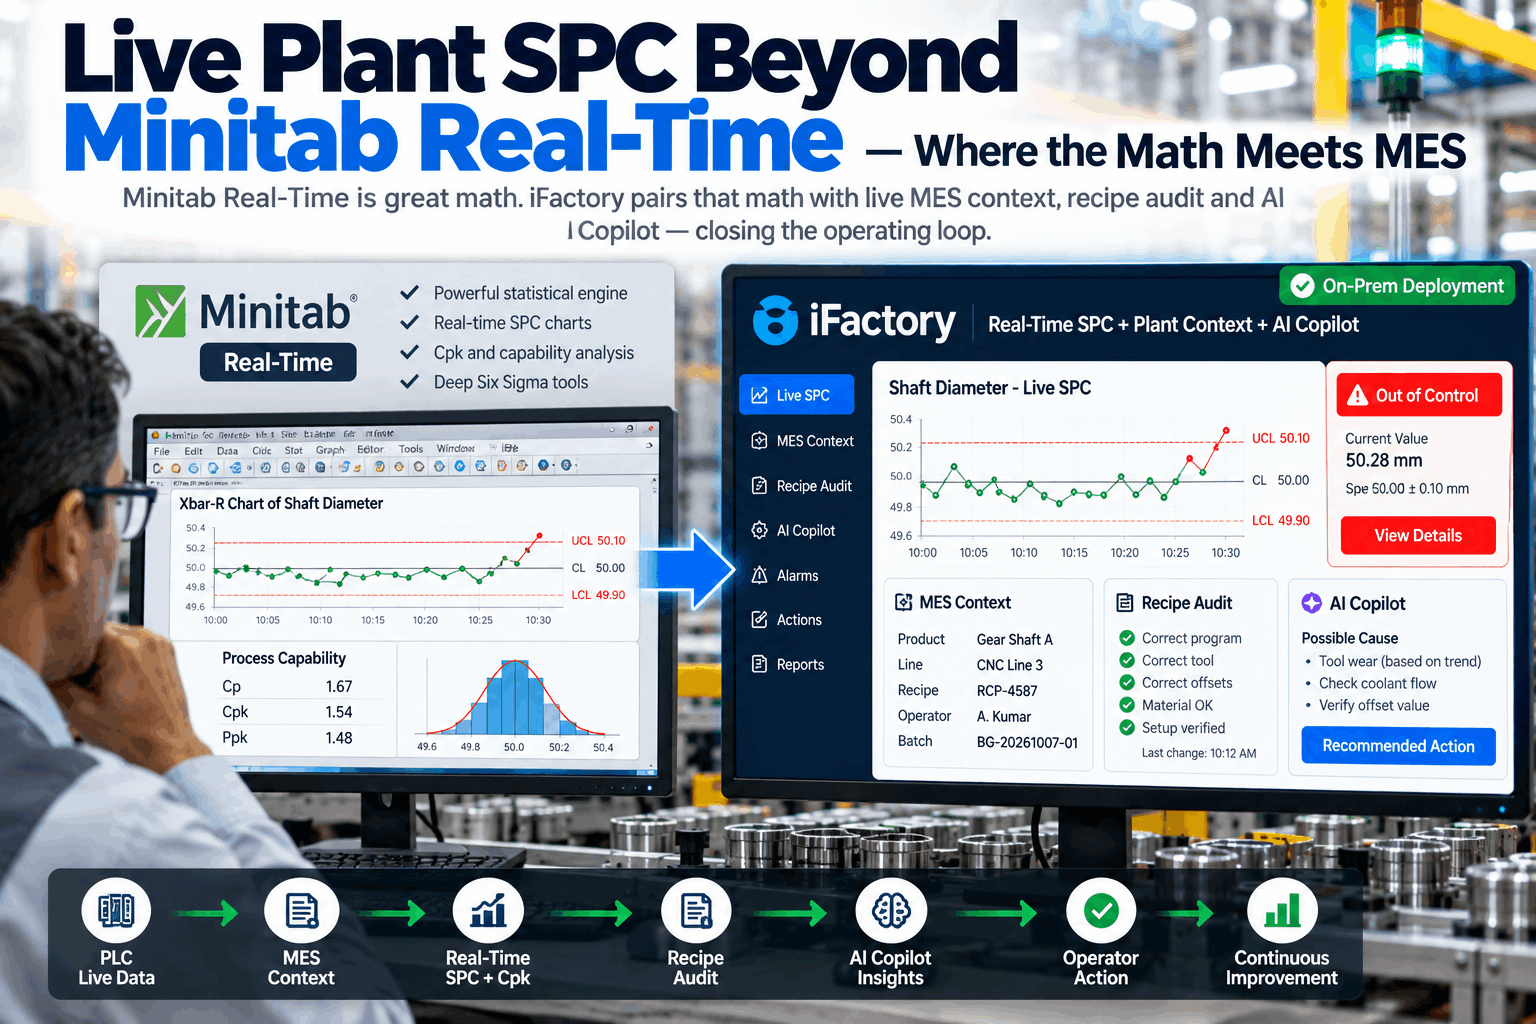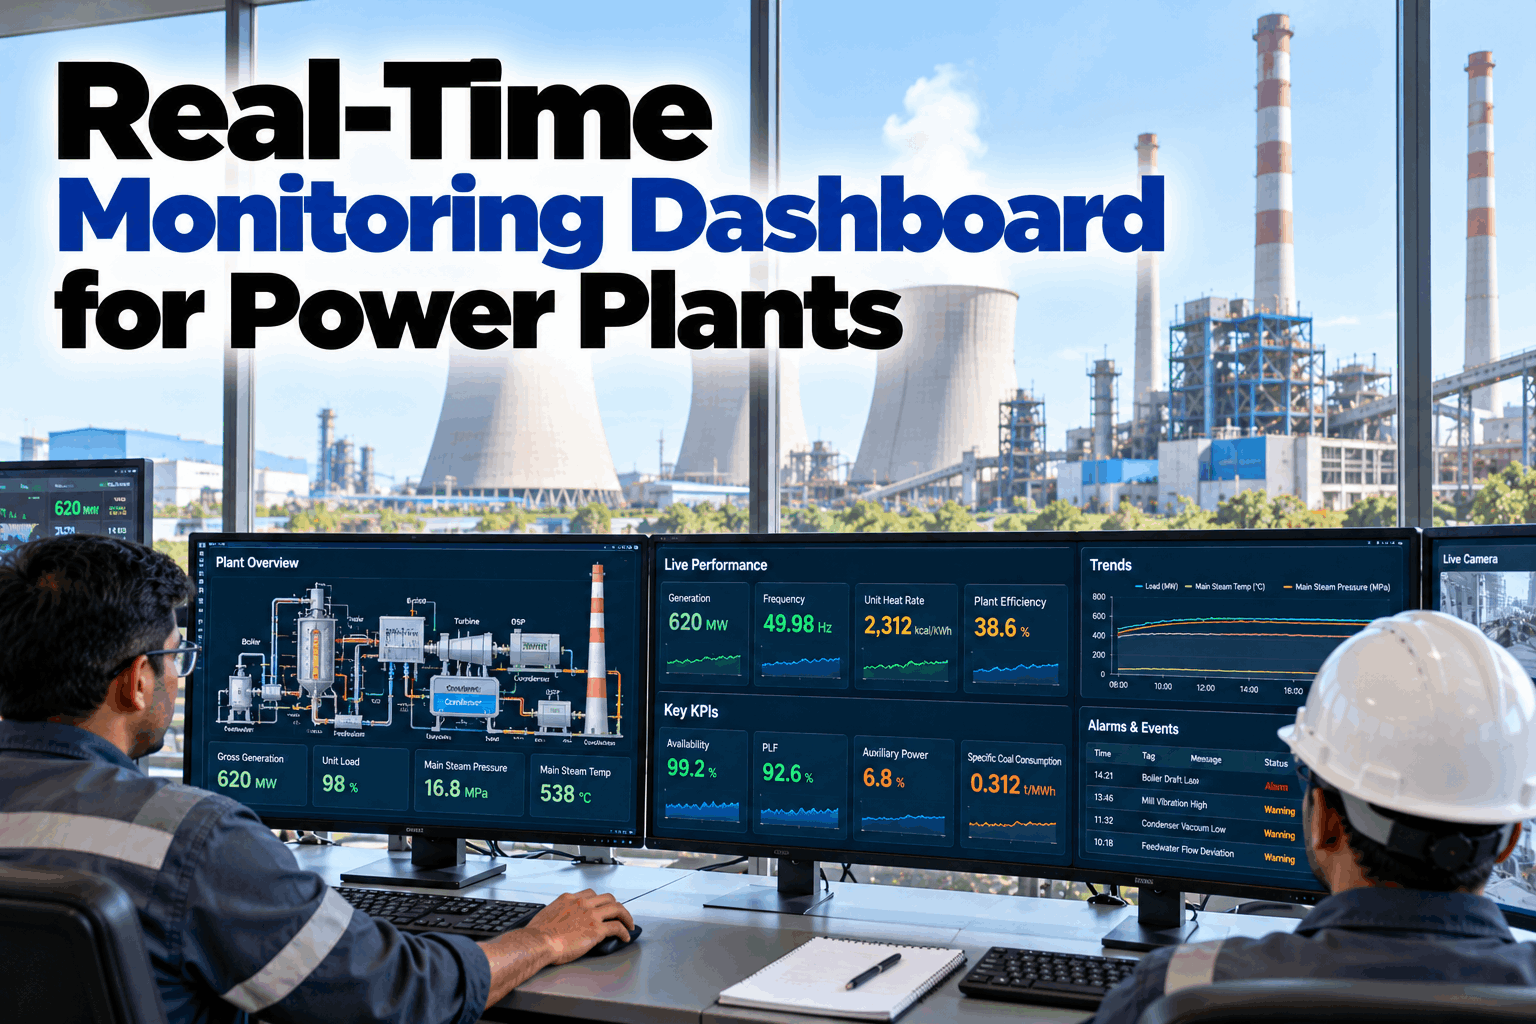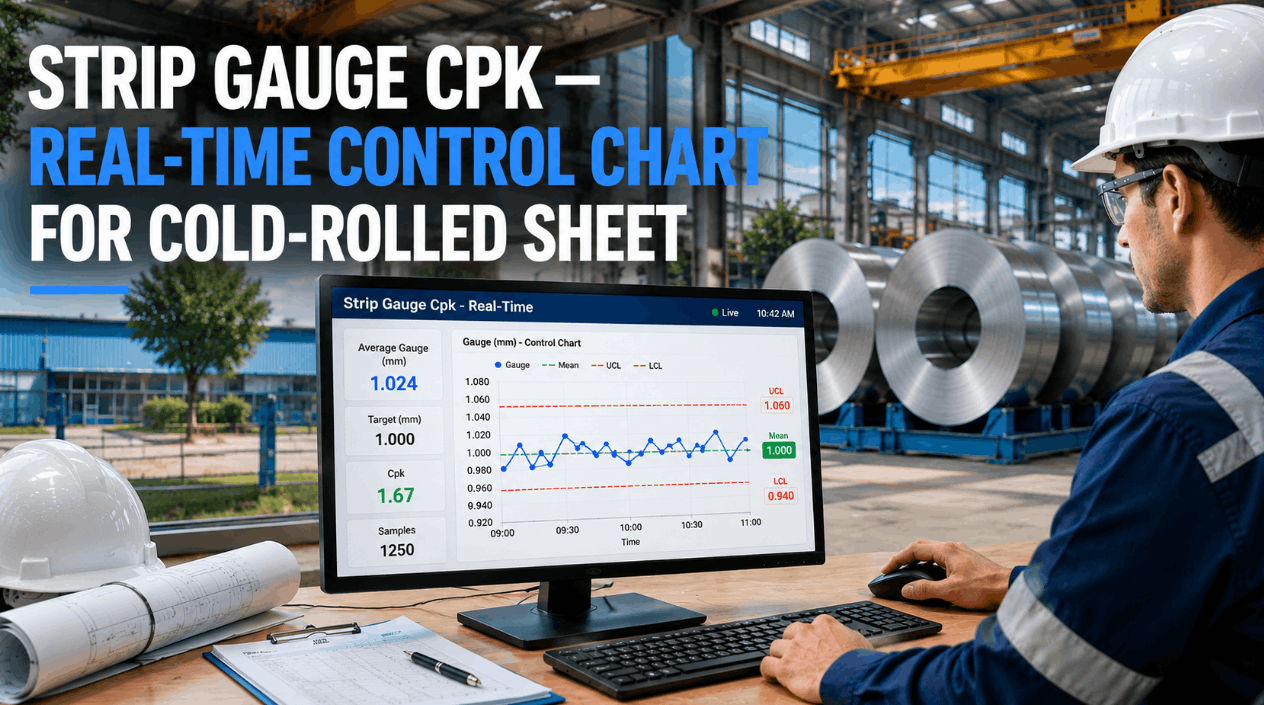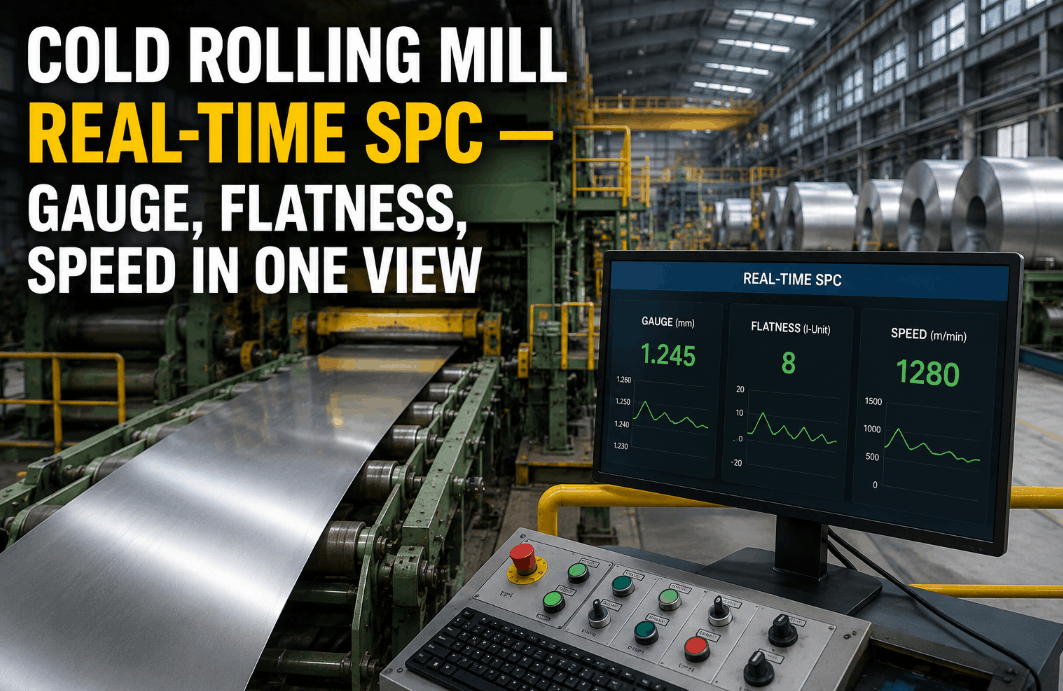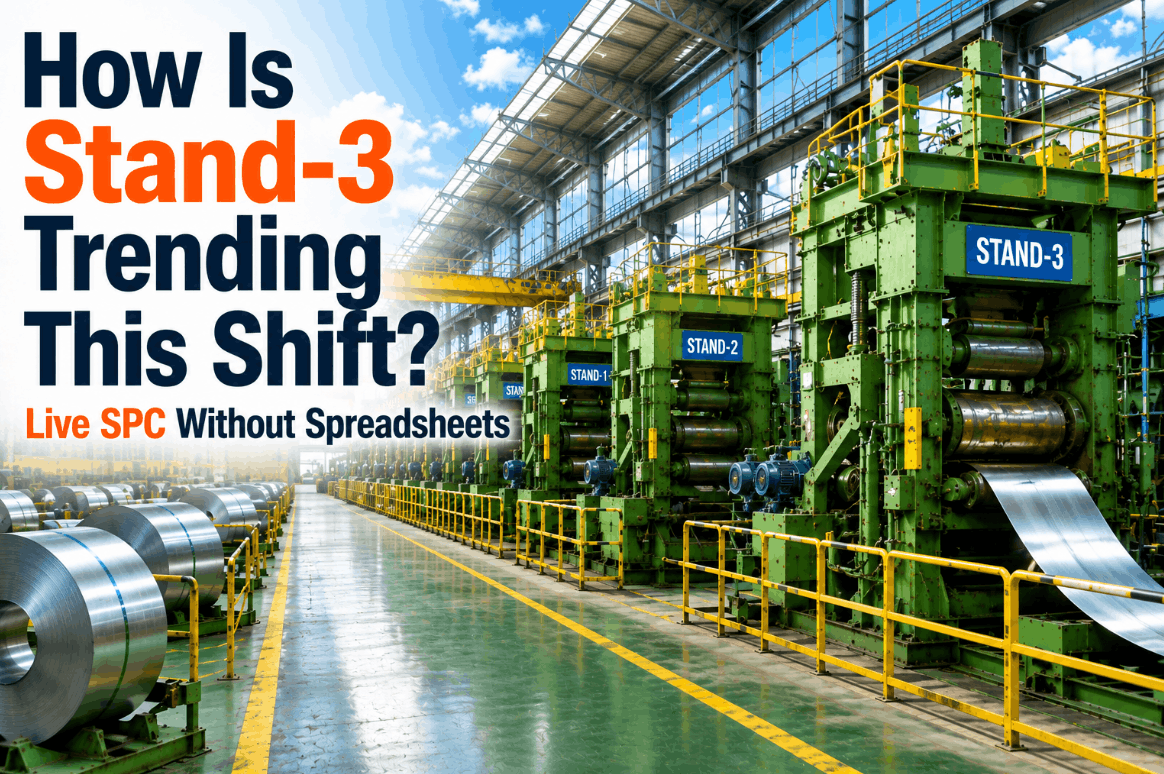
As a mill process engineer, you already know the question that follows every shift handover: How is Stand-3 actually trending right now? The honest answer, in most facilities, requires opening three spreadsheets, pulling a historian export, and mentally reconciling data from two separate systems—all before your morning coffee. iFactory's Plant Copilot eliminates that entire workflow. Ask the question in plain language, and the platform returns a live, shift-aware SPC summary for Stand-3—complete with the time-series control chart and the active rolling recipe—in under three seconds. No spreadsheets. No manual exports. No guesswork. Book a Demo to see per-stand SPC in action.
Why Per-Stand SPC Is the Missing Layer in Rolling Mill Quality
In a tandem cold or hot rolling mill, each stand performs a discrete reduction pass. Stand-1 may be running perfectly on gauge while Stand-3 is drifting toward its upper control limit on rolling force—a deviation that won't show up in final product inspection until it's already affecting flatness or surface finish three coils downstream. Aggregate mill-level SPC masks this reality. Process engineers need stand-level visibility: separate control charts per stand, per parameter, per shift.
Traditional approaches bury that data in historian archives accessed through desktop software. iFactory surfaces it conversationally. The Plant Copilot ingests real-time PLC and SCADA tag streams—roll force, roll gap, entry and exit tension, motor current, strip speed—and maintains live control charts at the stand level, updated coil by coil. When you ask about Stand-3, the system already has the Xbar-R chart, the Cpk value, and a shift-over-shift trend comparison ready to display. Book a Demo to explore the stand monitoring architecture.
The Stand Monitoring Gap: What Spreadsheets Can't Tell You
The core problem isn't data availability—modern PLCs generate enormous volumes of stand-level telemetry every second. The problem is access latency and context. By the time a process engineer exports historian data, loads it into Excel, and applies control limit formulas, the shift has moved on and the deviation window has passed. The following comparison illustrates how the traditional approach compares to iFactory's Plant Copilot workflow.
| Engineering Task | Traditional Spreadsheet Workflow | iFactory Plant Copilot |
|---|---|---|
| Check Stand-3 rolling force trend | Export historian CSV → paste into Excel → calculate UCL/LCL manually → plot | Ask "How is Stand-3 trending this shift?" → live Xbar-R chart returned instantly |
| Calculate Cpk for current shift | Gather sample data, apply STDEV formula, reference spec limits from a separate document | Cpk displayed automatically alongside SPC chart with recipe spec limits overlaid |
| Compare this shift vs. prior shift | Open multiple historian exports, align timestamps, create comparison charts manually | Shift-over-shift comparison generated in the same response panel |
| Identify out-of-control signals | Visual inspection of plotted data; depends on engineer's availability and attention | Western Electric rules applied automatically; out-of-control points flagged and explained |
| Link SPC results to active recipe | Manual cross-reference between quality system and process control documentation | Recipe parameters and grade spec limits automatically attached to every SPC response |
How Plant Copilot Delivers Live Stand-Level SPC
The architecture behind iFactory's per-stand monitoring is built on five integrated layers that transform raw PLC tag streams into actionable, shift-contextualized SPC intelligence. Understanding how data flows through the system helps process engineers evaluate fit and plan integration.
Stand-Tagged Data Ingestion
iFactory edge connectors read high-frequency PLC tags via OPC-UA or MQTT. Each tag—roll force, roll gap, interstand tension, strip speed, motor current—is mapped to its specific stand identifier (S1 through S6 or F-stands) and timestamped at source. No data is aggregated across stands during ingestion; stand identity is preserved through the entire pipeline.
Shift-Window Contextualization
The platform maintains awareness of the active production shift using the mill's scheduling data. When any query references "this shift," the system automatically scopes the analytical window to the correct time boundary—Day, Afternoon, or Night shift—without the engineer specifying timestamps. Shift transitions are handled automatically as schedules change.
Real-Time SPC Calculation Engine
Control limits (UCL, LCL, centerline) are calculated from the stand's own historical baseline for that parameter and grade combination. Cpk is computed continuously against the specification limits pulled from the active rolling recipe. Western Electric rules are applied in real time to detect trends, runs, and out-of-control signals as each new data point arrives from the PLC.
Recipe and Grade Context Overlay
Every SPC output is automatically enriched with the active rolling recipe: target reduction per pass, roll force set points, and grade-specific tolerance windows. When Stand-3's rolling force begins trending toward the upper control limit, the engineer sees not just the raw deviation but exactly how far it is from the recipe target and the specification boundary—in the same answer panel.
Natural-Language Delivery via Plant Copilot
The processed SPC result is delivered through the Plant Copilot interface—accessible on desktop, tablet, or mobile. The response combines a rendered time-series control chart, a plain-language shift summary ("Stand-3 rolling force has been trending upward for the past 14 coils; Cpk is currently 1.12, down from 1.38 at shift start"), and a direct link to the full stand dashboard for deeper investigation. Book a Demo to see a live Copilot session.
Stand Parameters Monitored: What Goes Into the SPC Chart
Per-stand SPC is only as useful as the parameters being monitored. iFactory's stand-level framework tracks the full set of process variables that drive gauge, flatness, and surface quality outcomes in both hot and cold rolling applications.
Shift-Aware SPC: What Makes the Trend Context Different
The word "shift" carries a specific meaning in rolling mill operations that generic SPC software ignores. A shift boundary is not just a time delimiter—it corresponds to a crew change, a potential recipe change, and often a change in coil grade mix. iFactory's shift-awareness handles all three dimensions simultaneously.
When a crew change occurs mid-campaign, a standard SPC chart spanning multiple shifts will show an apparent process shift that is actually a deliberate recipe change for the incoming grade mix. Without shift context, that "shift" looks like an out-of-control event. iFactory's Plant Copilot segments the SPC analysis by shift boundary and recipe version simultaneously, so process engineers see the trend within the correct operational context—not a blended picture that merges two different production conditions into a single misleading chart.
- SPC charts span multiple shifts and recipe versions
- Control limits calculated from mixed production conditions
- Recipe changes flagged as false out-of-control signals
- Cpk meaningless when grades change mid-chart
- Engineer must manually filter and re-scope data before analysis
- SPC windows automatically scoped to active shift and crew
- Control limits recalculated per grade and recipe version
- Recipe changes segmented; no false alarms at transition points
- Cpk computed against grade-specific tolerance, not a global spec
- Engineer receives a clean, pre-contextualized chart in three seconds
Expert Review: A Process Engineer's Assessment
"The frustration with mill stand quality monitoring has never been the data—it's always been the friction between the data and the answer. You know the PLC is logging every roll force measurement. You know the SCADA historian has everything. But getting from 'I need to know how Stand-3 is performing right now' to an actual control chart with Cpk against today's recipe has historically required fifteen minutes and four software tools. What iFactory's Copilot does is collapse that entire process into a single conversational question. The shift context is already there. The recipe limits are already overlaid. The out-of-control signals are already flagged. For a process engineer covering five stands across a full shift, that kind of instant, contextualized access isn't a convenience—it's a fundamental change in how you manage process capability in real time." — Process Quality Engineer, North American Flat-Rolled Steel Producer
Conclusion: Real-Time Stand SPC Is a Process Engineering Standard, Not a Luxury
The gap between the data your rolling mill generates and the insight your process engineers can access in real time is a measurable quality liability. Every shift where Stand-3's Cpk trends downward without a timely process correction is a shift where out-of-tolerance coils accumulate, rework costs rise, and the root cause becomes harder to isolate. iFactory's Plant Copilot closes that gap by delivering live, stand-level SPC—shift-scoped, recipe-linked, and accessible in plain language—without requiring any change to existing historian or PLC infrastructure.
For U.S. manufacturing facilities competing on tight gauge tolerances and high-grade product mixes, per-stand real-time SPC is no longer an advanced capability reserved for greenfield automation projects. It is the baseline expectation for any process engineer trying to maintain process capability across a full campaign. Book a Demo to connect your mill stands to iFactory's live SPC engine and ask Stand-3 how it's trending—right now.
Frequently Asked Questions
Does iFactory require replacing our existing historian or SCADA system?
No. iFactory connects to your existing OPC-UA or MQTT data streams as a read-only layer, pulling stand-level tag data without modifying or replacing any existing control or historian infrastructure.
How does the Plant Copilot know which shift is currently active?
iFactory ingests your mill's shift schedule during onboarding and continuously references it to scope SPC queries to the correct time window, crew, and production sequence automatically.
Can the system monitor all stands simultaneously, or only one at a time?
iFactory monitors all configured stands—F1 through F6 or equivalent—simultaneously in real time; the Copilot simply surfaces the stand-specific view you query at any given moment.
How are control limits calculated—can our reliability team customize them?
Control limits are calculated from each stand's historical baseline per parameter and grade combination, and your engineering team can configure specific specification limits and Cpk thresholds through the no-code dashboard.
Does iFactory integrate with SAP or other ERP systems for quality record keeping?
Yes. iFactory can synchronize stand-level SPC events, Cpk records, and out-of-control flags back to SAP or Oracle ERP for traceability and quality documentation without manual data entry.