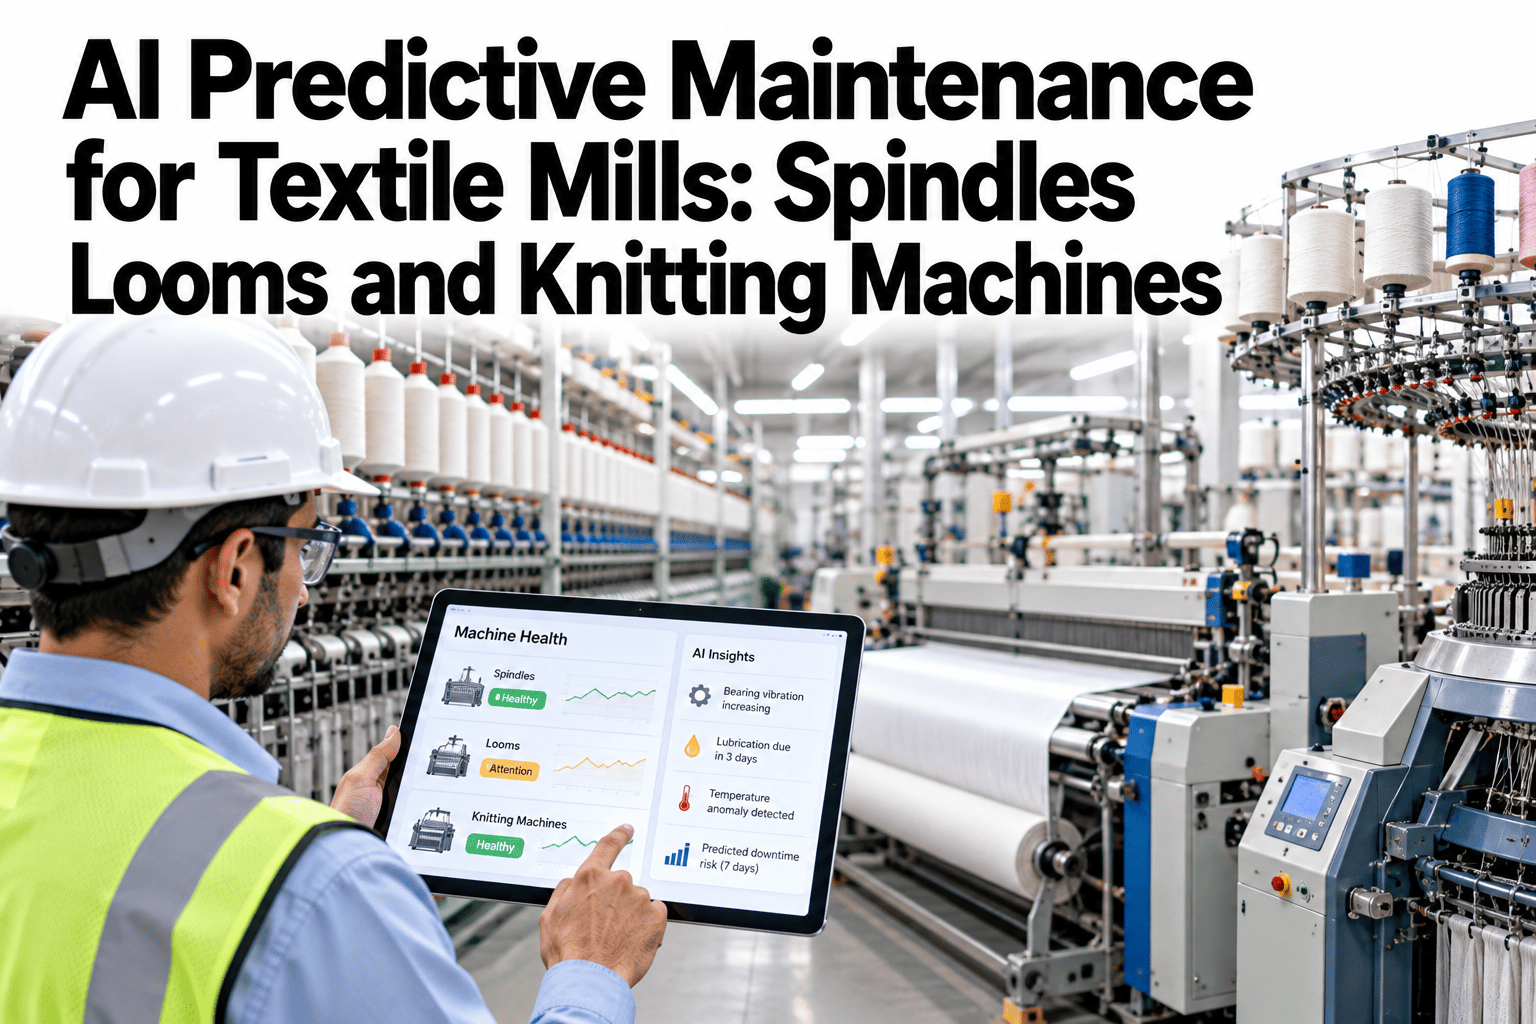
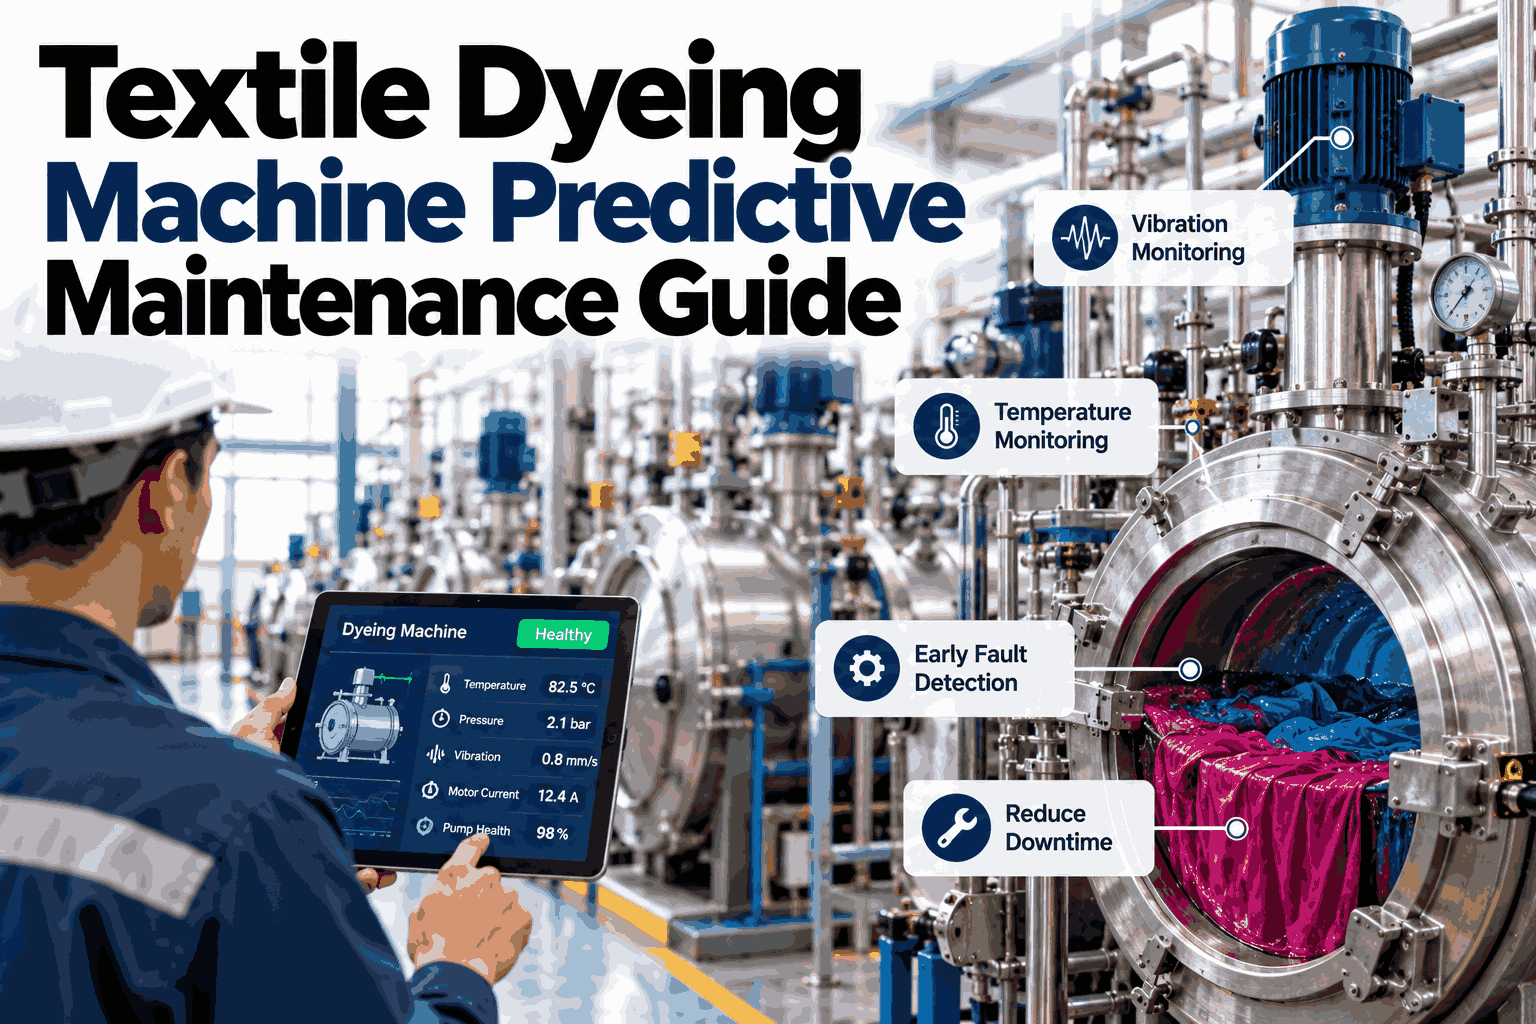
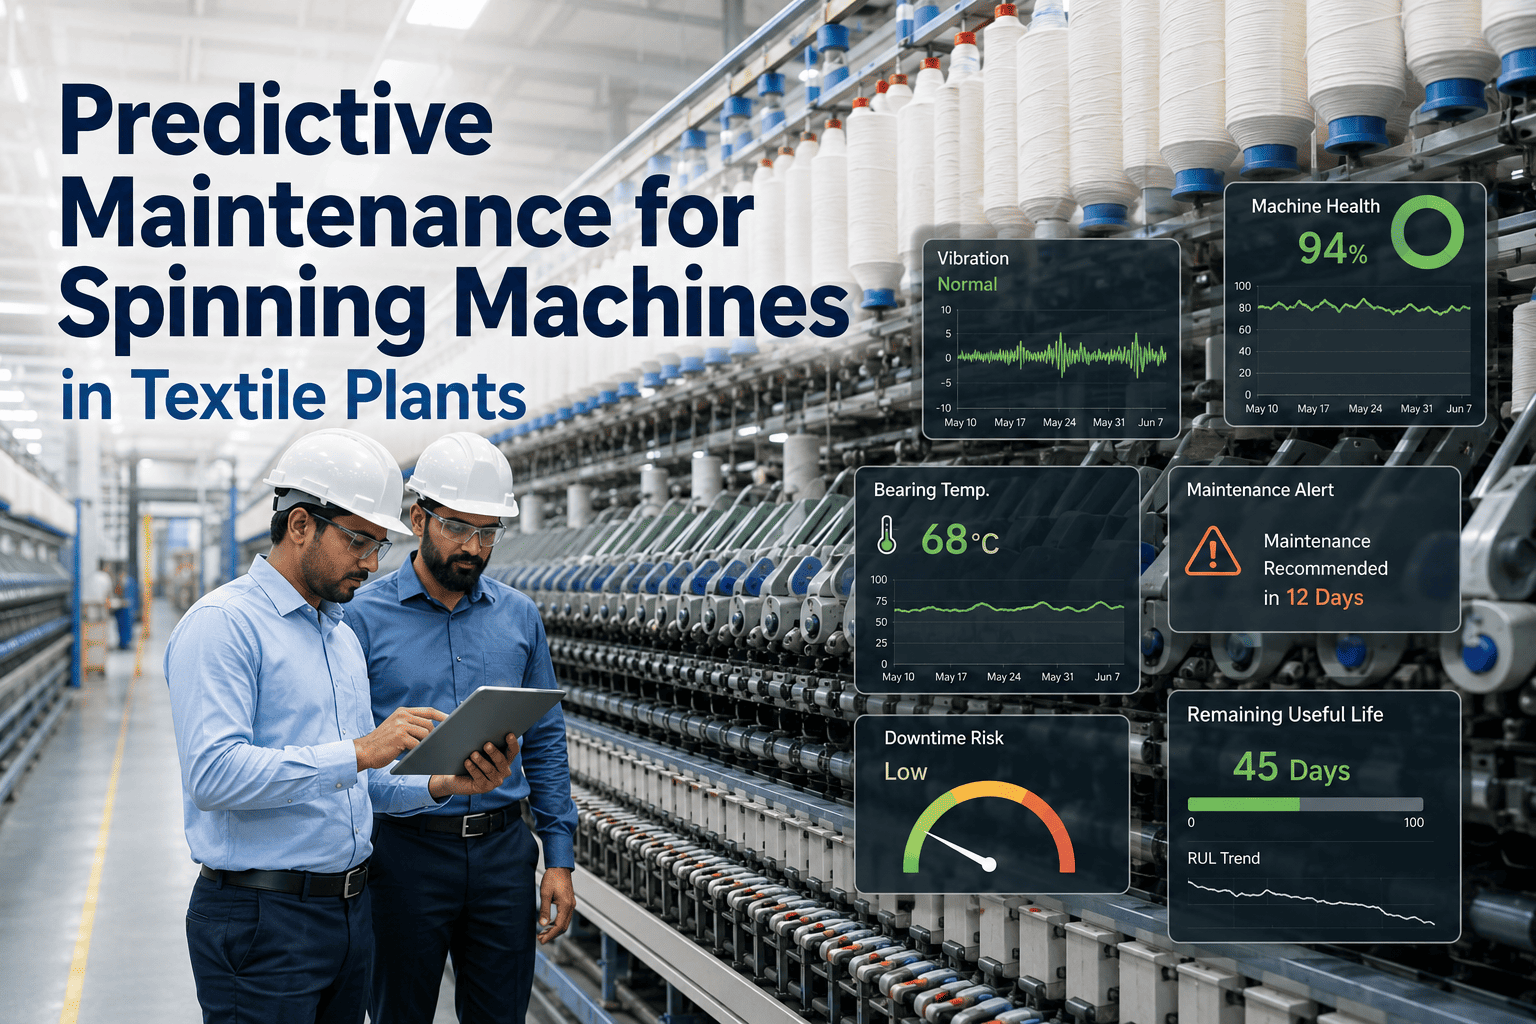
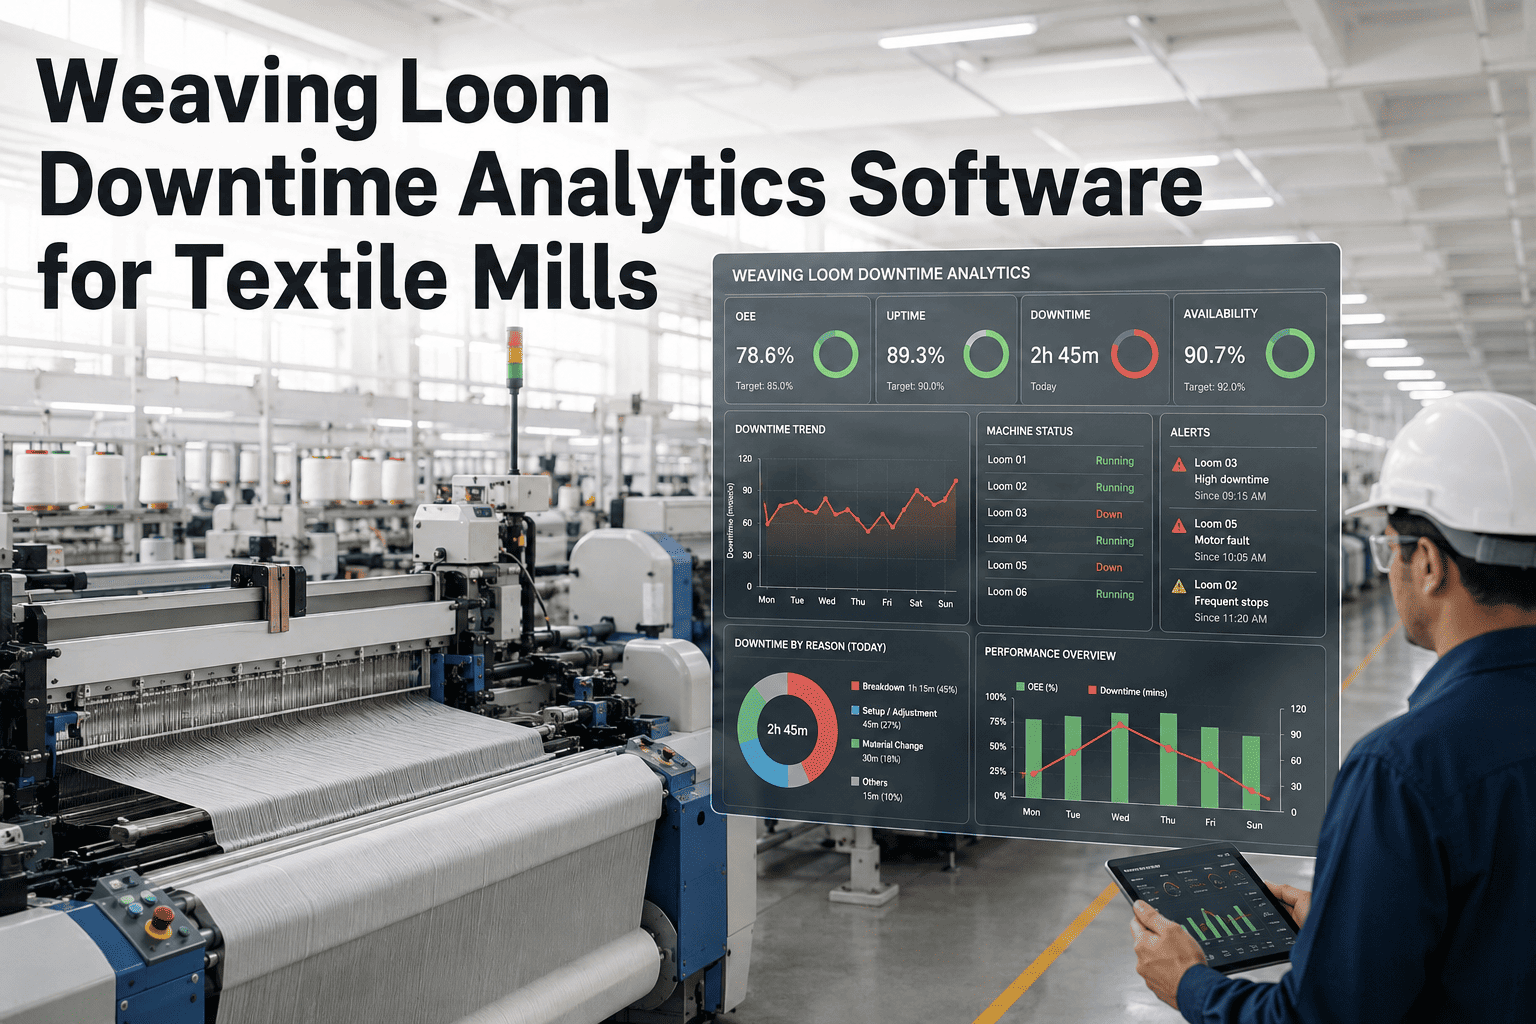
A textile mill runs hundreds of identical machines, and a single failing spindle, loom or knitting machine can lower fabric quality long before it stops. Waiting for breakdowns leaves mills with sudden downtime, rushed repairs and defects that travel down the line. AI predictive maintenance listens to vibration, temperature and motor behaviour to spot wear early and schedule repairs at the right time. To see how this fits your own machine mix, you can review a mill-specific monitoring plan with our team.
Predictive maintenance for textile mills
Catch Spindle, Loom and Knitting Machine Wear Before It Stops the Line
iFactory AI turns condition data from spinning, weaving and knitting machines into early warnings, so maintenance happens on your schedule instead of the machine's.
Illustrative: vibration trend on one machine bank
The cost of surprisesBreakdowns Cost a Mill More Than the Repair Bill
Textile production is continuous and tightly timed. When one machine fails without warning, the effects spread.
Stops
Unplanned downtime on busy machines
Drift
Quality slipping before anyone sees a fault
Rework
Fabric downgraded or reprocessed
Delays
Late orders and rushed overtime
Predictive maintenance does not remove every failure. It moves most of them from surprise to plan.
Three machine familiesSpindles, Looms and Knitting Machines Fail in Different Ways
Each machine type has its own wear points, so monitoring has to be tuned to the machine.
Spindles
Bearing wear, belt or tape problems and imbalance show up as rising vibration and heat. One tired spindle can affect yarn evenness across a frame.
Looms
Shedding, picking and beat-up mechanisms, bearings and drives wear with use. Early signs include changes in vibration, motor current and stop frequency.
Knitting machines
Needles, cams, feeders and drives wear under constant motion. Signs include noise, heat, lubrication problems and stitch defects.
Watching the right signals for each family is what turns raw data into useful warnings.
Signals that matterWhat to Watch, What It Means and What to Do
| Machine | Failure mode | Early signal | Typical response |
|---|
| Spindle | Bearing wear | Rising vibration and temperature | Plan bearing change at next doff |
| Spindle | Drive or belt slip | Speed variation, motor load change | Inspect and tension or replace |
| Loom | Shedding mechanism wear | Vibration pattern change, more stops | Inspect cams and linkages |
| Loom | Drive or motor fault | Current rise, heat | Check alignment and lubrication |
| Knitting machine | Needle or cam wear | Stitch defects, noise, heat | Replace parts at planned stop |
See Which Machines Warn You First
Share your machine list and recent breakdown history and see which units iFactory AI would watch first and why.
From signal to actionFour Steps From a Sensor Reading to a Planned Repair
1
Sense
Sensors and controllers record vibration, temperature and current.
2
Learn normal
The model learns how each machine behaves when healthy.
3
Detect drift
Changes from normal are flagged with a severity.
4
Plan the fix
A work order is raised for the next suitable stop.
Because machines of the same type are compared with each other, a single unit that drifts stands out quickly.
Data sourcesBring Machine, Mill and Maintenance Data Together
Condition data is most useful when it meets production and maintenance records.
Vibration sensorsTemperature probesMotor current
Mill condition model
Work ordersShift alertsMill dashboard
Mills are dusty, humid and full of lint. Choose sensors and mounting methods that tolerate these conditions and check them regularly.
Monitor at the right levelMachine, Bank, Department and Mill Views
Different people need different views of the same data.
Machine
Technicians see detailed signals and trends
Bank or section
Supervisors compare similar machines
Department
Managers see risk by spinning, weaving or knitting
Mill
Leaders see downtime, cost and priorities
Keeping all four views consistent means everyone discusses the same facts in daily meetings.
Maintenance strategiesEach Step Up Reduces Surprises
Most mills sit somewhere in the middle of this ladder and move up gradually.
ReactiveFix after failure
PreventiveFix on a calendar
Condition-basedFix when readings pass a limit
PredictiveFix when models forecast trouble
Not every machine needs the top level. To choose the right level for each asset class, ask our team for a strategy review.
How machine health shows in clothFive Links Between Machine Condition and Fabric Quality
1
Worn needles and cams
Can produce stitch faults and barre marks in knitted fabric.
2
Loom timing and mechanism wear
Can cause stop marks, uneven picks and weave faults.
3
Spindle imbalance
Can lead to uneven yarn and visible variation in the fabric.
4
Poor lubrication
Raises heat and wear and may cause oil marks.
5
Drive and tension drift
Changes yarn or fabric tension and affects dimensions.
Linking machine alerts to fabric defects helps prove value and sets better maintenance priorities.
A worked examplePutting a Number on Avoided Stops
This simple, illustrative example shows how the value is calculated. Use your own hours and costs.
40
Stop hours avoided per month
150
Cost per lost machine hour
Value = avoided stop hours x cost per hour = 40 x 150 = 6,000 per month
This leaves out repair savings and quality gains, which usually add to the case.
Getting startedPilot One Department and Expand With Evidence
Phase 1
Choose a department and rank machines by downtime and cost.
Phase 2
Fit sensors, learn normal behaviour and run alerts beside current practice.
Phase 3
Act on alerts, measure results and extend to other areas.
Machine list with age and downtime history
Top ten failure causes
Sensor and mounting plan for dust and humidity
Maintenance team trained on alerts
Baseline downtime and repair cost
Owner from maintenance and production
Expert reviewWhat a Textile Maintenance Manager Would Check First
Expert review
Monitoring works best where failures are costly and signals are clear. Start with the machines that hurt most when they stop, and make sure the team trusts each alert.
VerdictStrong for high-value, high-utilisation machines with clear wear signals.
Watch forSensors clogged by lint and alerts nobody acts on.
Do nextPick one department, monitor for a few weeks and compare alerts with real faults.
Frequently asked questionsWhat Mill Teams Ask About Predictive Maintenance
Does predictive maintenance work on old machines?
Often yes. Many signals, such as vibration, temperature and motor current, can be captured with add-on sensors, so older spindles and looms can be monitored without replacing controls. A short assessment shows which machines give clear signals and which may need extra instrumentation first.
Review your older machines.
Do we need sensors on every machine?
Not necessarily. Many mills start with the machines that cost the most when they stop, and use sampling or section-level monitoring for the rest. As evidence builds, coverage can grow where the benefits are clearest.
Ask about sensor coverage.
How does lint and humidity affect monitoring?
Lint and moisture can block or disturb sensors, so mounting, enclosure and cleaning routines matter. Choosing suitable sensors and including them in regular checks keeps readings reliable. Alerts can also flag a sensor that stops reporting normally.
Discuss mill conditions.
How long before we see results?
Mills often see useful alerts within weeks of installation, once the models have learned normal behaviour. Larger savings build as the team acts on alerts and maintenance moves from fixed schedules to need. Set a baseline first so results can be compared.
Ask about pilot timelines.
What do maintenance teams need to change?
Their daily work shifts toward planned jobs guided by alerts. Teams need simple training, clear alert rules and a way to give feedback when an alert was wrong. Involving technicians early makes the system more accurate and more trusted.
Plan team training.
Plan repairs, not emergencies
Keep Every Machine Running at Its Best
Book a session with iFactory AI to review your spindles, looms and knitting machines, choose what to monitor first and plan a pilot that proves the savings.