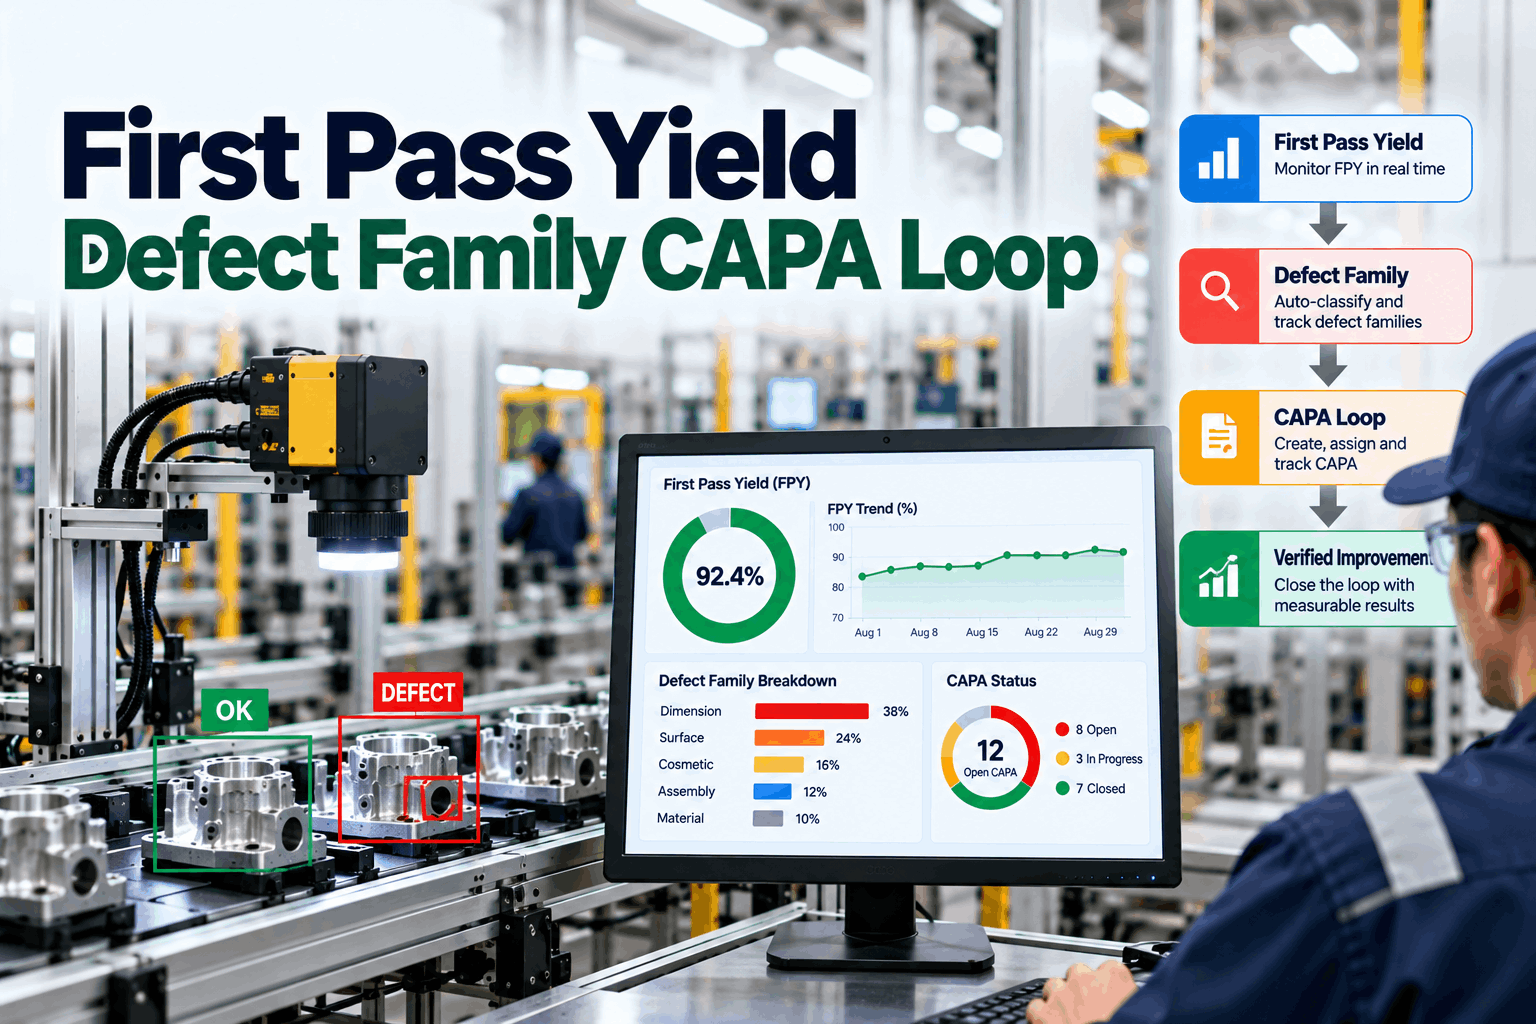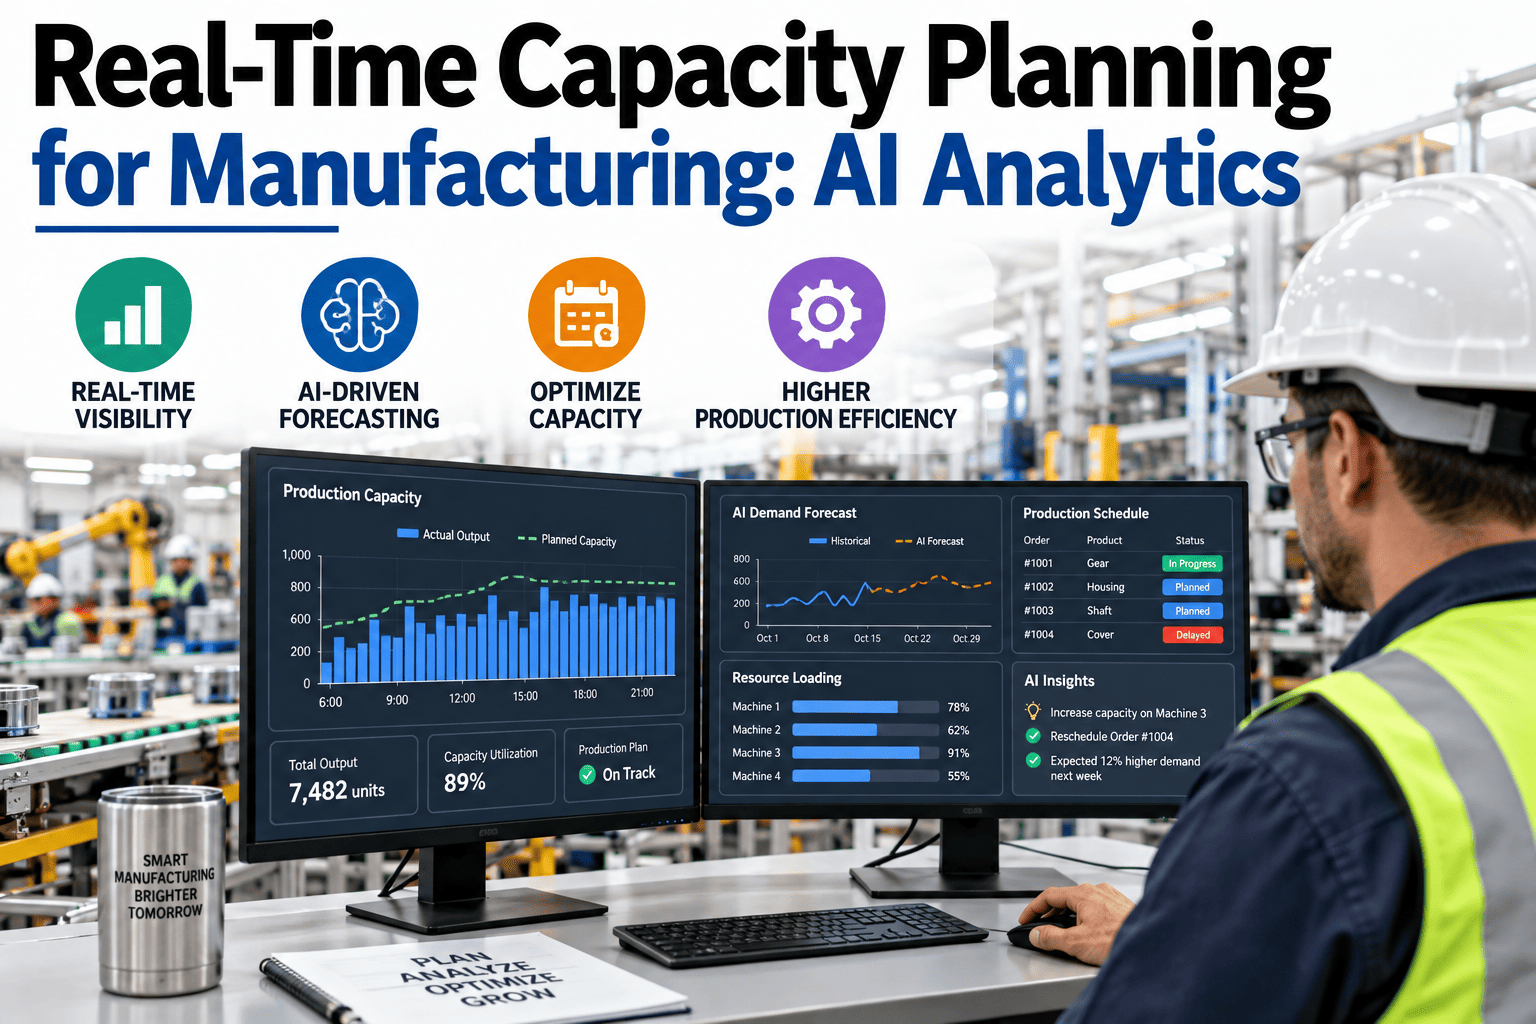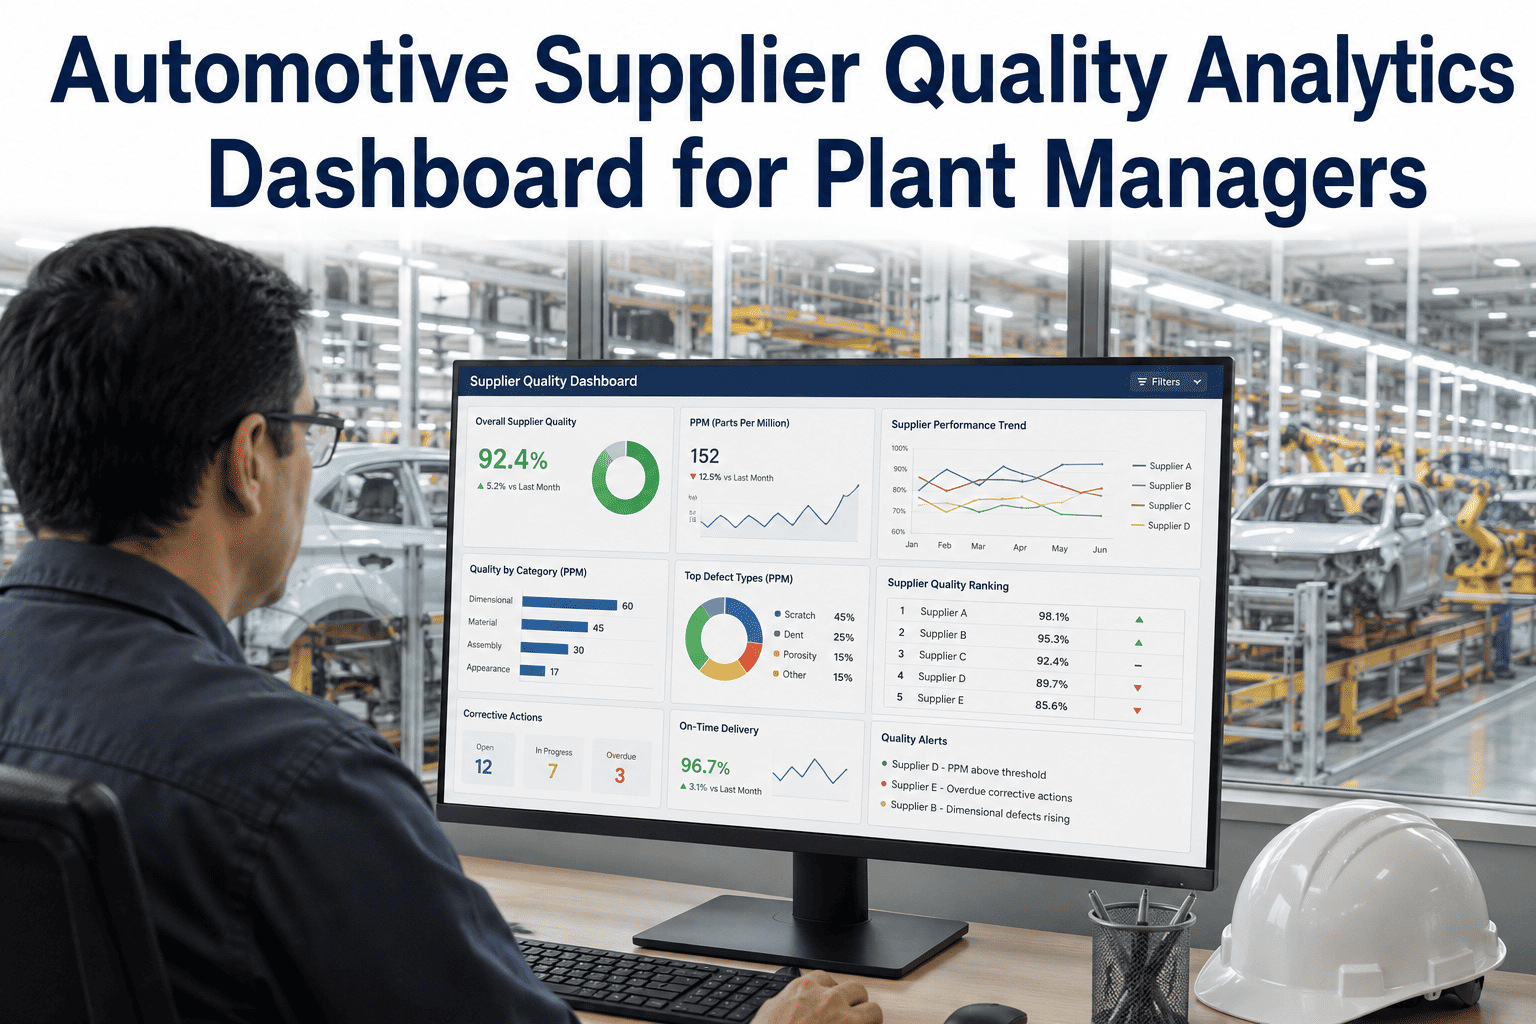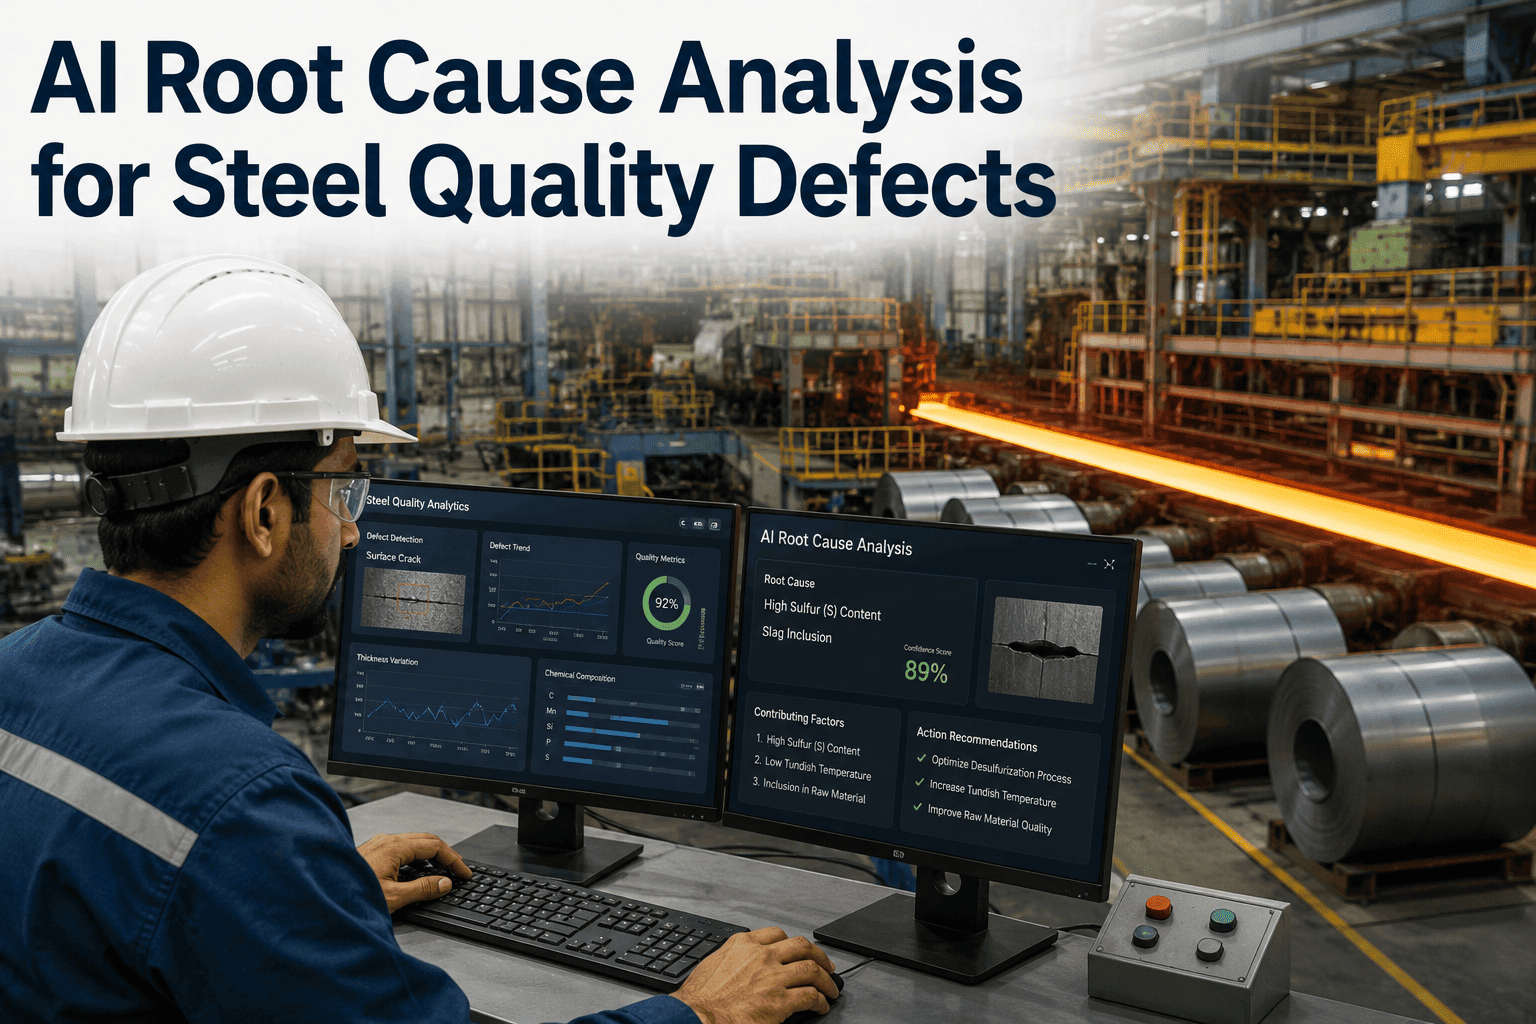
An attribute chart is drifting toward a review rule at 4:12 a.m., and the CAPA owner needs the evidence assembled before the shift meeting. That is where a p-chart signal stops being a chart-reading exercise and becomes a governed quality workflow — one that ties every subgroup point to the control plan, the affected lot window, the containment decision, and the verification plan. iFactory AI overlays your MES, QMS, historian, and SPC stack so every attribute chart signal opens a scoped hold, a CAPA draft with defect-code and genealogy evidence, verified recovery, and a preserved genealogy trail. Book a 30-minute walkthrough of chart drift to CAPA closure.
The chart shows the drift. The workflow around it decides whether the shift ends with contained evidence or a scramble to reconstruct history.
At a Glance
Why Attribute Signals Are Useful Before the Meeting
Attribute data is often where quality teams first see a problem in motion. A p-chart shows fraction defective drifting upward. An np-chart shows the count of defectives creeping toward a boundary. A c-chart reveals defect counts accumulating faster than expected. A u-chart exposes defects-per-unit trending in the wrong direction. None of that proves root cause by itself. What it does create is a useful quality signal — something in the process, product, or inspection pattern deserves immediate attention.
For a CAPA owner, the value is not just statistical. It is operational. The question becomes what this trend means in the context of the control plan, and what evidence the team needs to act responsibly. That is where attribute-defect control plan CAPA feedback becomes a closed-loop workflow instead of a chart-reading exercise.
Start With Control-Plan Context, Not the Chart Alone
A chart needs context to become actionable. In practice, the control plan tells you what the signal means — which part number, which operation, which characteristic, what the acceptance criteria are, and what the reaction plan says should happen when the signal crosses a review threshold. When the CAPA owner has this context in front of them, the meeting shifts from "we saw an uptick" to "we know which characteristic, on which operation, under which rule, with which reaction path."
The specific part number or product family tied to the signal.
The station, cell, or line that generated the affected inspection data.
The specific attribute being monitored — cosmetic, dimensional, functional.
What the control plan says to do at the review threshold.
Sample size, frequency, and acceptance criteria for the characteristic.
Time range, shift, and lot boundaries that map to the affected subgroups.
What iFactory Delivers
Everything below runs beside your MES, QMS and SPC tools, reading the data you connect. Your quality team keeps every decision.
Attribute chart signals read alongside shift, lot and machine context so a drift is explained, not just flagged.
Which characteristics, reaction plans or sample sizes the recent defect data says should be revisited.
A structured draft with scope, evidence and suggested containment, ready for your quality engineer to edit.
Line leads ask what changed on the chart and hear a short answer grounded in your data.
A PDF report for the weekly quality review when the question needs more than a spoken answer.
Who approved each control plan update, when and on what evidence, kept for audit.
Bring one control plan and one recent attribute-chart signal. We walk through intake, containment scope, CAPA draft, and verification — all beside your existing MES and QMS.
The Closed-Loop Path — Signal to Verified Recovery
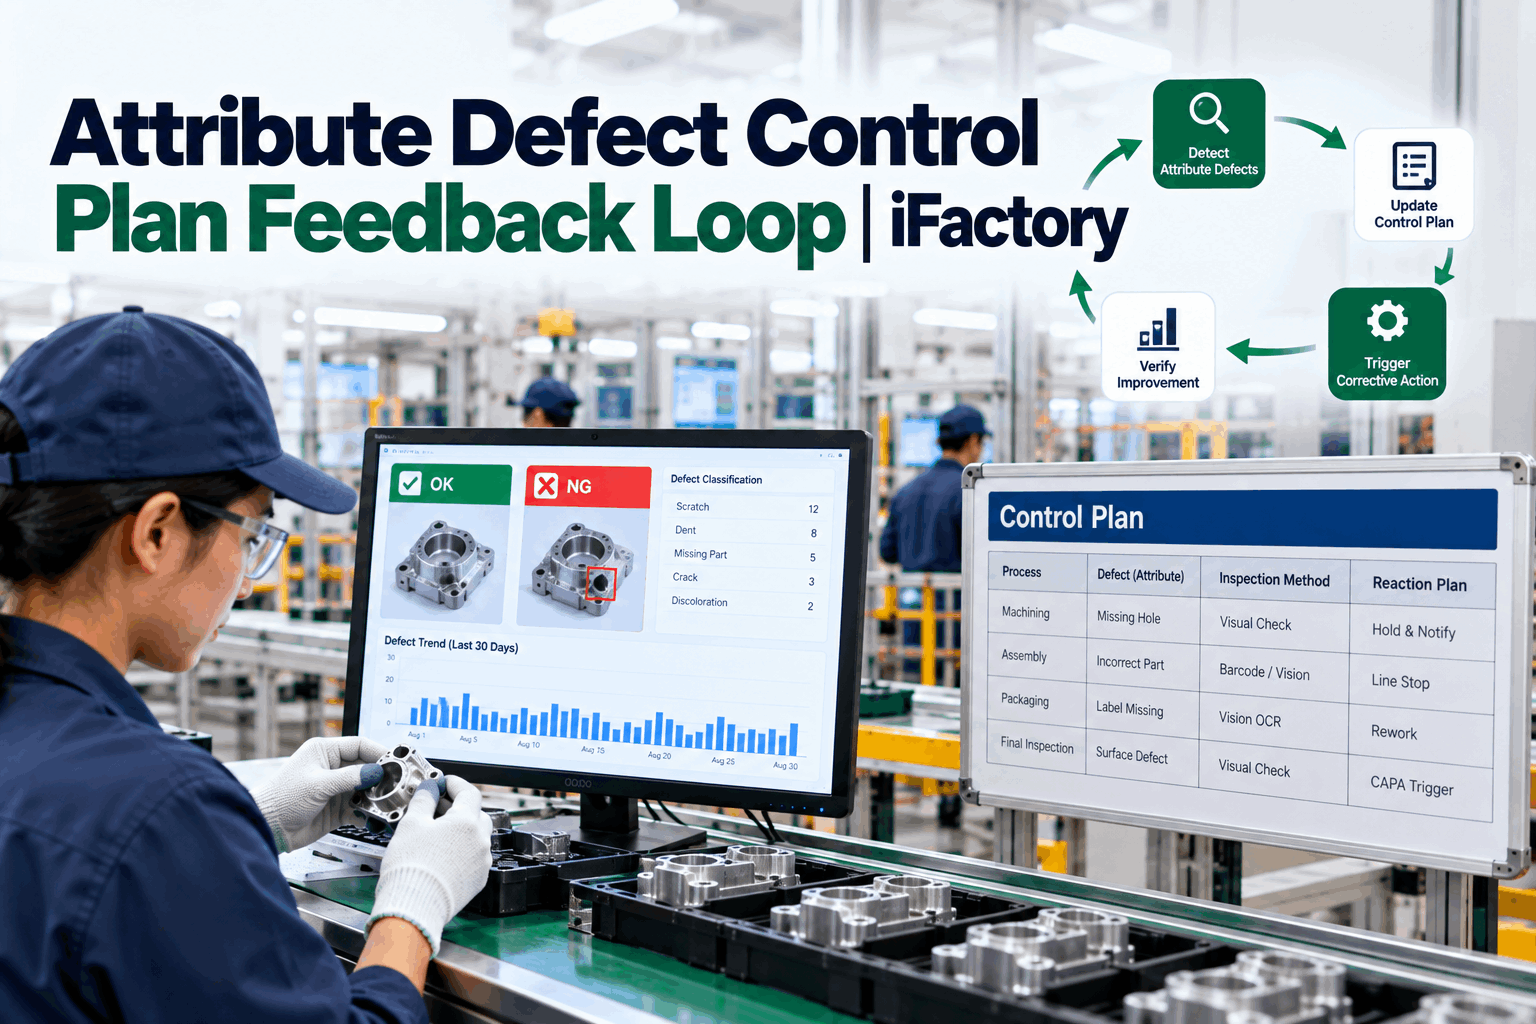
A practical closed loop for attribute-defect control plan feedback moves through six steps, each preserving evidence for the next. The workflow keeps the process disciplined and review-ready without forcing the team to dig through disconnected records every time a defect trend appears.
The attribute chart approaches or triggers a review rule; the event is captured with subgroup and chart-type context.
The system links the signal to the control plan, product, station, and inspection method.
Quality confirms the hold scope, suspect-lot boundary, and genealogy impact.
A structured summary is prepared with the evidence already assembled.
The CAPA owner and team approve next steps, update responsibilities, and define verification.
Follow-up data confirms whether the action was effective and containment can be released.
What an Agent-Drafted CAPA Package Should Include
A useful draft is not a freeform summary. It is a structured quality document built from evidence that reviewers can accept, modify, or reject with confidence.
- Problem statement — the drift, the rule triggered, the affected characteristic
- Date and time window — the subgroups involved and the shift context
- Chart type and rule condition — p, np, c, or u chart with the specific rule fired
- Part number, station, and control plan reference
- Defect description or attribute category
- Affected lot or genealogy scope
- Immediate containment action taken
- Suspected contributing factors
- Owner, due dates, and next-step investigation tasks
Frequently Asked Questions
They trigger review when a trend, rule, or pattern suggests the process may be drifting outside expected behavior. The chart does not prove root cause; it prompts a quality response.
At minimum: chart trend context, control-plan reference, affected lot or genealogy scope, containment status, defect description, and any relevant inspection history or reaction plan notes.
The chart shows the signal, and the control plan explains what that signal means operationally. Together they help determine the proper containment and investigation path.
Containment uses genealogy to identify what may be affected, so suspect material can be held, flagged, or blocked before it moves further through the process or to shipment.
Use follow-up inspection and chart behavior, plus process or genealogy evidence showing the issue did not recur. Verification should confirm the corrective action worked and containment can be reviewed for release.
Attribute charts are only the first step. iFactory AI turns every drift into a scoped hold, a CAPA draft with control-plan context, verified recovery, and a preserved genealogy trail every reviewer can defend.