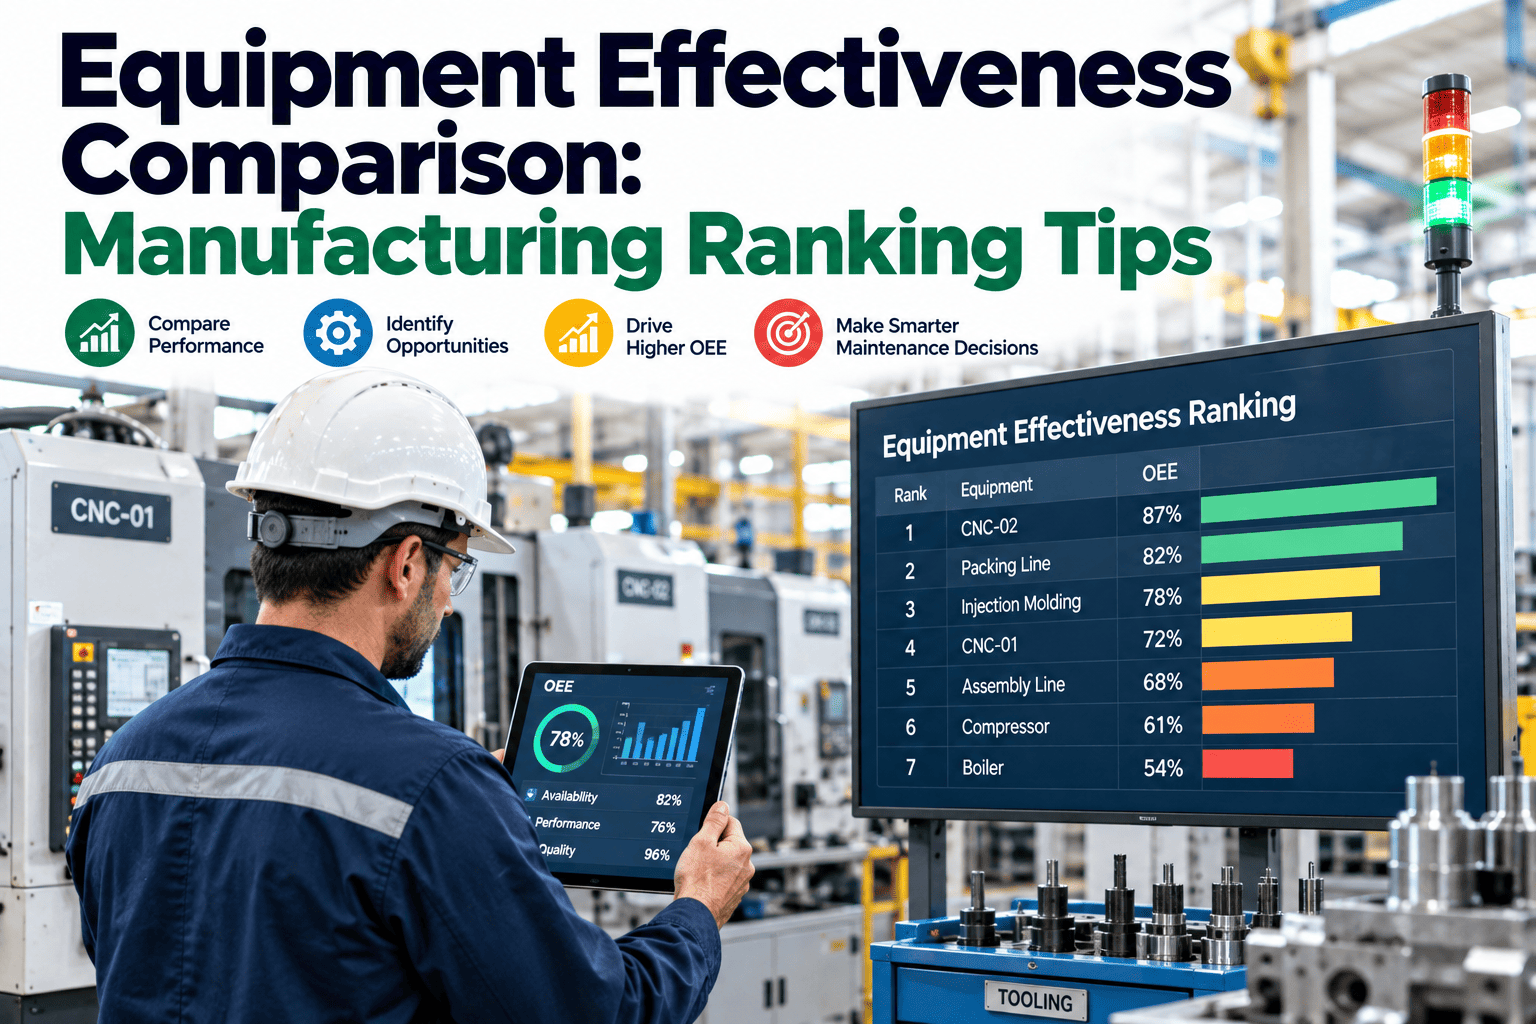
Multi-plant OEE comparison sounds simple: put every plant’s OEE on one chart and rank them. In practice each plant calculates OEE its own way, so the ranking rewards generous definitions instead of good performance. Automotive OEMs and Tier 1 suppliers need a fair comparison to decide where the next press line, body shop or capacity project should go. This guide shows how to compare plants on one standard and find the capacity you already own. To see a portfolio view built on your data, book a short walkthrough.
Multi-Plant OEE Comparison for Automotive OEMs and Tier 1s: Rank Plants Fairly, Recover Hidden Capacity
One OEE standard across every plant, so rankings are fair, losses are comparable and capex goes where capacity is truly short.
Different rules for planned time, ideal cycle time and short stops can move OEE by 10 points or more.
One standard for every plant, in line with ISO 22400, makes the ranking fair.
Rank press shops against press shops and body shops against body shops.
A few OEE points across a fleet can equal a new line that would cost tens of millions.
What Is Portfolio OEE?
Portfolio OEE is the same OEE calculation applied the same way at every plant, so results can be ranked side by side.
Overall Equipment Effectiveness. It multiplies three numbers: availability, performance and quality. The result is the share of planned time spent making good parts at full speed.
The 85% benchmark comes from Seiichi Nakajima’s TPM work: 90% × 95% × 99%.
Most plants sit well below that. Published summaries put typical OEE at 40–60%, with automotive often higher. The gap between typical and world-class is capacity already paid for.
A portfolio view shows that gap plant by plant. We can review how your plants calculate OEE today on a call.
Why OEMs and Tier 1s Need Cross-Plant Comparison
Large automotive groups run dozens or hundreds of plants, and every one of them asks for capital.
- Capex is limited. Leaders must choose which plant gets the new press line or body shop.
- Demand moves. New models have to be placed where there is real spare capacity.
- Best practice hides. The plant with the best changeovers may be three countries away.
- Reported numbers mislead. Without one standard, the best-looking plant may just have the kindest definitions.
Price of a single new servo press line at one European OEM. Recovering lost capacity on existing lines is far cheaper.
A fair comparison turns those decisions from opinion into evidence. See a sample fleet ranking in a demo.
Why Plant OEE Numbers Cannot Be Compared Today
The formula is the same everywhere. The inputs are not.
| Choice | Generous version | Strict version | Typical effect on OEE |
|---|---|---|---|
| Changeovers | Treated as planned downtime | Counted as an availability loss | 4–8 points |
| Ideal cycle time | Historical average speed | Best demonstrated or design speed | 3–7 points |
| Short stops | Stops under 5 minutes ignored | Every stop captured automatically | 2–5 points |
| Rework | Reworked parts count as good | Only first-time-good parts count | Depends on rework rate |
| Planned time | Meetings and cleaning excluded | Only true no-demand time excluded | Can be large |
These ranges come from TeepTrak’s analysis of common calculation errors, which puts the combined inflation at 10–18 points. Another vendor study found the same line could show 70% or 95% performance depending on the ideal cycle time chosen.
Until definitions match, a ranking is a ranking of accounting choices. Our specialists can audit yours.
Setting One OEE Standard for Every Plant
A group standard is a short list of rules that every plant applies the same way.
Only time with no demand is excluded. Changeovers, breaks taken on the line and meetings stay in.
Design speed or best demonstrated speed for each part, reviewed yearly.
Captured automatically from the PLC, down to a few seconds.
Only parts that pass first time count as good.
The same unit everywhere: bottleneck station, line or shop.
One shared list of loss reasons across all plants.
ISO 22400-2 is the international standard for manufacturing KPIs. It keeps the availability, performance and quality structure and fixes the time definitions behind them, which makes it a sound base for a group rule book.
Plants keep their local views too. The group standard sits alongside them, not instead of them. We set this up in every rollout.
OEE, TEEP and Utilization: Which Number Answers Which Question?
OEE tells you how well you use planned time. It does not tell you how much time you plan.
| Measure | Formula | Question it answers |
|---|---|---|
| OEE | Availability × performance × quality | How well do we run when we plan to run? |
| Utilization | Planned production time ÷ all time | How much of the calendar do we plan to use? |
| TEEP | OEE × utilization | How much of all time makes good parts? |
| Hidden factory | Output possible without new capital | How much capacity do we already own? |
Illustrative. New volume fits Plant B without capital, even though both plants report the same OEE.
This matters in Europe especially. BCG estimated in 2026 that the region’s car plants run at about 60% utilization against an 80% benchmark.
A portfolio view should show OEE and TEEP together. Ask our team for an example.
How to Rank Plants Fairly
Rank plants within the same process family, on the same standard, with context beside the number.
Illustrative. Each bar uses the same rules for planned time, ideal cycle and changeovers.
Press, body, paint, assembly, machining and molding each get their own ranking.
More variants mean more changeovers. Show changeover count beside OEE.
A 20-year-old line and a new one have different ceilings.
A plant improving fast may deserve more attention than a static leader.
Availability, performance and quality losses side by side.
A single ranking of every plant hides more than it shows.
Targets should be set per line. Identical lines with different product mixes will score differently. See how groups are built in a session.
Compare the Losses, Not Just the Score
Two plants with the same OEE can lose time in completely different ways.
| Loss | OEE factor | Typical example in a car plant |
|---|---|---|
| Unplanned stops | Availability | Robot fault, die damage, conveyor jam |
| Planned stops | Availability | Die change, model changeover, tip dress |
| Small stops | Performance | Part mis-feed, sensor blocked, short starve |
| Slow cycles | Performance | Reduced press speed, slow robot path |
| Production rejects | Quality | Splits, weld defects, paint dirt |
| Startup rejects | Quality | First parts after a die or color change |
These are the six big losses from TPM. Comparing them across plants shows who has solved what.
- Plant with the shortest changeovers becomes the teacher for planned stops.
- Plant with the fewest short stops shares its automation and sensor fixes.
- Plant with the lowest startup scrap shares its die and process settings.
That is how a ranking turns into shared improvement. Our engineers can map your loss codes to one list.
From Ranking to Capex Decisions
Before approving new capacity, check how much the existing lines could give at the group’s best level.
Illustrative. The check does not replace capex; it shows which requests are really needed.
Put every plant on the group OEE rules.
Compare within each process family.
Measure each plant against the best comparable one.
Turn OEE points into parts or vehicles.
Fund capex where the gap cannot cover demand.
Cost of Hyundai’s new Georgia plant, built for 300,000 vehicles a year. New capacity is expensive; hidden capacity is not.
Finance teams value this check because it is simple to audit. We can run it on your fleet in a working session.
Spreadsheets Versus a Portfolio OEE Dashboard
Most groups collect plant OEE by spreadsheet once a month. That is too slow and too easy to shape.
- Each plant sends its own number
- Definitions differ quietly
- Data arrives weeks late
- Losses summarized, not shown
- Ranking argued over
- Capex cases built by each plant
- Every plant measured the same way
- One rule book applied automatically
- Data refreshed every shift
- Losses comparable across plants
- Ranking trusted
- Capex tested against hidden capacity
The dashboard reads machine data directly, so the number cannot be adjusted by hand. Discuss a pilot with our advisors.
Multi-Plant OEE Checklist
Use this list before you trust any cross-plant ranking.
Most groups find their plants differ on at least three of these. A standards review shows which.
How iFactory Delivers Portfolio OEE
iFactory measures OEE from machine data at every plant, applies one rule book and shows the fleet on one screen.
Stops and counts read from PLCs and MES.
The same definitions applied everywhere.
Plants compared within process families.
Six big losses side by side.
OEE gaps converted into parts and vehicles.
Requests tested against recoverable capacity.
Each plant runs an on-premise iFactory server; the group view rolls them up. Share two plants’ data and we will compare them in a pilot.
See Your Plants Ranked on One Standard
Share OEE data from two or three plants. We put them on one rule book and show the real ranking and the hidden capacity.
Plant C reports 81% OEE but counts changeovers as planned time. On the group standard it scores 73%, which moves it from 2nd to 5th of 7 plants.
A Ranking That Changed After Standardizing
This is how an operations director might use the portfolio view.
iFactory ships as a pre-configured NVIDIA AI server, racked and ready with the portfolio OEE models loaded. Rack it, plug in power and Ethernet, and the AI is live. Scope covers data connections across press, body, paint, assembly and machining areas, PLC/SCADA, MES, CMMS and ERP integration, cabling and network setup, team training and 24×7 remote monitoring.
Server installed, PLC, MES and CMMS links live, history loaded.
Models tuned on your own lines, then piloted in one area with your team reviewing every output.
Rollout to the agreed lines, team training done, 24×7 remote monitoring in place.
Software, server and integration come as one package. For group pricing, contact our sales team.
Frequently Asked Questions
85% is the classic world-class benchmark. Published summaries put automotive plants typically at 75–82%, but the figure only means something if the calculation rules are known.
Because plants define planned time, ideal cycle time, short stops and good parts differently. Those choices can move OEE by 10 points or more.
OEE measures how well planned time is used. TEEP multiplies OEE by utilization, so it shows how much of all calendar time produces good parts.
The extra output a plant could make without new capital, by removing losses in availability, performance, quality and scheduling.
No. Targets should be set per line, because product mix, automation level and equipment age differ. The calculation rules should be the same; the targets need not be.
A first plant is typically live within 6–12 weeks, and further plants follow the same template. Plan it with our specialists.
Find the Capacity You Already Own
iFactory puts every plant on one OEE standard, ranks them fairly and shows how much output is recoverable before you spend on new lines.
Illustrative. Same definitions for planned time, ideal cycle and changeovers at every plant.