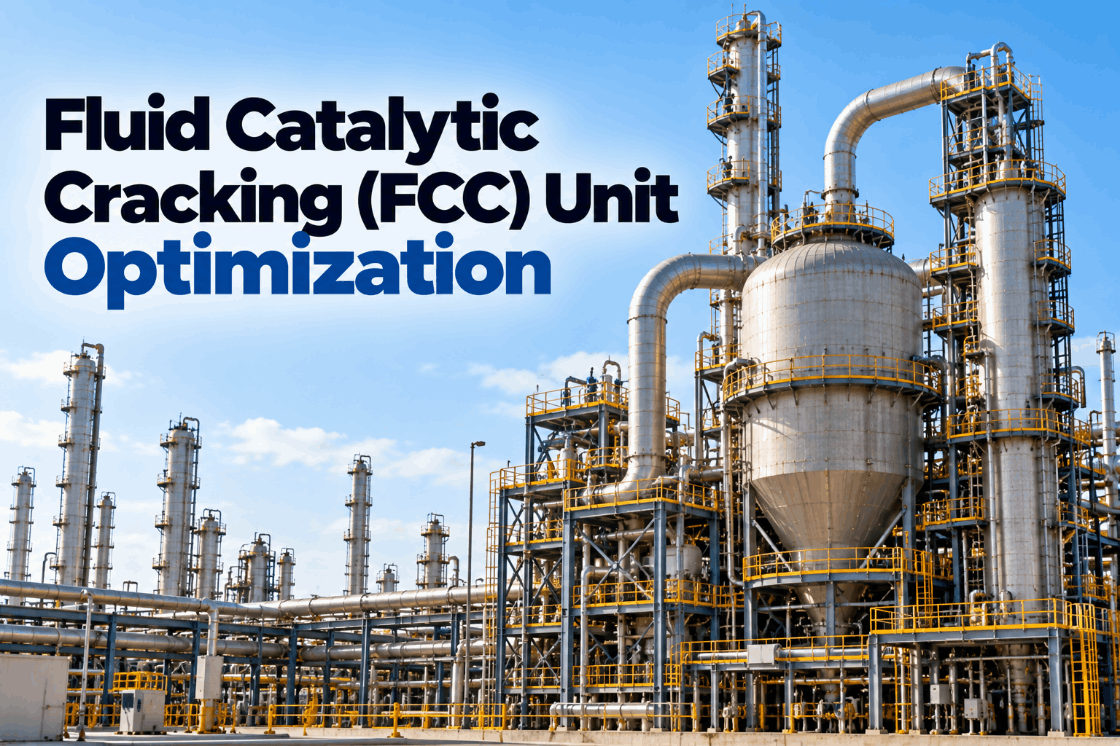
The fluid catalytic cracking unit is the main conversion engine of many refineries and a major source of propylene. Hot regenerated catalyst meets vacuum gas oil or residue at the bottom of the riser, cracks it in seconds and carries coke back to the regenerator, where burning the coke supplies the heat for the next pass. Everything is connected: riser temperature depends on catalyst circulation, circulation depends on regenerator temperature and pressure balance, and regenerator temperature depends on how much coke the feed makes. Most FCC units already run advanced process control, yet the unit still spends much of its time against one limit or another. This guide covers how the reactor and regenerator interact, the key variables, yield and propylene levers, regenerator limits and afterburn, catalyst management and how continuous optimization finds the best constraint set every day. To see your FCC data analyzed, book a short walkthrough.
Fluid Catalytic Cracking (FCC) Unit Optimization: Riser, Regenerator and Yields in One View
Riser temperature, catalyst circulation, regenerator coke burn and product yields optimized together against the unit’s real limits, with catalyst health and afterburn watched continuously.
Why FCC Units Spend Their Lives Against Limits
An FCC unit is a heat-balanced system. Catalyst circulates between the reactor riser and the regenerator many times an hour; Colorado School of Mines course material cites a typical circulation of about 70 tonnes per minute. The coke deposited on catalyst during cracking is burned in the regenerator, and that heat drives the next round of cracking. Change one variable and several others move with it.
FCC is also commercially central. A Chemical Society Reviews article describes it as producing the majority of the world’s gasoline, and Digital Refining reports that FCC units supply about 29% of global propylene, behind steam crackers at 45%. When propylene is valuable, FCC severity and additives become petrochemical decisions as well as refinery ones.
Most units already run advanced process control. The Oil and Gas Journal reports typical APC benefits of about 3–5% capacity-equivalent with payback of three to nine months. But APC holds the unit at the limits it is given. Choosing which limits to push, as feed, catalyst and prices change, still relies on engineers working from spreadsheets and experience.
Continuous optimization helps engineers make that choice every day. We can review your FCC data on a call.
The Riser, Regenerator and Heat Balance
The FCC unit’s main sections work as one system.
The heat balance links them. More coke on catalyst means a hotter regenerator, which lowers the catalyst circulation needed to hold riser temperature, which lowers cat-to-oil and changes yields. Feed quality, especially carbon residue, drives coke make and therefore the whole balance.
A calibrated unit model captures these links for your specific design. See it in a demo.
Yield Levers: Gasoline, Light Olefins and Distillate
FCC operators can shift yields between gasoline, light olefins and light cycle oil with a handful of levers.
| Lever | Typical effect | Trade-off |
|---|---|---|
| Higher riser outlet temperature | More conversion, more LPG and olefins, higher octane up to a point | More dry gas and coke; wet gas compressor and regenerator load |
| Higher cat-to-oil ratio | More conversion at the same riser temperature | Higher coke make and regenerator temperature |
| ZSM-5 additive | More propylene and butylenes from gasoline-range molecules | Gasoline yield falls; additive cost |
| Lower riser temperature | More light cycle oil for distillate | Lower conversion and LPG |
| Feed preheat changes | Shifts cat-to-oil at fixed riser temperature | Affects heat balance and regenerator temperature |
Course material from the Colorado School of Mines notes that ZSM-5 is typically used at 1–5% of total catalyst to raise light olefins. AFPM operating discussions reported in the Oil and Gas Journal note that gasoline octane rises about 0.75–1.0 RON per 20 °F of reactor temperature, with the response mostly flat above about 1,000 °F.
Which yield pattern is best changes with prices. Digital Refining notes polymer-grade propylene commands a premium of about $0.20–0.30 per pound over refinery grade, which can make propylene maximization attractive when downstream splitting is available. A model that predicts yields and their value lets planners see the best target for today.
Our engineers can show how your yield pattern responds to each lever.
Regenerator Limits and Afterburn
The regenerator often sets the unit’s ceiling.
Rises with coke make. Metallurgy and catalyst stability set the upper limit.
Temperatures above the dense bed point to afterburn, where carbon monoxide burns after leaving the bed.
High dilute-phase and flue gas temperatures can damage cyclones and plenum.
Uneven air leaves some regions short of oxygen and others with excess, a common afterburn cause.
Limits how much coke can be burned, capping feed rate or severity.
Where fitted, remove heat to allow heavier feeds or higher conversion.
A revamp case published in Applied Sciences shows how much regenerator performance can change. After improvements, the unit raised riser outlet temperature from 532 to 550 °C, raised its regenerator limit from 705 to 730 °C, halved afterburn from 12 to 6 °C, cut catalyst losses from 0.89 to 0.0142 kg per tonne of feed and reduced NOx from 250 to 160 mg/Nm³.
Watching the temperature difference between dilute phase and dense bed, along with flue gas oxygen and carbon monoxide, gives early warning of afterburn and points to air distribution or excess air as the cause.
Regenerator analysis is part of every FCC rollout.
Finding the Best Constraint Set Each Day
An FCC unit almost always runs against some combination of limits. The question is which combination earns the most.
Illustrative. The best constraint set shifts with feed, catalyst activity and product prices.
This is where optimization adds to APC. APC holds the unit at the limits; optimization decides which limits are worth pushing, using a unit model calibrated on plant data and current prices from planning.
The best answer often changes within a week. A new crude blend, a change in catalyst activity or a shift in propylene value can move the most profitable point from one constraint set to another. Reviewing it daily rather than monthly keeps the unit where it earns most.
Most units have room to earn more within existing limits. Ask our team to estimate yours.
Catalyst Management and Equilibrium Catalyst
The circulating catalyst inventory, called equilibrium catalyst or e-cat, is a mix of particles of different ages. Its condition shapes the unit’s performance.
Regular laboratory analysis of activity, surface area, metals and particle size from the circulating inventory.
Daily makeup rate to maintain activity and replace losses.
Nickel and vanadium from heavier feeds poison catalyst and raise hydrogen and coke.
Broken particles escape through cyclones, raising makeup and slurry ash.
Catalyst fines in the main fractionator bottoms show cyclone performance.
ZSM-5 for light olefins and other additives for emissions and metals.
E-cat results arrive weekly or less often, while the unit changes daily. Linking e-cat trends with process data shows whether activity changes come from feed metals, addition rates or temperatures, and helps set fresh catalyst additions more precisely.
Catalyst losses deserve close watching. A sudden rise in losses often points to cyclone damage or erosion, and early detection can avoid running months with high makeup costs and fines in the slurry.
Catalyst cost is one of the largest FCC operating expenses. Discuss your e-cat data with our specialists.
APC Alone Versus APC With Continuous Optimization
APC and optimization do different jobs and work best together.
- Holds the unit at the limits it is given
- Limits chosen by engineers occasionally
- Yield value checked in monthly reviews
- Catalyst effects seen after the fact
- Afterburn handled by alarms
- Prices enter through planning cycles
- Limits chosen daily by value
- Unit model predicts yields at each limit
- Margin at current prices shown live
- E-cat and process data linked
- Afterburn trends caught early
- Price changes reflected the same day
Optimization recommendations are reviewed by FCC engineers and passed to APC as targets, rather than bypassing the control layer. Any change to how targets are applied follows the plant’s management of change.
See how optimization targets are presented alongside APC in a session.
FCC Optimization Checklist
Use this checklist to prepare an FCC unit for continuous optimization.
Most units have these data across DCS, LIMS and planning systems. Combining them is the first step of an FCC review.
What FCC Optimization Is Worth
Value comes from yields, capacity, catalyst and reliability.
The Oil and Gas Journal’s figures for APC, about 3–5% capacity-equivalent with payback of three to nine months, show the value of operating closer to limits. Optimization adds the daily choice of which limits matter most; its value depends on how much prices and feeds move at your refinery.
A review of a few months of FCC data usually shows where margin is being lost. Book one with our advisors.
How iFactory Delivers FCC Optimization
Heat balance and yields calibrated on your data.
Which limits to push at current prices.
Margin of each operating point shown live.
Dilute phase, flue gas and air distribution.
E-cat, losses and additions linked to process data.
Recommendations passed as targets to existing control.
It runs on premises beside your DCS, APC and LIMS. Share a few months of FCC data and we will show your constraint map in a working session.
See Which Limit Is Costing Your FCC the Most
Share reactor, regenerator, yield and catalyst data. We calibrate a unit model, map the active limits and show the operating point that earns most at today’s prices.
Dilute-phase temperature is running 14 °C above the dense bed, a sign of afterburn. Dense bed is 728 °C against a 730 °C limit, so riser temperature cannot rise further today.
Afterburn Caught Before It Capped the Unit
This exchange shows how an FCC process engineer might use iFactory.
iFactory ships as a pre-configured NVIDIA AI server, racked and ready with the FCC riser and regenerator optimization models loaded. Rack it, plug in power and Ethernet, and the AI is live on your network. Our scope covers data connections across reactor, regenerator, main fractionator and gas plant, DCS, PLC/SCADA, historian, LIMS and CMMS integration, cabling and network setup, operator and engineer training, and 24×7 remote monitoring. Recommendations run in advisory mode first, and nothing writes to your control system without your management of change approval.
Server installed, DCS and historian links live, historical process, lab and maintenance data loaded.
Models calibrated on your own unit data, then run in advisory mode on one unit with your process engineers reviewing every recommendation.
Rollout to the agreed units under your management of change, operator and engineer training, and 24×7 remote monitoring in place.
Software, server and integration come as one package. For pricing on your site, contact our sales team.
Frequently Asked Questions
Mainly riser outlet temperature and catalyst-to-oil ratio, both linked through the heat balance to regenerator temperature and coke make.
Digital Refining reports FCC units supply about 29% of global propylene, behind steam crackers at about 45%. ZSM-5 additive is used to raise light olefin yields.
Combustion of carbon monoxide above the dense bed, shown by dilute-phase and flue gas temperatures rising above the bed temperature. It can damage cyclones and is often linked to air distribution or excess air.
The circulating catalyst inventory, a mix of particles of different ages. Its activity, metals and particle size are measured regularly to guide fresh catalyst additions.
No. APC holds the unit at its limits; optimization decides which limits are most valuable to push and passes targets to APC after engineer review.
An FCC unit can typically be modeled and in advisory use within a 6–12 week rollout. Plan it with our engineers.
Push the Limit That Earns Most, Every Day
iFactory models your riser, regenerator and yields, finds the most valuable operating point at today’s prices and watches afterburn and catalyst health, giving APC better targets.
Illustrative yield pattern. The unit model tracks each yield against plan as riser temperature, cat-to-oil and feed quality move.