On a high-speed beverage or food line, the filler sets the pace for everything around it. When it trips, the capper, labeller, and packer stop within seconds, and the cost is counted in lakhs of rupees per hour of lost output, plus the product in the bowl and the reject pile. Most filler failures are not sudden. A valve seal loses its seating and fill volumes begin to wander. A carousel bearing runs warmer shift by shift. A vacuum pump draws more current to hold the same level. The signals are there days ahead, but a calendar-based service plan and an end-of-shift check will not see them. Predictive maintenance on a filler is not about adding sensors everywhere. It is about choosing the few signals that tell you which component is degrading, comparing them against that machine's own baseline, and turning the result into a planned stop during a changeover or sanitation window. This guide covers what to monitor, how early each failure shows, and how to roll it out without touching food-contact surfaces. iFactory Predictive Maintenance runs that programme on filling lines, live.
iFactory Maintenance Reliability - Food and Beverage Filling
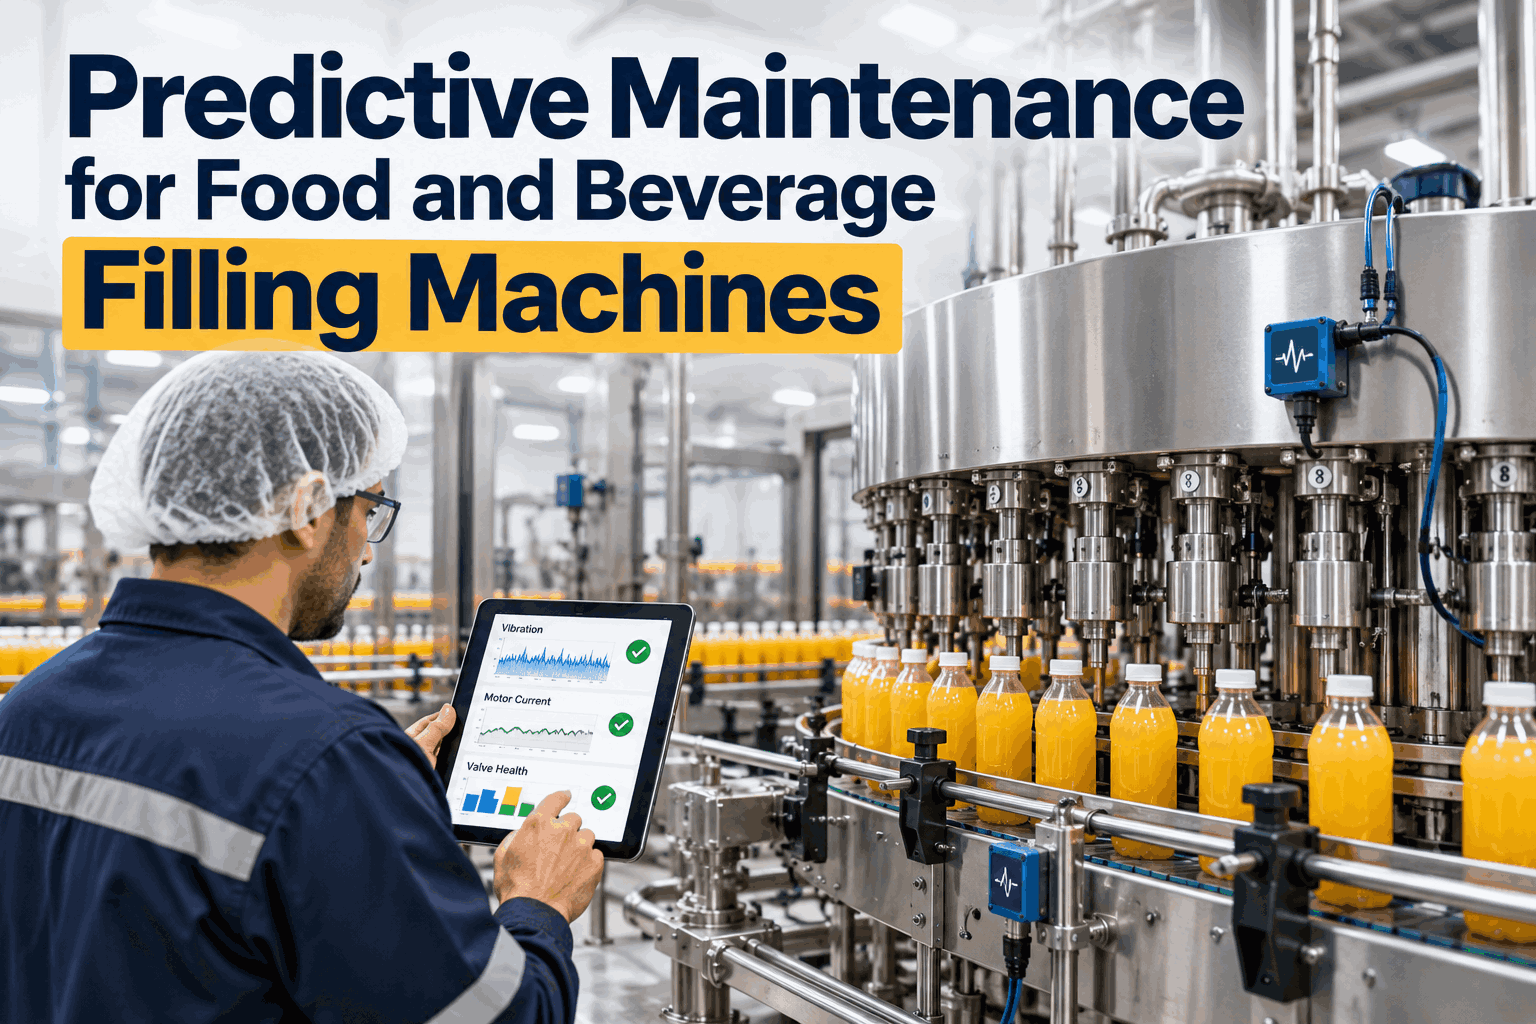
Predictive Maintenance for Food and Beverage Filling Machines
Vibration, motor current, and valve performance monitoring that identifies the failing component days before the filler trips, so the repair happens in a planned window.
3-9 days
typical warning on bearing, gearbox, and valve faults
40%
fewer unplanned filler stops after structured monitoring
Zero
sensors on food-contact surfaces
90 days
from installation to first documented prevented stop
Where Filler Maintenance Really Stands
Most filler maintenance teams are strong at fast breakdown response and weaker at seeing a fault before it becomes one. These four stages show where a plant sits and what the next step looks like.
Stage 1
Run to failure
Valves, seals, and bearings are replaced after they fail. Spares are held for the usual suspects. Downtime is accepted as part of filling.
Recognition signal: "We keep a spare valve block on the shelf" - because the last three trips needed one.
Stage 2
Calendar service
Seals and bearings are changed at fixed hours or months. Some parts are replaced early and wasted, others fail between services and cause a stop anyway.
Recognition signal: "We changed that seal set last month" - and the valve still leaked.
Stage 3
Periodic checks
Monthly vibration rounds, thermography, and fill-weight audits give a snapshot. Condition data exists but is weeks old when someone reads it.
Recognition signal: "The round was clean" - and the bearing failed nine days later.
Stage 4
Continuous prediction
Continuous signals are compared with the filler's own baseline at each speed and product. Alerts name the component, give a failure window, and raise the work order.
Recognition signal: "It flagged valve 14 five days ago" - the seal kit was fitted during Tuesday's changeover.
What to Monitor on a Filling Machine
A filler is several machines in one: a rotating carousel, dozens of filling valves, a drive train, vacuum or product pumps, and a capper or seamer. Each has its own failure behaviour and its own best signal. All of these can be monitored from the machine frame, motors, and drives, without touching product contact parts.
Carousel and drive
Main drive motor vibration and current
Gearbox mesh frequency (FFT)
Carousel bearing temperature and vibration
Drive torque against speed and load
Gearbox oil temperature
Filling valves
Fill volume or weight drift per valve
Valve actuation time trending
Pneumatic supply pressure decay
Flow meter deviation per head
Drip and leak event counts
Capper and seamer
Capping torque per head against target
Servo current and temperature
Chuck and spindle bearing vibration
Reject rate by head position
Cap or lid feed jam frequency
Pumps and utilities
Vacuum pump current and bearing vibration
Product pump motor signature
Compressed air pressure and consumption
Infeed conveyor motor current
VFD fault history and thermal trend
Failure Mode Coverage - What Shows Early and How Early
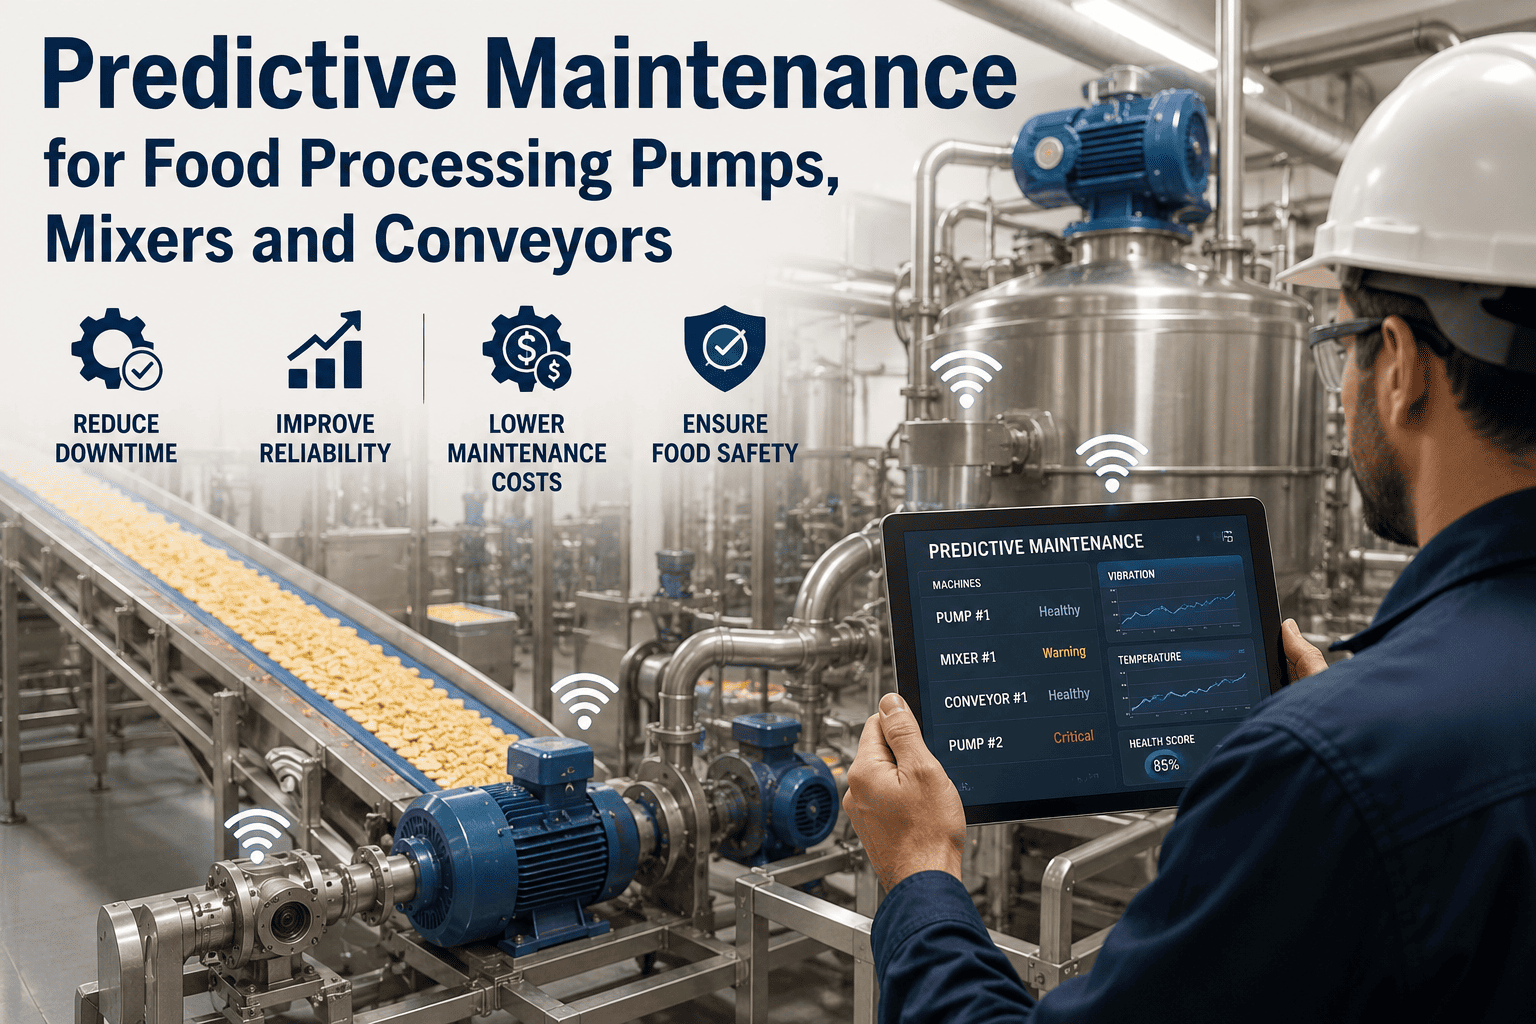
Lead time depends on the failure mode. Mechanical wear gives the longest warning. Seal and valve degradation is detected indirectly through process behaviour. Some failures give no precursor and need a different strategy. Setting this expectation early is what keeps a programme credible.
Failure mode
Detection method
Lead time
Confidence
Where it occurs
Carousel or spindle bearing defect
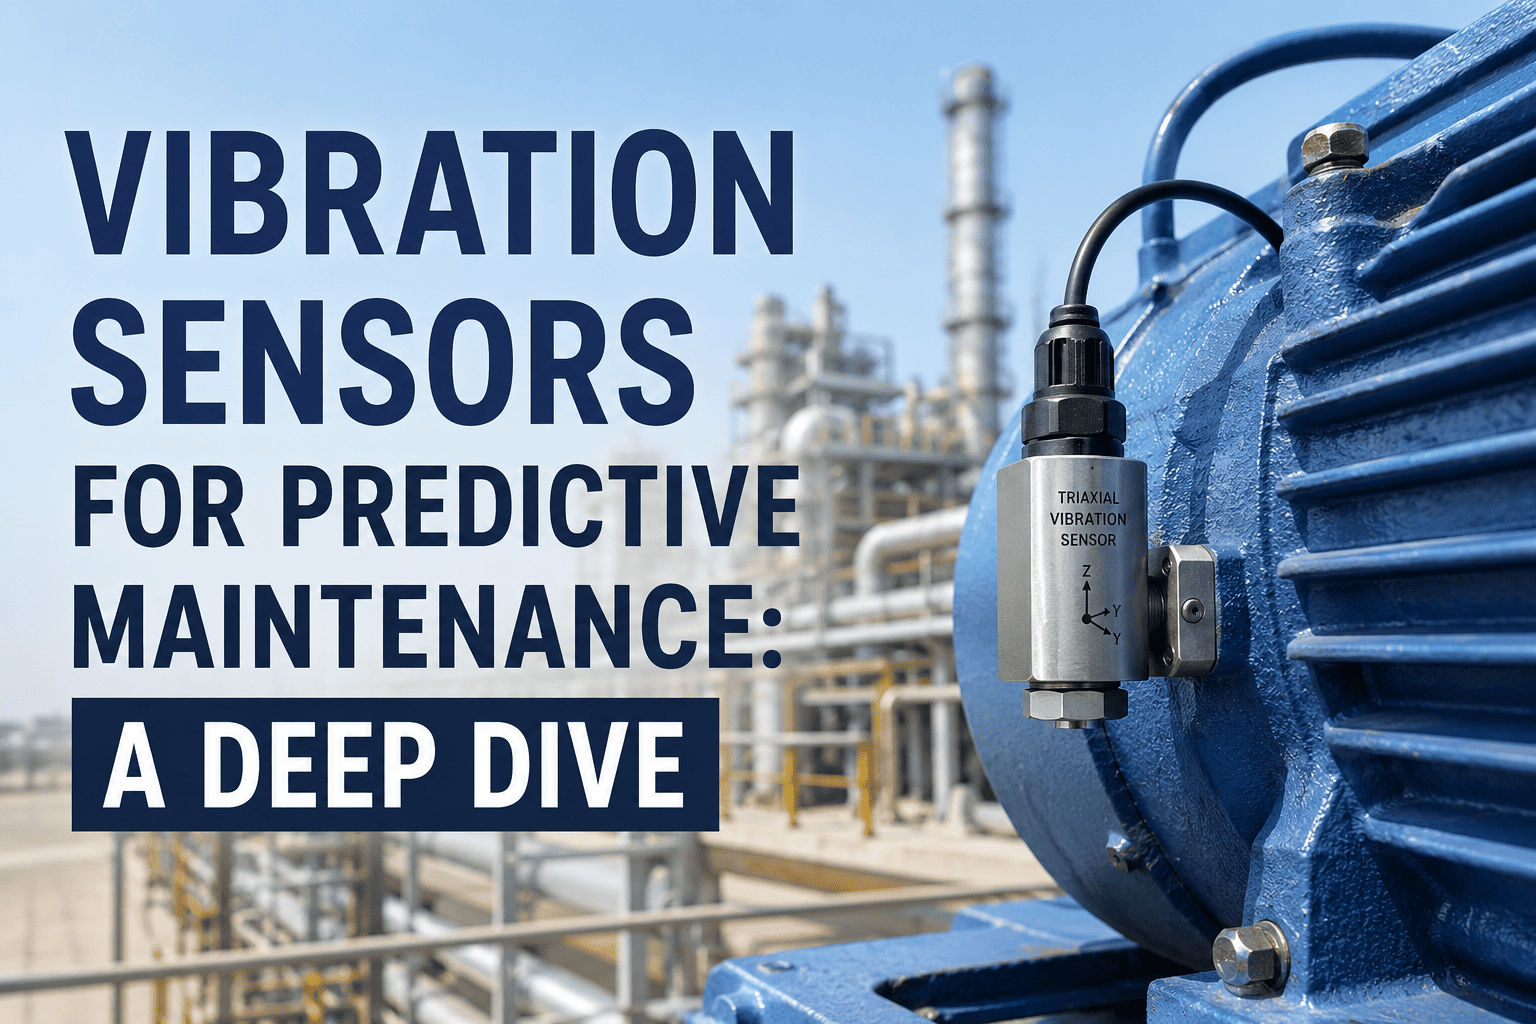
Vibration FFT at bearing defect frequencies
5-12 days
High
Rotary carousel, capper spindles, conveyors
Gearbox wear
Vibration FFT at gear mesh harmonics
4-9 days
High
Main drive, carousel gearbox
Motor winding or rotor fault
Motor current signature analysis
3-7 days
High
Drive, vacuum pump, product pump motors
Vacuum pump degradation
Current, bearing vibration, and vacuum hold time
3-8 days
Medium
Glass and PET line vacuum systems
Valve seal wear and sticking
Fill volume drift, actuation time, and leak events per valve
2-6 days
Medium
Individual filling heads
Capping head torque drift
Torque per head and servo current trending
2-5 days
Medium
Capper and seamer heads
Pneumatic supply loss
Pressure decay and consumption trending
1-3 days
Medium
Valve manifolds, actuators
Sudden glass or part breakage
No reliable precursor
Not applicable
Not PdM-suitable
Manage through inspection, guarding, and handling
The Live Filler Health View
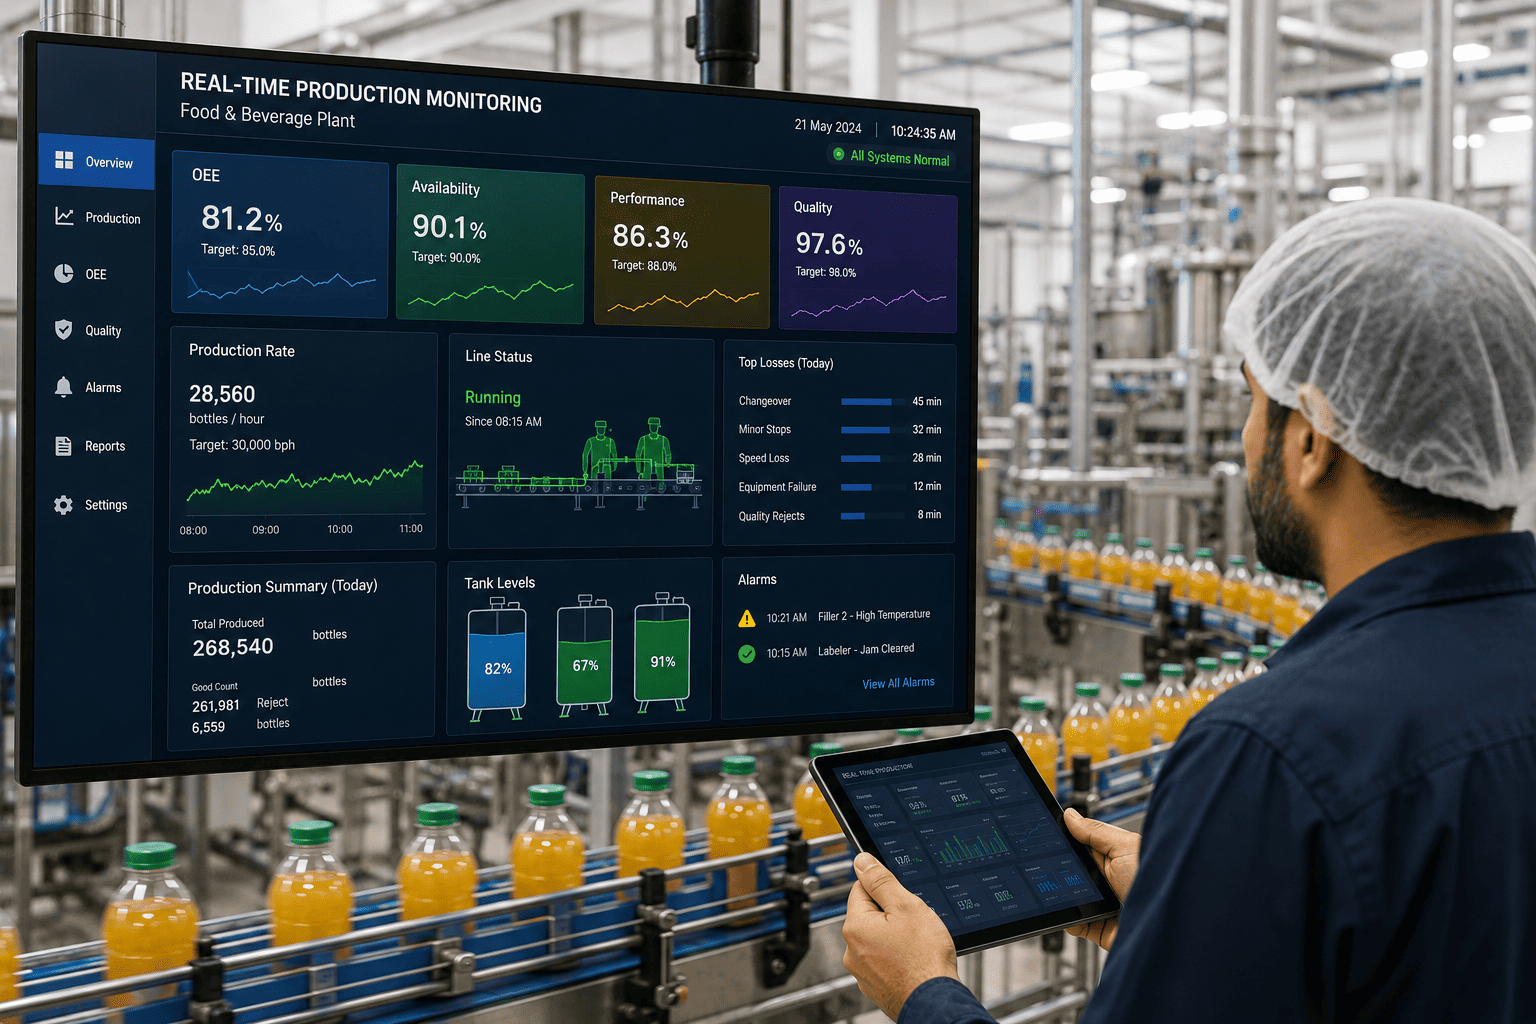
A working programme gives the maintenance team one view per machine: component health, active faults with failure windows, and the planned repair already in the queue. This is what it looks like across a mixed filling hall.
Rotary Filler - F1
48-valve beverage filler
1 watch
Valve 14Driftingfill volume +1.8% over 4 days
Failure window5-8 daysseal kit reserved
Carousel bearingsNormalwithin baseline
Health score81/100repair set for changeover
Capper - C1
12-head screw capper
Healthy
Torque spreadStableall heads within limit
Servo currentNormalno upward trend
Health score92/100no active alerts
Next service21 dayscondition-based
Vacuum Pump - VP2
Filler vacuum system
Intervene - 3 days
Drive-end bearingDefectouter race signature confirmed
Failure window3-5 daysimmediate action
Parts statusIn stockbearing set confirmed
Health score24/100sanitation window booked
Main Drive - F2
Carousel gearbox and motor
Healthy
Gear meshCleanharmonics at baseline
Motor currentNormalload-normalised
Health score90/100no active alerts
Last prevented stop48 days agogearbox - 3 hours saved
The 90-Day Rollout for a Filling Line
Filler programmes fail when they start too wide, skip the baseline, or leave the alert disconnected from the work order. This sequence keeps the scope tight and fits the work around planned changeovers and sanitation windows.
Phase 1
Foundation - Days 1 to 30
Week 1
Failure history and priority components
Review 24 months of filler stops by component. Rank by lost hours and frequency. Typically the first scope is the drive, vacuum pumps, and the worst-performing valves.
Week 2 to 4
Data audit and sensor installation
Connect existing PLC, drive, and fill data first. Add vibration and current sensors on frames and motors only, installed during planned downtime.
Phase 2
Baseline - Days 31 to 60
Week 5 to 6
Baseline by speed, product, and pack size
The models learn normal behaviour across line speeds, product viscosities, and changeovers. No alerts are raised in this period, which prevents early false alarms.
Week 7 to 8
Thresholds and work order loop
Set alert limits per failure mode, then test the full path from alert to work order, parts check, and booked changeover slot.
Phase 3
Live - Days 61 to 90
Week 9 to 10
First live alerts and interventions
Alerts go live. The maintenance lead confirms each fault diagnosis before repair, and the first prevented stop is documented with the cost avoided.
Week 11 to 12
Pilot review and expansion
Review alerts, false alarm rate, and downtime avoided. Use the results to extend to the next filler, the capper, and the labelling and packing equipment.
Want to see which filler components your stop history points to first? Book a demo - bring your filler downtime log and the last 12 months of work orders, and we will build the monitoring plan in the first session.
What Filler Predictive Maintenance Delivers
These are the outcomes a structured programme should be measured against, tracked per filler and per component after the first 12 months of live operation.
40%
Fewer unplanned stops
on monitored filler, capper, and pump assets
3-9 days
Warning lead time
on bearing, gearbox, and motor faults
Planned
Repair windows
fitted into changeovers and sanitation stops
Less
Giveaway and rejects
as valve drift is caught before volumes go out of tolerance
Frequently Asked Questions
Do the sensors touch product or need to be validated for food contact?
No. Vibration, temperature, and current sensors are fitted to machine frames, motor housings, gearboxes, and electrical cabinets, away from product contact surfaces. Valve condition is inferred from fill volume, actuation timing, and pressure data already available on the machine. Where sensors sit in washdown areas, we specify enclosures rated for the cleaning regime used on your line.
Our filler runs many products, speeds, and pack sizes. Won't that confuse the model?
It would confuse a fixed threshold, which is why we do not use one. The baseline is built per machine and conditioned on line speed, product, and pack size, so a heavier product or a faster run is treated as normal behaviour and not as degradation. The baseline period is designed to capture your real product mix, including changeovers, before any alerts go live.
Can we start without adding sensors to the filler?
Often, yes. Modern fillers expose drive currents, torques, fill volumes, valve timings, and pressures through the PLC and drives. We start with an audit of what is already available, run monitoring on that data, and add vibration or current sensors only where the existing signals leave a gap, typically on gearboxes, bearings, and vacuum pumps.
How do we avoid false alarms that make the team stop trusting alerts?
Three controls do most of the work: machine-specific baselines, a confirmation window before a watch alert escalates to an intervene alert, and a structured review of every false alarm in the first 60 days to adjust limits. Each alert also names the failing component and shows the evidence, so the technician can check it quickly rather than guess.
Plan the stop before the filler plans it for you.
See iFactory Predictive Maintenance Running on Your Filling Line
Bring your filler downtime log, your last twelve months of work orders, and the five stops that cost you the most. We will map each to a monitoring approach, show what existing machine data already covers, and plan the sensor gaps before any hardware is specified.
40%
fewer unplanned stops
No wetted
parts instrumented
90-day
pilot to first ROI