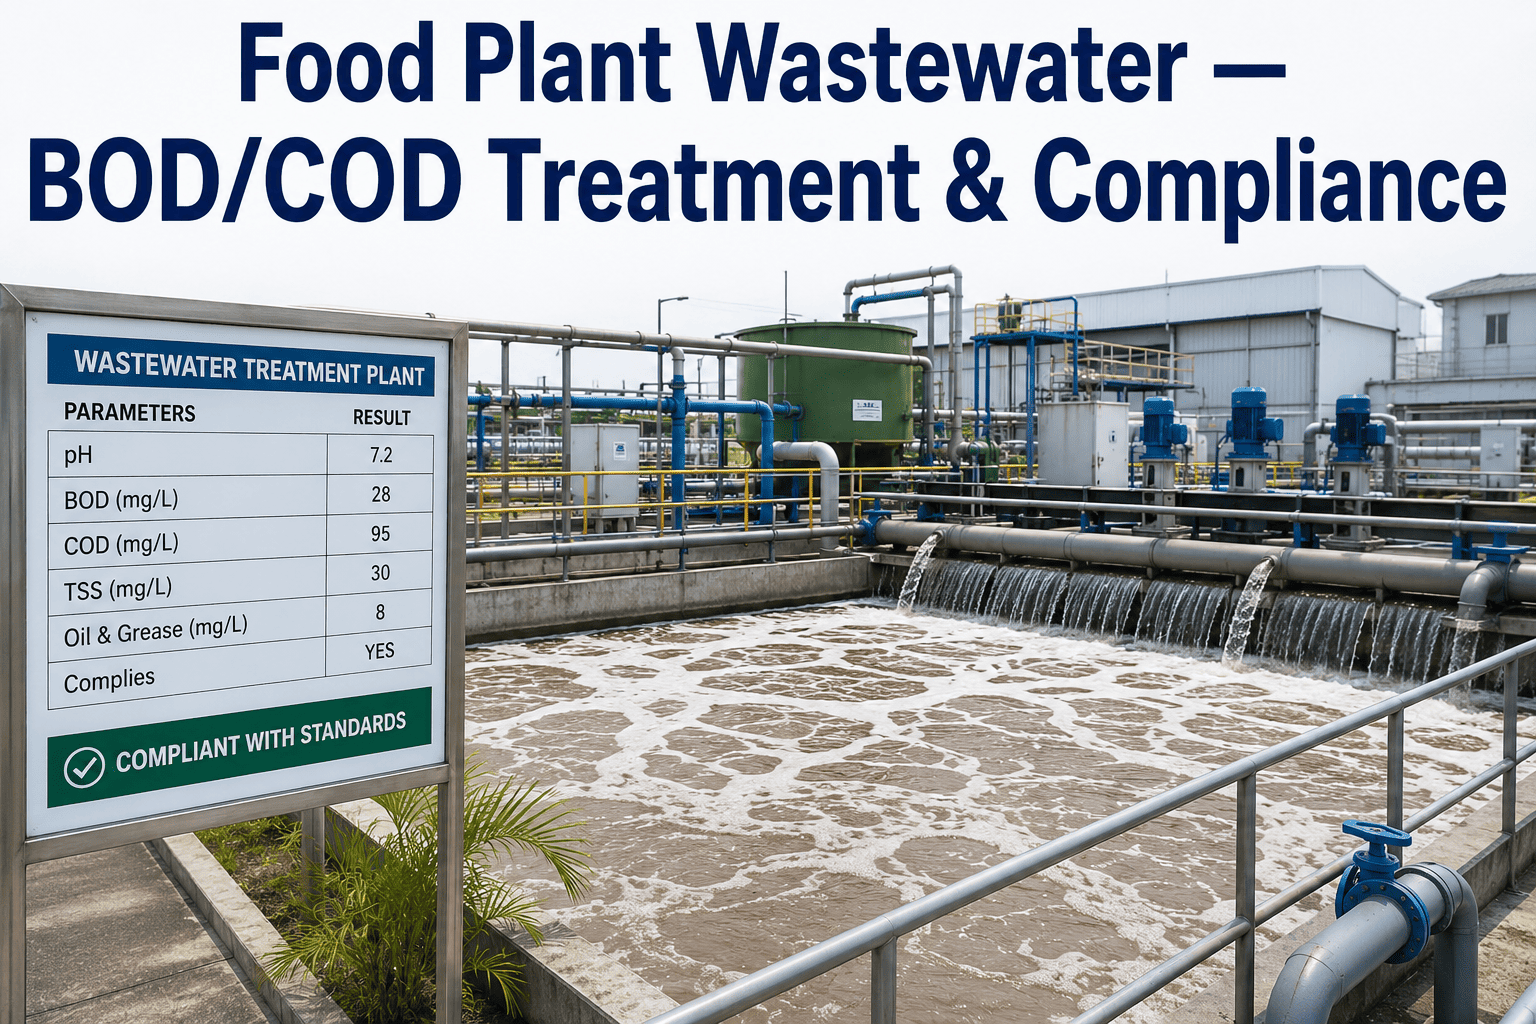
Food and beverage wastewater is not like municipal sewage. BOD values in a typical food plant's discharge regularly reach 2,000 to 8,000 mg/L, ten to forty times higher than what a city treatment plant expects, and fats, oils, and grease can clog screens and foul biological systems within hours if dosing drifts even slightly. Most consent-to-discharge permits cap final effluent BOD between 20 and 50 mg/L and COD between 100 and 250 mg/L, which means a plant is running a chemistry-intensive treatment train every single shift just to stay under the number a municipal inspector will check. When a lab sample comes back showing a spike, the non-compliant discharge has often already left the plant, which is exactly the gap continuous AI-driven monitoring is built to close.
Stop Chasing Lab Results. Start Seeing Effluent Quality Live.
iFactory streams pH, dissolved oxygen, turbidity, and BOD/COD surrogates from your treatment train to a single dashboard, predicts dosing before a discharge violation happens, and turns every reading into an audit-ready compliance record automatically.
Twice-a-Day Sampling Cannot Catch What Your Line Produces Every Minute
Manual grab sampling twice a day cannot catch the rapid influent swings a food processing line throws at a treatment system between shifts, cleaning cycles, and product changeovers.
A BOD or FOG excursion that reaches a municipal sewer before it's caught triggers surcharge billing, regulatory notices, and in repeat cases, discharge permit review.
Continuous sensor streams paired with predictive dosing models close the gap between what's happening in the tank and what an operator can see and react to in time.
Your Treatment Train, Monitored End to End
Screening & DAF
Dissolved air flotation removes fats, oils, grease, and suspended solids before they can foul downstream biology or membranes.
FOG · TSS trackedEqualization
Flow and load are buffered so downstream biological treatment sees a steadier feed instead of shift-driven spikes.
Flow · pH trackedBiological Oxidation
Aeration and dosing are tuned continuously so the microbial population stays balanced instead of drifting into bulking or poor settling.
DO · BOD surrogateFinal Discharge
Effluent parameters are checked against your permit limits before the water ever reaches the sewer connection or receiving body.
COD · TSS · pHPredictive Dosing Cuts Chemical Cost, Not Just Risk
Coagulant, polymer, and pH-adjustment dosing decisions made from live influent quality rather than a fixed daily setpoint routinely cut chemical spend by up to 30%, according to recent industrial wastewater design research. The same continuous data stream that protects your discharge permit also removes the over-dosing plants default to when they can't see influent quality in real time.
Typical reduction in coagulant and polymer cost from predictive dosing models
Advance warning predictive fouling models give before a manual inspection would catch it
Continuous pH, DO, turbidity, and conductivity streaming replaces twice-daily manual rounds
Walk Through Your Own Treatment Train With Our Team
Bring your current permit limits and recent lab results, and we'll show exactly where continuous monitoring would have caught your last excursion before it left the plant.
Manual Sampling vs. Continuous Monitoring
| Parameter | Manual Grab Sampling | iFactory Continuous Monitoring |
|---|---|---|
| Sampling frequency | Twice daily, lab turnaround hours later | Continuous, streamed live to dashboard |
| Dosing adjustment | Fixed setpoint, adjusted manually | Predictive, adjusted from live influent data |
| Excursion detection | After the sample is analyzed | Before non-compliant discharge occurs |
| Compliance reporting | Manually compiled from logs | Auto-generated, audit-ready |
| Membrane or filter fouling | Caught during scheduled inspection | Predicted days ahead from TMP trends |
Frequently Asked Questions
Can this work alongside our existing DAF and biological treatment equipment?
Yes, the monitoring layer is designed to sit on top of your existing treatment train rather than replace it. Sensors for pH, dissolved oxygen, turbidity, and conductivity are added at key points across screening, DAF, equalization, and biological stages, streaming into a single dashboard without requiring you to swap out functioning process equipment. Most food plants keep their current DAF units, aeration basins, and clarifiers exactly as they are and simply gain visibility they didn't have before. You can walk through your specific setup with our team through this booking link.
How does predictive dosing actually reduce chemical costs?
Most plants dose coagulant, polymer, and pH-adjustment chemicals against a fixed daily setpoint that has to account for worst-case influent conditions, which means over-dosing during normal operation. Predictive models built from live influent quality data adjust the dose continuously to match actual conditions rather than a conservative average, which is why facilities using this approach commonly see chemical cost reductions of up to 30%. The savings compound over a year because the reduction applies to every dosing cycle, not just the excursions that used to require emergency correction.
What happens when the system detects a parameter approaching our discharge limit?
An alert routes to the responsible operator immediately, well before the water reaches the discharge point, giving the team time to adjust dosing, divert flow to equalization, or investigate the upstream cause. This is the core difference from grab sampling, where the lab result confirming a problem often arrives after the non-compliant water has already left the plant. Every alert and the corrective action taken is logged automatically, building the compliance record regulators expect to see during a permit review.
Does this help with surcharge avoidance from our municipal sewer connection?
Yes, surcharge billing is typically triggered by BOD, COD, or TSS readings above the baseline your municipality has set in your discharge permit, and continuous monitoring is specifically built to catch drift toward those thresholds before it becomes billable. Because dosing adjusts predictively rather than reactively, plants generally see fewer excursions into surcharge territory in the first place. For a plant-specific estimate of surcharge exposure, reach out through our support page.
How quickly can continuous monitoring be deployed on an existing plant?
Sensor installation across a typical treatment train takes a matter of weeks since it does not require shutting down active treatment processes, and the dashboard begins showing live data as soon as sensors are calibrated. Predictive dosing models need a short baseline period, usually a few weeks of live data, before recommendations become reliable enough to act on automatically. Full deployment including compliance reporting automation is commonly complete within a couple of months from kickoff.
See Your Effluent Data in Real Time, Not Twice a Day
Book a walkthrough and see how continuous monitoring would have flagged your last excursion before it ever left the plant.