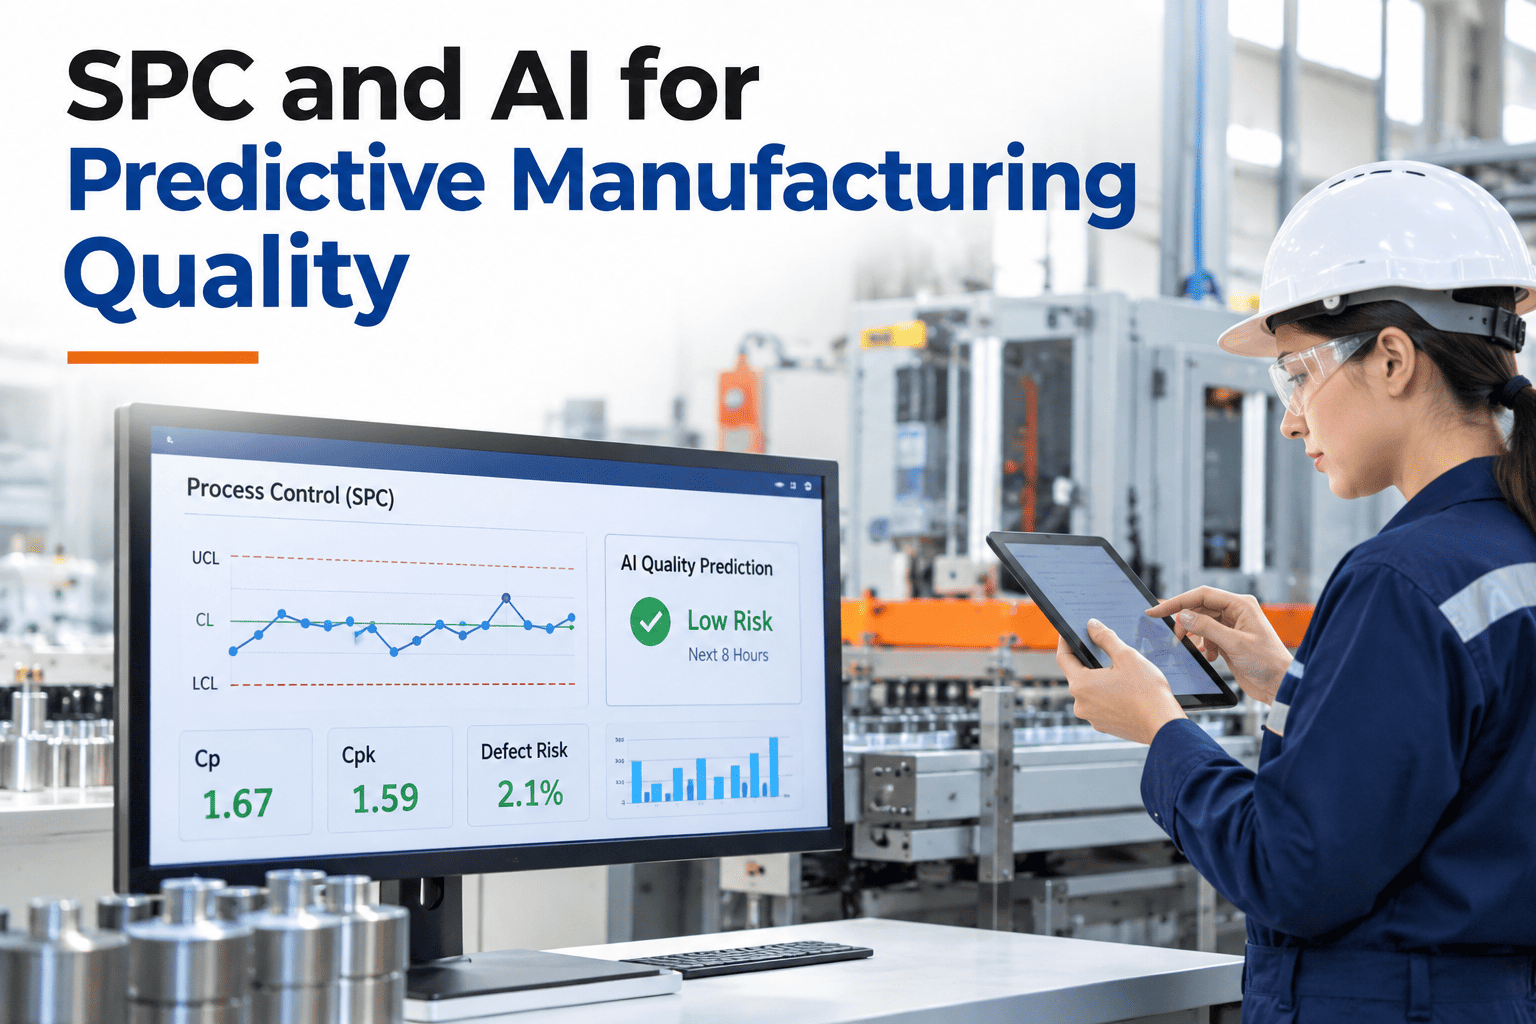
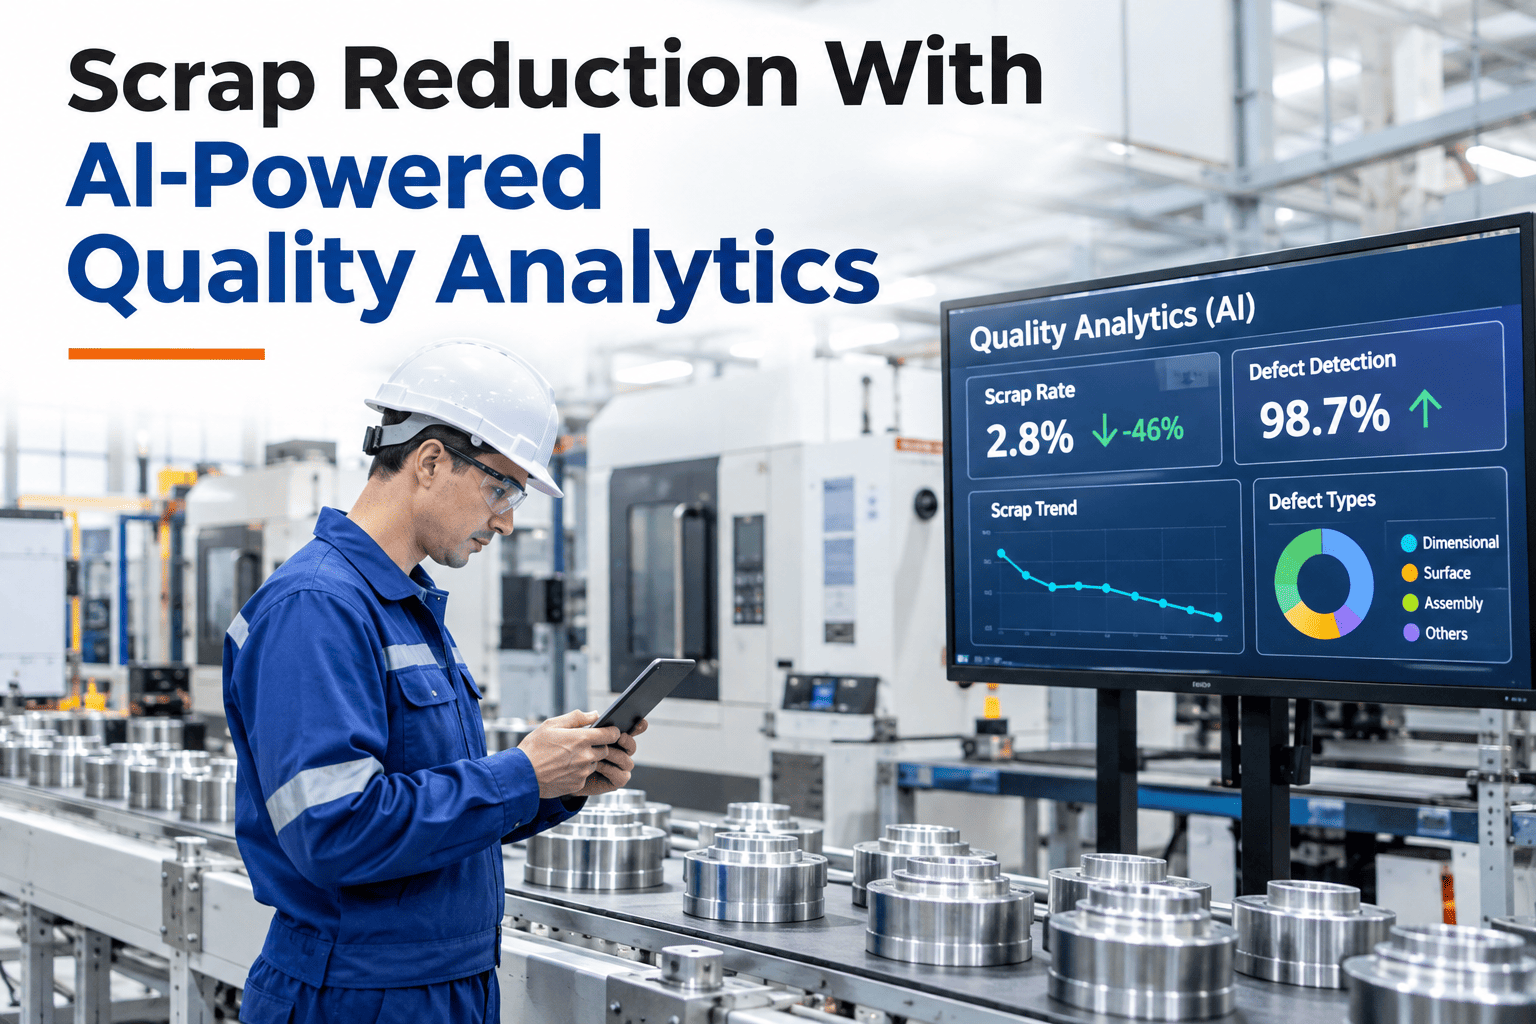
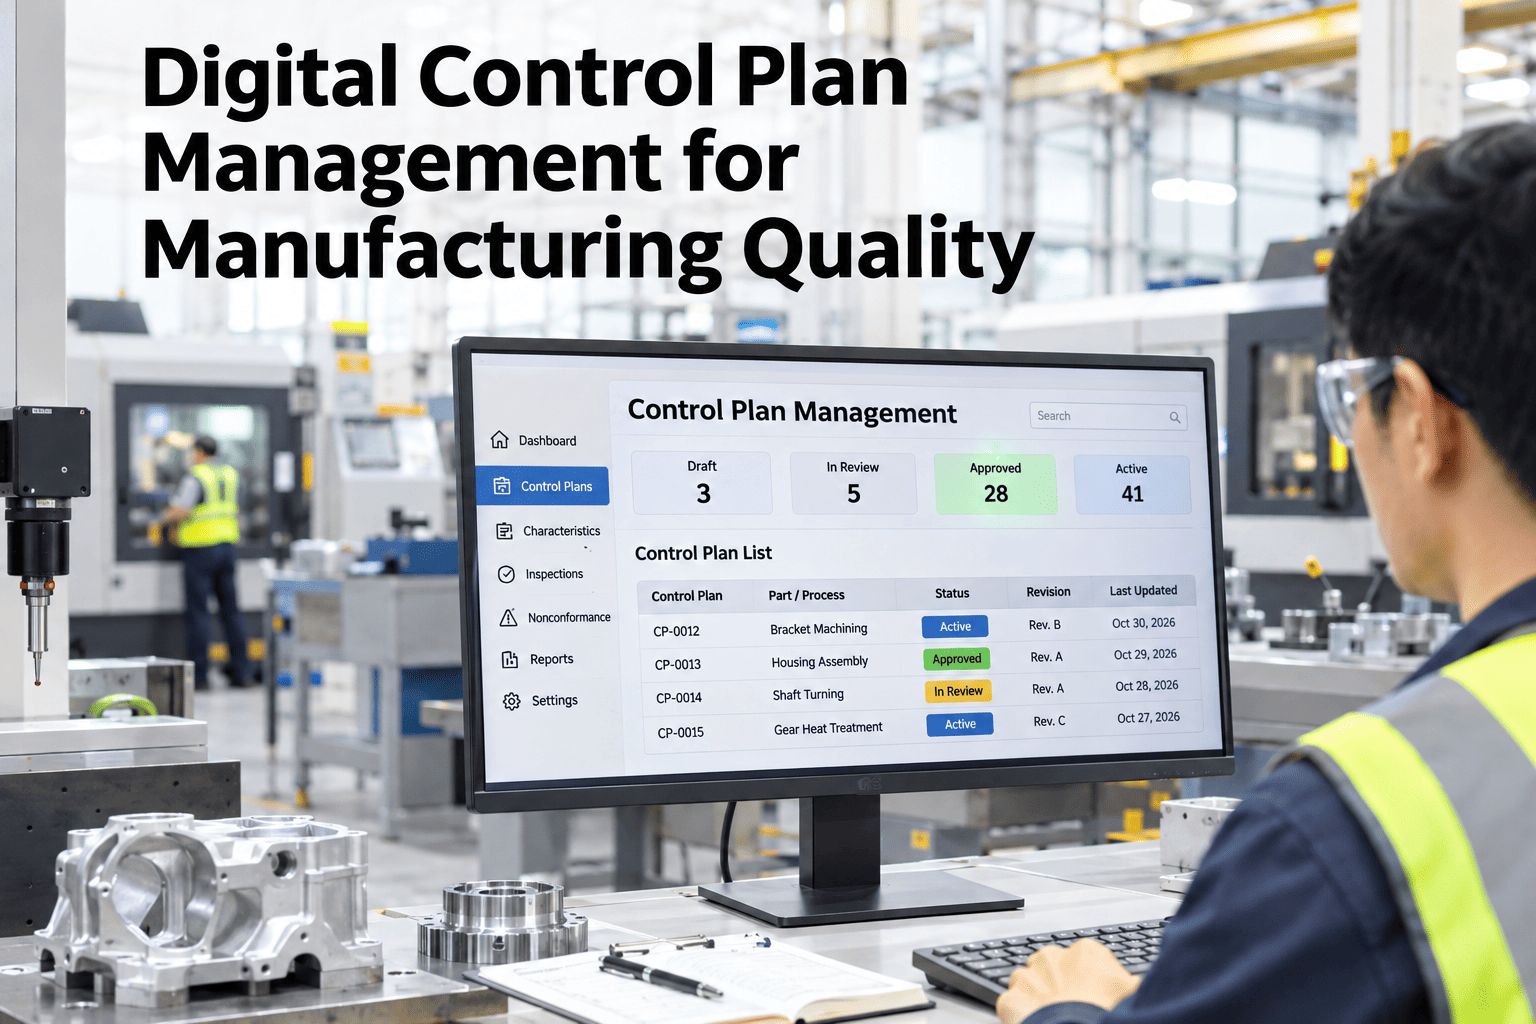
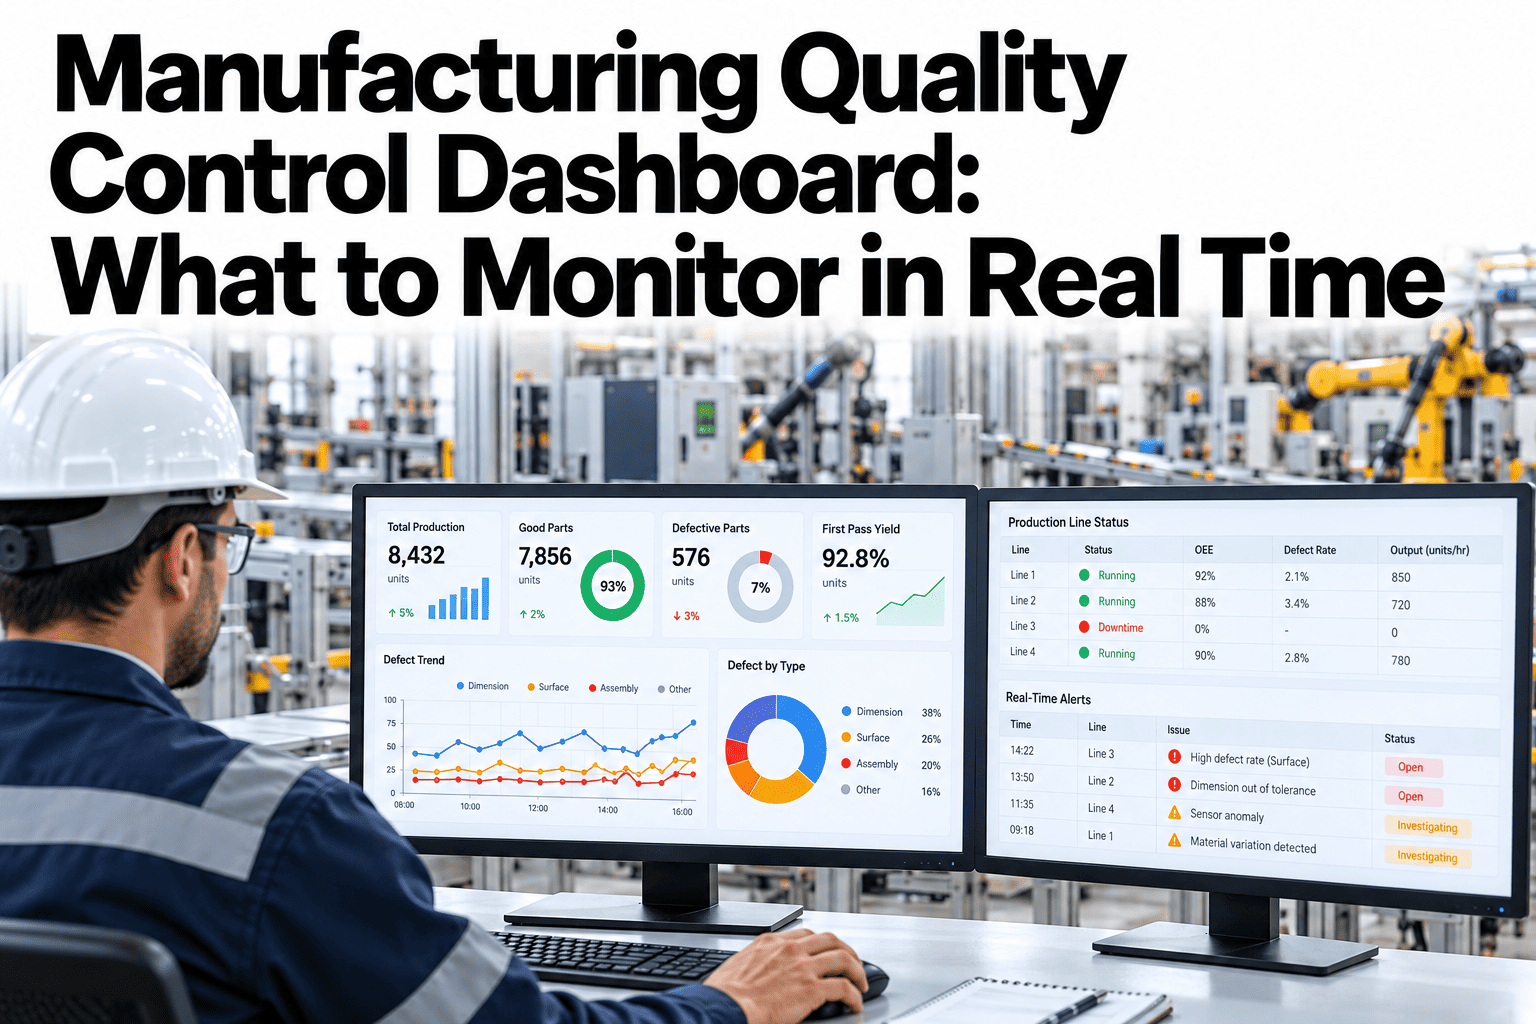
Statistical process control (SPC) and AI work best together: SPC gives a trusted, explainable way to see variation, and AI adds the ability to watch hundreds of signals at once, rank anomalies and predict quality problems earlier. SPC has guided quality since Shewhart introduced control charts at Bell Labs in the 1920s, yet a chart for each parameter cannot see how many small shifts combine into a defect. Quality costs still reach 15 to 20 percent of sales for many manufacturers (ASQ, 2026), so earlier detection has real value. iFactory, an on-premise AI platform for smart manufacturing, layers AI on top of SPC rather than replacing it, and teams can see control charts and AI anomaly ranking side by side on their own data.
Predictive Quality · SPC and AI
Keep the Control Chart. Add the Foresight.
iFactory AI reads the same process data as SPC, then flags the slow drift a single chart rule would catch late.
UCL
Center
LCL
AI flags drift
Rule fires
Illustrative chart. The trend crosses no limit until late, but the pattern is visible earlier.
The basics
What Is the Difference Between SPC and AI Quality Analytics?
SPC monitors a parameter against statistical limits to tell normal variation from a real change. AI quality analytics learns patterns across many parameters and predicts which combinations lead to defects.
| Question | SPC | AI Quality Analytics |
|---|
| What does it watch? | One or few parameters per chart | Hundreds of signals together |
| How does it decide? | Fixed rules and control limits | Learned patterns from history |
| Strength | Simple, explainable, trusted | Finds combined and subtle shifts |
| Weakness | Blind to multi-signal interaction | Needs good data and review |
| Best use | Confirming stability and capability | Early warning and prioritization |
They are partners, not rivals. To see how the two share one data source, ask our team how SPC rules and AI scores sit together.
The classic signals
Which SPC Rules Still Matter?
Four widely used chart rules remain the backbone of process monitoring. AI should respect them, not hide them.
1
One point beyond three standard deviations from center
2
Two of three points beyond two standard deviations
3
Four of five points beyond one standard deviation
4
Eight points in a row on one side of center
Rules three and four already catch slow drift, but only after several points. AI aims to flag the same pattern sooner and across more parameters.
The gap
Where Does SPC Alone Fall Short?
Charts excel at single parameters. Defects often come from interaction, which a single chart cannot show.
Chart overload
Hundreds of charts mean alarms get missed or ignored.
Hidden interaction
Two parameters in limit can still produce a defect together.
Late rule firing
Run rules need several points before they signal.
No ranking
Every alarm looks equally urgent without cost context.
See SPC and AI Working From One Data Set
Share a few process parameters and defect records. iFactory AI will show where AI warns earlier than your charts.
How they combine
How Do SPC and AI Layer Together?
Treat SPC as the foundation and add AI in layers. Each layer depends on the one below it.
Prediction
Estimates defect risk for the current run.
Prioritization
Ranks anomalies by likely cost and impact.
Multivariate anomaly detection
Flags unusual combinations across signals.
SPC foundation
Control limits, capability and trusted rules.
Triage
How Does AI Prioritize Anomalies?
A plant can see hundreds of flags a day. Prioritization narrows them to the few that deserve action now.
Many raw flags from charts and models
Grouped by shared cause and machine
Ranked by defect risk and cost
A short action list for the shift
The ranking uses history, such as which patterns preceded costly defects before. To see a ranked list for your plant, review an anomaly triage view with our team.
A composite scenario
What Does the Combined Approach Catch?
Picture a molding line where temperature and cycle time each stay in limits. Together they drift toward short shots.
Illustrative. Real lead time depends on the process and the quality of the data.
Getting started
How Do You Add AI to an Existing SPC Program?
1
Audit charts
Keep the useful ones.
2
Unify data
One timeline for signals and defects.
3
Run in shadow
Compare AI flags with charts.
4
Go live
Alert operators with ranked causes.
Shadow mode builds trust without risk. iFactory is delivered on an on-premise NVIDIA server, live in 6–12 weeks. For a staged plan, talk with support about a shadow-mode pilot.
PitfallsWhat Mistakes Limit SPC and AI Working Together?
The two methods share one weakness: both depend on good data and sound habits. Six mistakes stand out.
Charting everything
Chart the parameters that matter to quality, since hundreds of charts cause alarm fatigue.
Weak measurement systems
Check gauge capability first, because noisy measurement hides real shifts from both SPC and AI.
Wrong subgrouping
Group samples so variation inside a group is normal and variation between groups is the signal.
Unexplained AI alerts
Require each alert to show the signals behind it, so engineers can judge it.
Replacing rules too early
Run AI in shadow mode and keep chart rules until trust is earned.
Skipping retraining
Review models on a schedule, since process changes alter what normal looks like.
Sound data habits make both methods stronger. To assess yours, ask support for a measurement and subgroup review.
Key termsWhich Terms Should Teams Know?
Eight terms cover the shared language of SPC and AI quality work.
Control limit
A statistical boundary separating normal variation from a real change.
Common-cause variation
Natural, expected spread in a process.
Special-cause variation
A change that comes from an identifiable cause.
Cp and Cpk
Indexes comparing process spread and centering with tolerance.
Subgroup
A small sample taken close together in time.
Anomaly score
A number showing how unusual current signals are.
Multivariate analysis
Looking at several variables together.
Shadow mode
Running a model alongside current methods without acting on it.
To compare terms and alerts on one screen, review SPC and AI views with our team.
Expert review
Combining SPC and AI Responsibly
Holds up
Control charts are proven, and multivariate monitoring adds coverage where single charts cannot see interaction.
Verify
That measurement systems are capable and that data is rational-subgrouped before trusting any signal.
Avoid
Black-box alerts nobody can explain. Every AI flag should show which signals drove it.
Questions
Frequently Asked Questions
Does AI replace statistical process control?
No. SPC remains the trusted foundation for stability and capability, while AI adds multivariate detection and ranking on top. Most plants keep their charts and add AI alongside them.
See the two working together.
What does AI catch that control charts miss?
It finds combinations of small shifts across several parameters that each stay inside limits. These are common causes of defects that no single chart flags.
Ask for examples from similar processes.
How do we trust an AI alert?
Each alert should show the signals behind it and how similar past patterns ended. Running AI in shadow mode first lets teams compare it with their charts.
Plan a shadow-mode trial for one line.
Do we need new sensors?
Often not. Existing PLC, machine and quality data are usually the starting point, and new sensors are added only where a gap is proven.
Review your existing data sources with our team.
Can it run fully on-premise?
Add Foresight to the Charts You Already Trust
Book a session to see iFactory AI rank anomalies alongside your SPC rules on real process data.