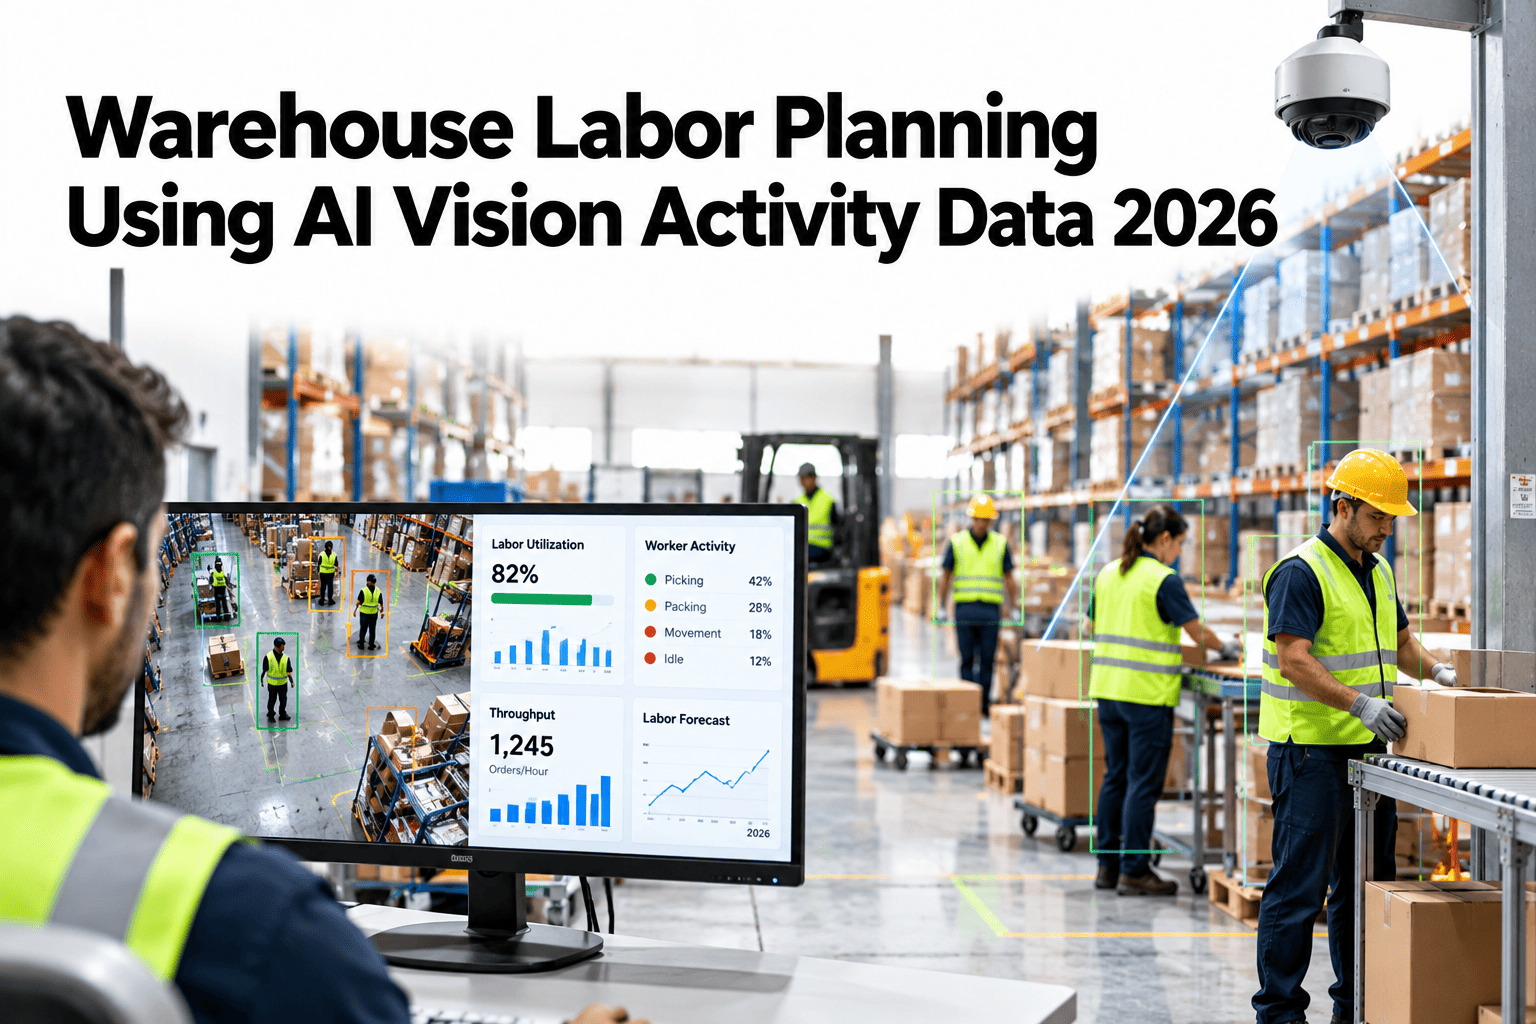
A labor plan built on last year's average picks-per-hour survives a normal Tuesday and falls apart in the first genuinely busy week, because an average from a slower season was never built to predict a peak. Activity data from real floor movement, not an assumed standard, is what makes a staffing decision something you can actually measure against reality instead of defend after the fact. Warehouse operations managers can see labor standards built from real activity data on iFactory AI against their own staffing history.
An Average From a Slow Season Breaks in the First Busy Week
iFactory AI builds labor standards from real activity data, so staffing decisions are measurable against what the floor actually does.
Assumed, not measured
Measured, continuously updated
Why Assumed Standards Break First
A standard averaged across a slow season doesn't reflect peak conditions.
A slotting or process change makes an old standard obsolete overnight.
A different SKU or order profile changes true handling time per unit.
The standard is set once and never checked against what actually happened.
Assumed Standards vs Measured Standards
| Approach | How the Number Is Set | Main Risk |
|---|---|---|
| Historical average | Last period's output divided by hours | Blends good and bad days together |
| Industry benchmark | A published figure from outside your operation | Doesn't reflect your specific layout or SKU mix |
| Engineered standard | Time study on a sample of tasks | Can go stale as conditions change |
| Continuous activity data | Measured from ongoing floor movement | Requires data capture infrastructure |
See What Your Own Activity Data Would Show
Bring your current labor plan to a 30-minute session and compare it against measured floor activity.
From Activity Data to a Staffing Decision
Measure actual task time by zone, role and shift.
Derive a current, defensible per-task time from the data.
Apply the standard to expected order volume.
Set headcount by zone and role, then check it against reality.
A Composite Scenario: The Peak Week the Plan Didn't Survive
Picture a labor plan built from the prior quarter's average picks-per-hour, which looked reasonable on a normal week. The first peak week arrives, order mix shifts toward smaller, more frequent orders, and the plan understaffs picking by a wide margin while overstaffing packing.
Activity data captured continuously, rather than averaged once per quarter, would have shown the mix shift forming days earlier, giving the team time to rebalance staffing between zones before the peak hit instead of during it.
Where iFactory AI Fits
Measures real activity
Captures actual task time from floor movement, not an assumed average.
Updates continuously
Keeps standards current as mix, layout or season changes.
Breaks down by zone and role
Shows where a plan is under or over-staffed, not just the total headcount.
Closes the feedback loop
Checks the plan against what actually happened, every shift.
Expert Review
A warehouse workforce planning perspective, reviewed for accuracy before publication: most labor plans that fail during a peak don't fail because the planner did bad math. They fail because the number going into the math was already stale by the time it was used. Comparing a current plan against measured activity data usually reveals the gap before the next peak does.
Frequently Asked Questions
How is activity-based labor planning different from a traditional time study?
A traditional time study measures a sample of tasks at a point in time and sets a standard from that sample, which can go stale as conditions change. Activity-based planning measures task time continuously from ongoing floor movement, so the standard updates as layout, mix or season changes rather than requiring a new study each time. See how a continuous standard would compare to your last time study in a short session.
What kind of activity data does this rely on?
This generally draws on floor movement and task completion data, which can come from vision-based monitoring, scanner timestamps, or a combination of sources depending on what's already instrumented in your facility. The specific data sources available in your operation shape what's practical to start with. Ask for a review of what activity data your own facility already generates.
How quickly can a labor standard update when conditions change?
With continuous data capture, a standard can reflect a mix or layout shift within days rather than waiting for the next scheduled time study, though the exact responsiveness depends on how much volume of new activity data is needed to produce a statistically reliable update. Explore how quickly your own standards could update with this approach.
Does this replace workforce management software we already use?
Not necessarily. Activity-based standards are often an input that feeds into existing workforce management or scheduling tools, improving the accuracy of the standards those tools use rather than replacing the scheduling system itself. Try a review of how this would feed into your current scheduling tools.
How do we measure whether better labor planning is actually saving money?
Track overtime hours, understaffing incidents during peaks, and overstaffing during slow periods before and after moving to activity-based standards. Because both overstaffing and understaffing carry real costs, even a modest improvement in staffing accuracy across many shifts tends to add up. Join a session that estimates the impact based on your own staffing history.
Build a Labor Plan That Survives the First Busy Week
iFactory AI builds labor standards from real activity data, not last season's average. Book a walkthrough with your own staffing history.