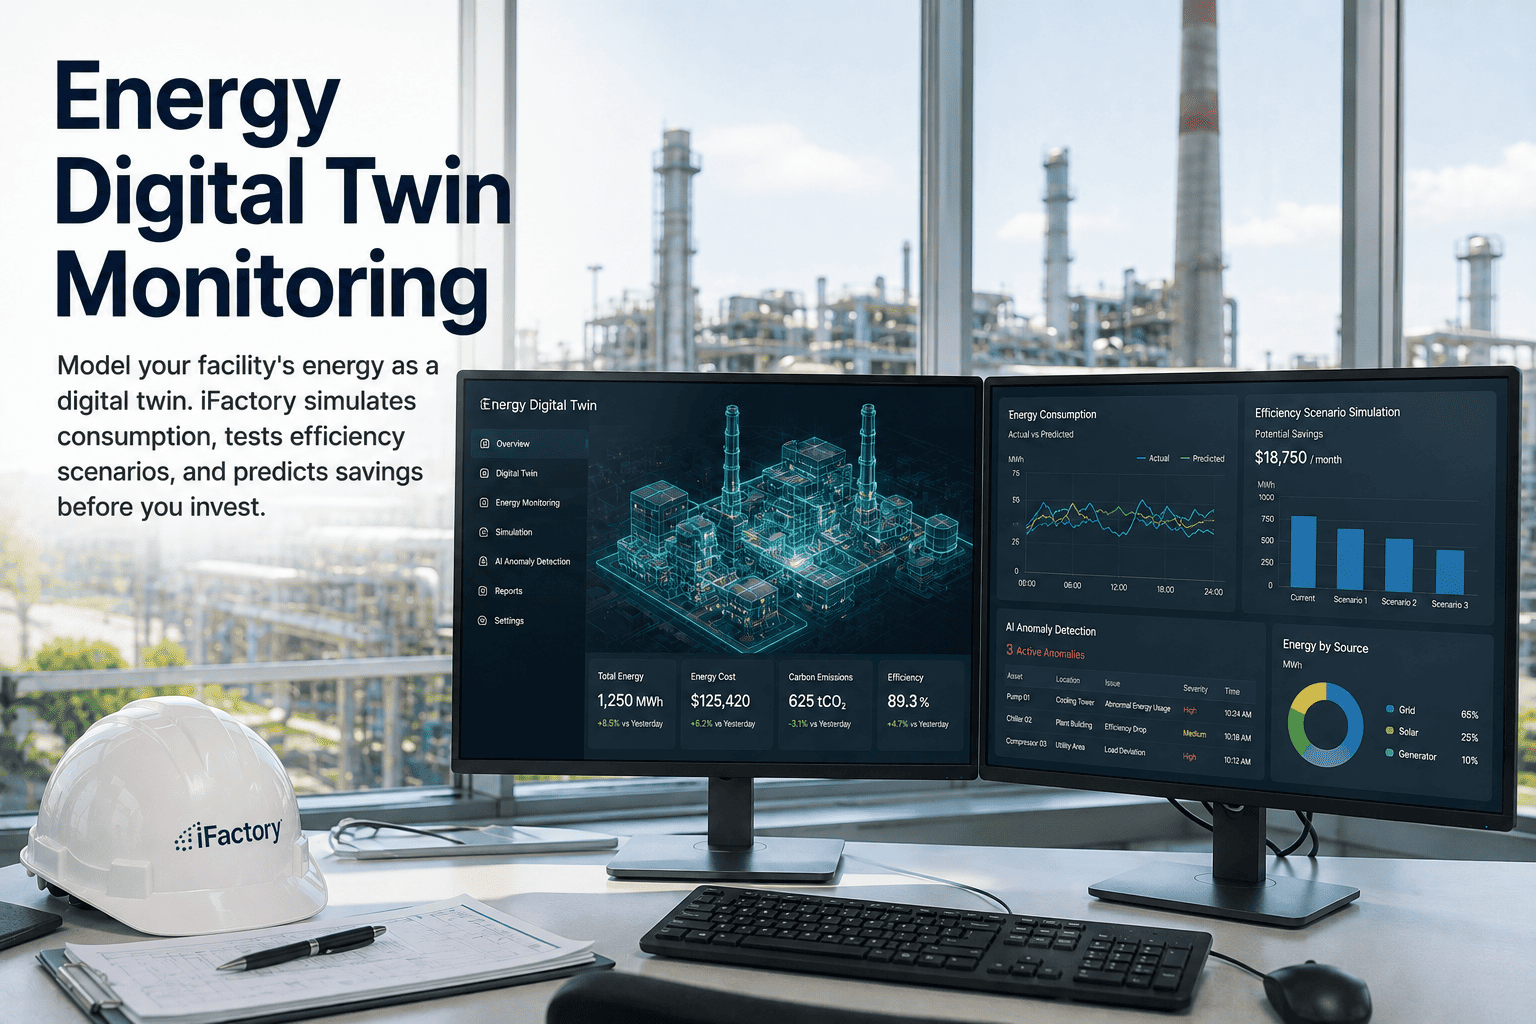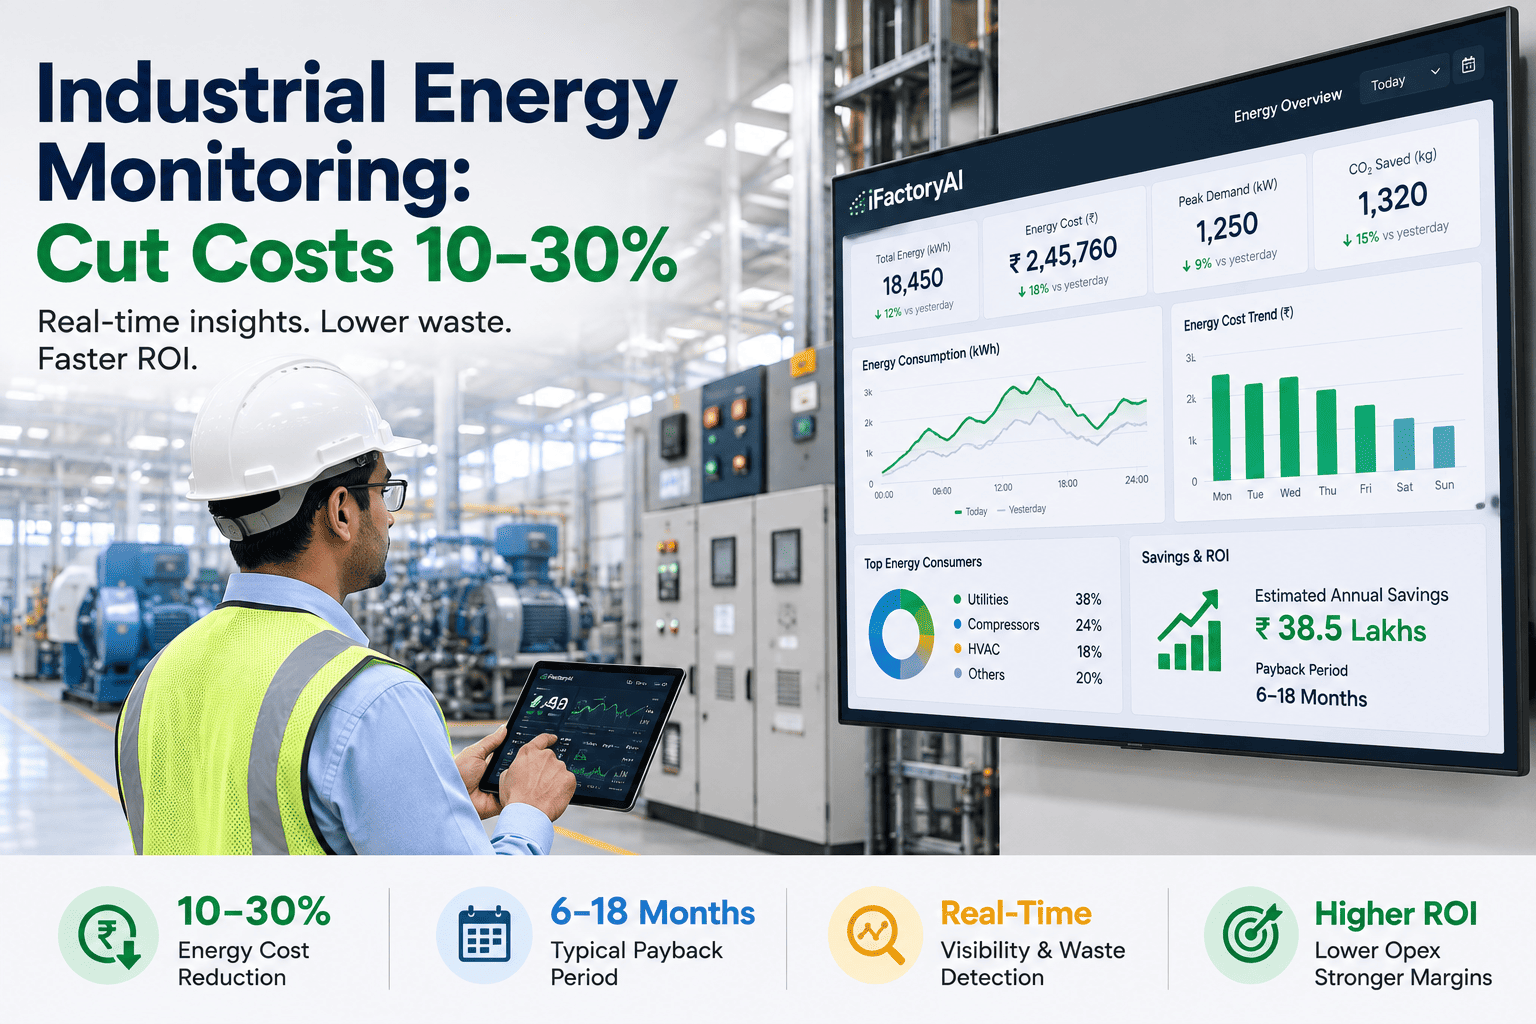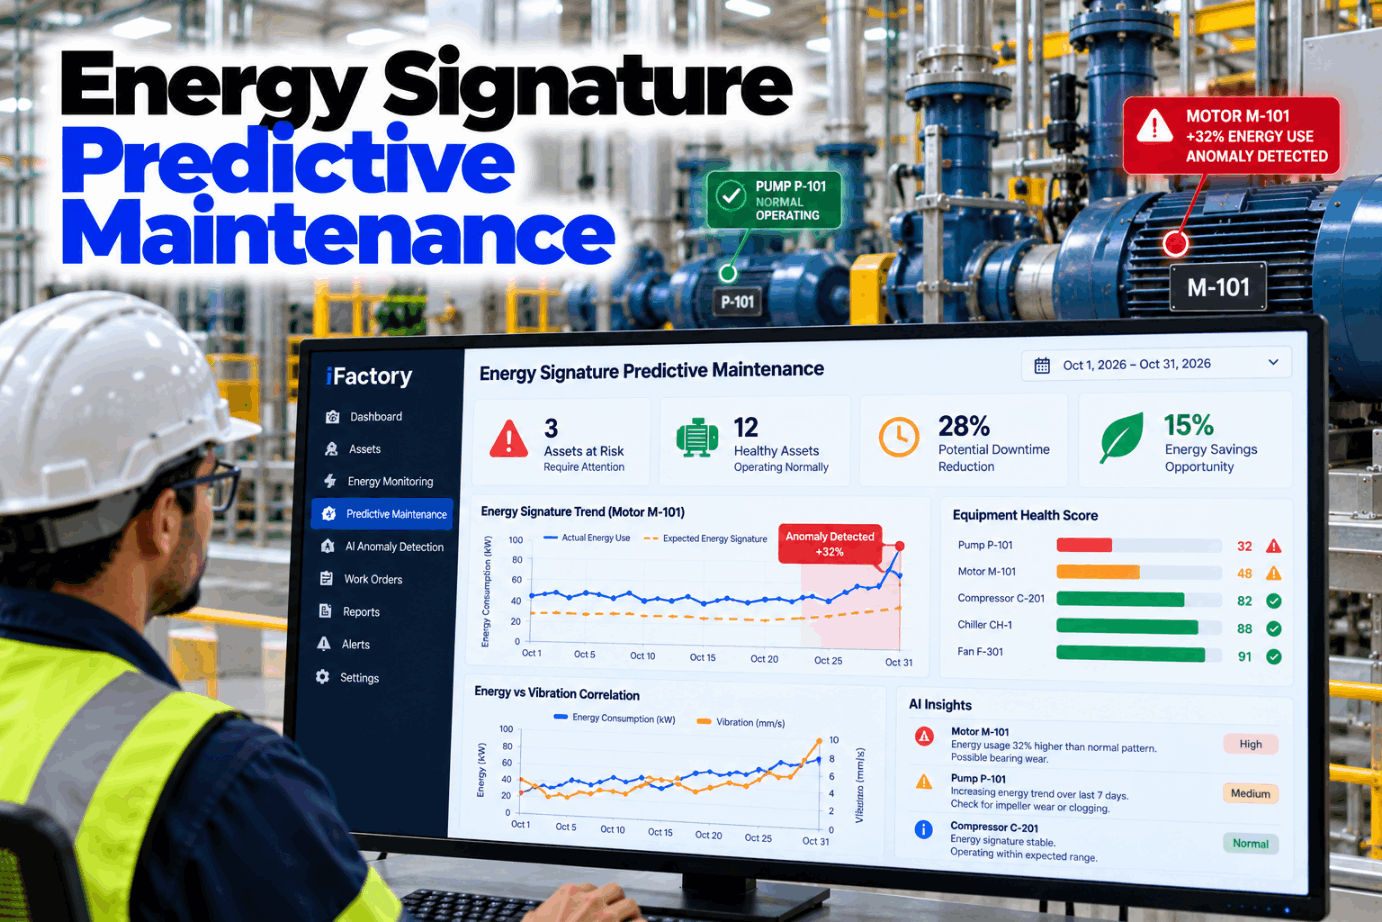
Many machines announce trouble in their power draw before they fail. A pump with worn wear rings needs more kilowatts for each cubic metre it moves, a motor with a cracked rotor bar shows tell-tale sidebands in its current, and a leaking air system keeps compressors loaded when production has stopped. This guide shows which faults energy signatures can catch, how to read them and, just as important, which faults they miss. See the signatures on your own assets in a short energy signature demo.
Catch Failing Motors, Pumps and Fans in Their Power Draw
iFactory AI Anomaly Detection learns each asset's normal energy signature at its own load and speed. When kW per unit of work, current balance or spectral sidebands drift, it flags the asset and raises a work order with the evidence attached.
Five Signatures Hidden in Power Data
An energy signature is the pattern of power, current and voltage an asset shows when it is healthy, at a known load. Faults change that pattern in ways you can measure from the motor control centre, without touching the machine. Some changes are slow, like efficiency loss over months. Others sit in the current waveform itself. Ask our reliability team which signatures your meters can already capture.
Compare Like With Like, Then Flag the Drift
Power always moves with load, speed and process conditions, so a raw kW trend says little. The trick is to compare each reading with what a healthy asset would draw at the same operating point. That is the job of the anomaly model: it learns the normal relationship between power and the process variables, then flags readings that no longer fit. See how operating points are matched in a model walkthrough.
Rotor Bar Sidebands, Worked Through
Motor current signature analysis looks at the frequency content of stator current. A broken or cracked rotor bar produces sidebands at (1 ± 2s) × f, where f is the supply frequency and s is slip. The lower sideband's size relative to the main line tracks how many bars are damaged. Air gap eccentricity and misalignment show as sidebands spaced at running speed around the supply line. The worked example uses illustrative values for a 4-pole motor on 60 Hz. Review your large motors with our motor specialists.
Slip grows with load, so the sidebands move closer to 60 Hz on a lightly loaded motor and are harder to separate. Test at a steady, reasonably high load, and record speed or slip with every reading.
Anomalies Explained, Not Just Scored
iFactory AI Anomaly Detection tells the planner which signature moved, by how much and what it usually means, so the right check is booked before the asset fails. No spectrum reading skills needed.
Pump Wear Shows Up as kWh per Cubic Metre
The affinity laws say flow changes with speed, head with speed squared and power with speed cubed. That is why a pump must be compared at the same speed and system conditions, or normalised first. At a fixed operating point, internal wear lowers efficiency. Lev Nelik's example in Pumps and Systems shows power rising and flow falling as wear ring clearance opens. Energy per cubic metre catches that trend. The trend below uses assumed values. See pump trends on your own data in a pump energy review.
Compressed Air and Fans: Two Easy Wins
Compressed air leaks are a classic energy signature. The Compressed Air Challenge notes that leaks can waste 20 to 30% of a compressor's output, and that a well-maintained system should leak less than 10%. With all air users off, leaks are the only demand. For load and unload compressors it gives leakage % = T × 100 ÷ (T + t), where T is on-load time and t is off-load time. Fans tell a similar story as filters load. Check your air system's idle draw with our energy team.
Unbalanced Supply Heats Healthy Motors
NEMA MG-1 defines voltage unbalance as the maximum deviation from the average line voltage, divided by the average, times 100. For 480, 476 and 466 V the average is 474 V, the largest deviation is 8 V, and unbalance is 8 ÷ 474 = 1.69%. MG-1 gives a derating curve above 1%, and operation above 5% is not recommended. Current unbalance is typically 6 to 10 times the voltage unbalance, which is why it heats windings. Check your motor supplies in a power quality session.
Which Faults Energy Data Catches Well
Energy signatures are strong on some faults and weak on others. The matrix gives a fair starting view, based on how each fault changes power and current. Your asset types and meter quality move the ratings. Map your critical assets with our support team.
Be Honest About Bearings
Bearings are among the most common causes of motor failure, and they are where energy data is weakest. In Benbouzid's widely cited IEEE review, current-based bearing detection had far less published work than rotor bar detection, and bearing frequencies in the current can be masked by load torque swings at the same frequencies. Drive switching noise makes them harder still. Early bearing damage barely changes power at all. Use vibration or ultrasound for bearings, and energy for efficiency, electrical and process faults. Plan the right mix in a monitoring plan review.
- Early bearing defects, before power changes
- Lubrication problems, often heard first with ultrasound
- Looseness, soft foot and structural resonance
- Gear tooth wear at an early stage
- Efficiency loss in pumps, fans and compressors
- Rotor bar faults and supply unbalance
- Leaks and equipment left running when idle
- Whole fleets of small motors with no sensors fitted
A Signature Card for Each Monitored Asset
Fill in one card per asset before alerts go live. It records what the asset should draw, what it is compared against and who acts on a flag. Ask our support team for a blank version.
Put a Price on the Extra Kilowatts
Efficiency drift has a cost you can measure today, before any failure. Use your own run hours and tariff. The worksheet uses the pump example and assumed inputs to show the arithmetic only. Our reliability engineers can help you size your own fleet.
Compare that with the cost of a refurbishment, and add the value of avoided unplanned stops only where your own failure records support it.
Signature Models and AI Server, Ready to Rack
iFactory delivers AI Anomaly Detection as a turnkey package. A pre-configured NVIDIA AI server ships racked and ready with the signature and anomaly models pre-loaded, so power and current data are analysed on site. You rack it, plug in power and Ethernet, and the AI is live. To scope it for your motors, pumps and fans, ask our support team for a turnkey quote.
- Pre-configured NVIDIA AI edge server, racked and ready
- Connectors for power meters, MCC relays and drives
- High-rate current capture for spectral checks
- Process pairing with flow, pressure and speed
- Anomaly models per asset type and operating point
- Work orders raised with the signature evidence
- Training and 24×7 remote monitoring
Server racked, meters and drives linked, critical assets and signals listed.
Healthy signatures learned at each operating point, checked with your team.
Alerts and work orders switched on, planners trained, thresholds tuned.
Energy Predictive Analytics That Knows Its Limits
iFactory AI Anomaly Detection turns power data into maintenance work, and tells you when another technique should confirm. We can outline a pilot on your most critical assets in a pilot planning call.
What Maintenance Leaders Ask About Energy Signatures
Let the Power Draw Tell You What Is Wearing Out
Baseline every motor, pump and fan at its own operating point, flag drift early and confirm with the right check. The full system is delivered turnkey and goes live in 6 to 12 weeks.