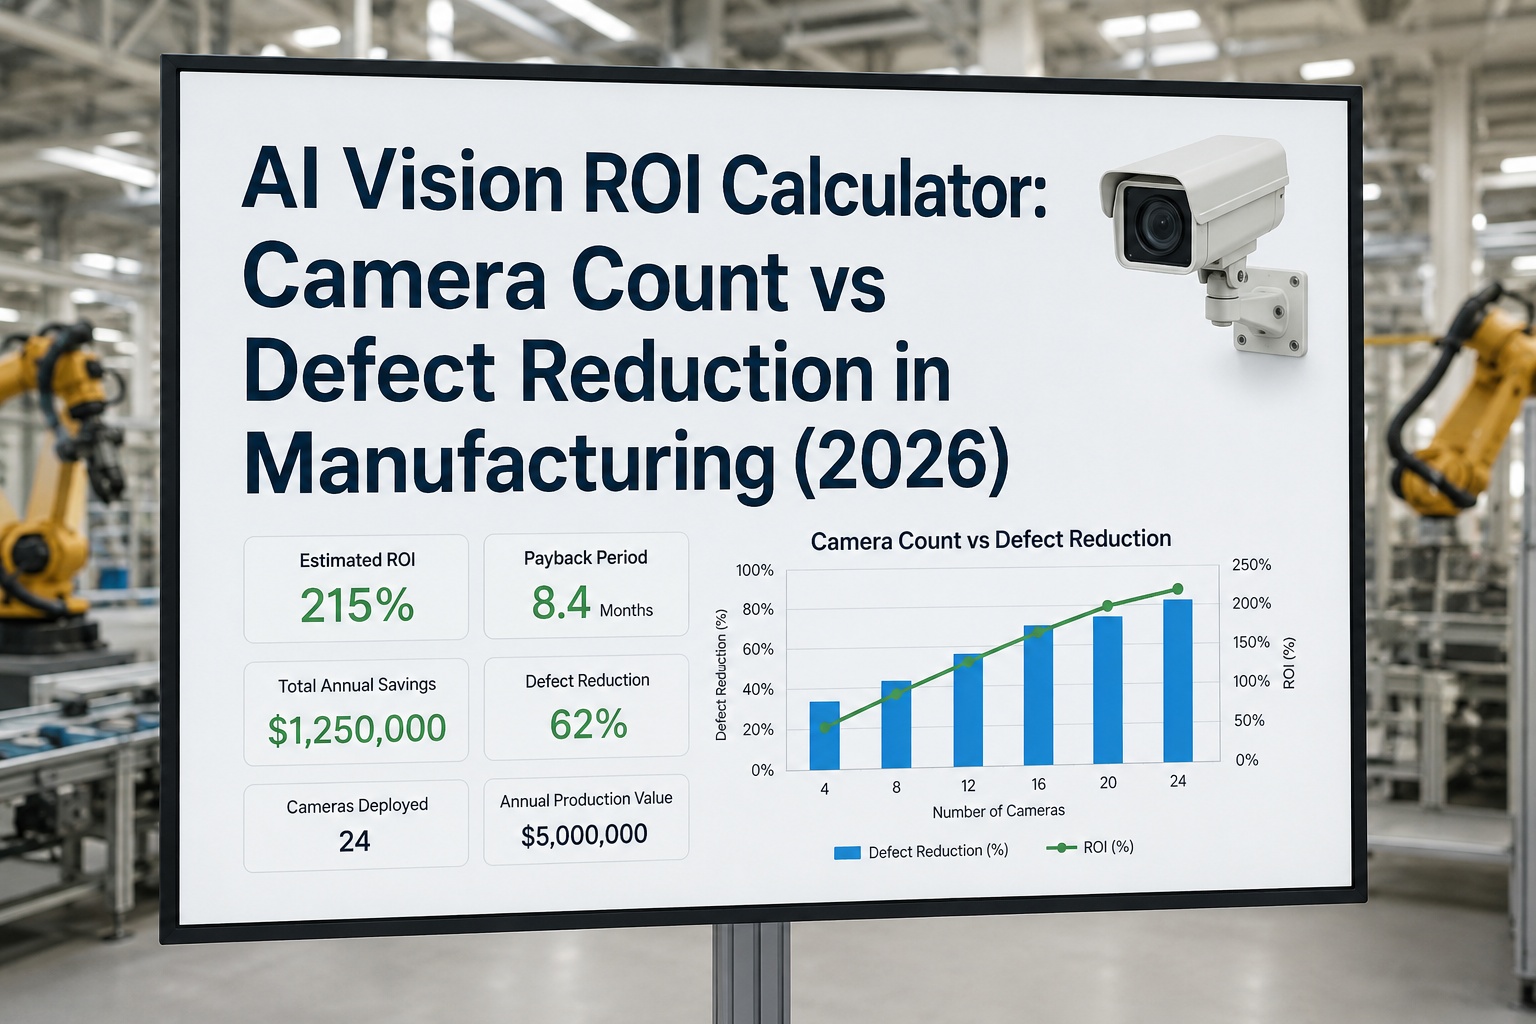
Every AI vision pitch promises a fast payback — but a transactional buyer needs the actual math before signing off. The two levers that move the number most are how many cameras you deploy and how much defect reduction each one drives, and the interaction between them decides whether your payback lands in months or stretches past a year. This article breaks down exactly how AI vision ROI is calculated, gives you a camera-count versus defect-reduction matrix to read against your own plant, and walks through a full worked example — so you can size the investment with confidence before you commit a dollar.
Want your own number instead of a sample? Book a 30-minute ROI session and we will calculate camera count, defect reduction, and payback for your specific lines.
How AI Vision ROI Is Calculated
The formula is simple; the inputs are where accuracy lives. Most manufacturers carry a cost of poor quality of around 20% of revenue — scrap, rework, warranty, and inspection overhead — and that figure is your addressable base. AI vision attacks it two ways: by reducing defect escapes and by freeing the manual inspection labor that a $38,000–$52,000-per-head team consumes across three shifts. Four inputs drive the entire calculation. If you would rather we plug in your real figures, you can run the calculation live with a specialist.
Camera Count vs Defect Reduction: The ROI Matrix
Defect reduction is the dominant lever; camera count mainly widens coverage and benefits from shared edge hardware. Read down for station count and across for the defect reduction your model achieves — each cell shows the typical payback period. Darker cells pay back fastest.
High-volume lines with clear defect types reach the fast tier; complex, low-volume, high-mix operations often run 12–24 months. The matrix shows typical ranges, not a guarantee.
Curious where your lines land on this matrix? Book an AI vision ROI workshop and we will place your defect profile and volumes on the grid.
A Worked Example: 6 Cameras, 30% Defect Reduction
Here is the full calculation behind the sample at the top, for a high-volume line with clear defect types. Every figure is illustrative and stated so you can swap in your own.
That result sits squarely in line with the 374% average three-year ROI and 7–8 month payback documented across AI visual inspection deployments. Push defect reduction to 35% or add coverage on high-defect lines, and the payback compresses further.
Ready to model your own ROI with real numbers? Book a custom ROI calculation and see payback and three-year ROI for your plant in 30 minutes.
Get Your Custom AI Vision ROI Number
iFactory builds the ROI model from your defect profile, production volume, and inspection labor — then deploys on existing IP cameras and routes every detection into your CMMS. See your real payback before you invest.
Expert Perspective
The single biggest mistake in AI vision ROI math is overcounting camera coverage and undercounting defect reduction. Buyers fixate on how many cameras they can afford, when the real driver is how much escape and scrap each tuned model actually eliminates. We always anchor the model on a measured defect-reduction figure from a short pilot, not a vendor promise — because that one input swings the payback from fourteen months to seven. Get the defect-reduction number honest, and the rest of the calculation almost takes care of itself.
— AI Vision ROI Practice, iFactory Engineering Team
average three-year ROI documented on AI visual inspection
of revenue lost to the cost of poor quality at a typical plant
average annual per-line savings in inspection labor alone
The Bottom Line
AI vision ROI is not a mystery — it is a four-input calculation anchored on one honest number: how much defect reduction your model delivers. Size your investment by the stations needed to cover your highest-defect lines, apply a conservative reduction estimate, add the labor you free, and the payback falls out. For most high-volume lines that lands inside a year, and often inside seven months. The smartest move before signing is to run the math on your own figures rather than a brochure average — and to prove the defect-reduction input on a single pilot first.
Run the Numbers on Your Own Plant
From a pilot that proves your defect-reduction rate to a full camera-count and payback model, iFactory helps greenfield teams justify AI vision before they invest — and deploy it the moment the math checks out.
Frequently Asked Questions
How do you calculate the ROI of AI vision cameras?
Multiply your addressable quality cost by the expected defect reduction, add the inspection labor you free, then subtract the system cost. Payback is the investment divided by monthly savings, and three-year ROI is three years of savings minus investment, divided by investment. The defect-reduction figure is the input that moves the result most.
How many cameras do I need for a good ROI?
Start with the smallest number that covers your highest-defect lines — often one to a few stations — rather than a plant-wide rollout. Camera count mainly widens coverage, and because models share edge hardware, adding stations later carries low marginal cost. Coverage of the costliest defects matters far more than raw camera quantity.
What payback period should I expect?
High-volume lines with clear defect types commonly pay back in six to eight months, and the documented average three-year ROI is around 374%. Complex, low-volume, or high-mix operations run longer, typically 12 to 24 months, because the labor baseline is lower and models need more retraining. Your defect cost and volume set the range.
Does adding more cameras improve or hurt ROI?
It helps as long as each new station covers genuinely defect-prone work. Because additional models run on the same edge hardware, the marginal cost of expansion is low, which is why ROI tends to compound. The exception is adding cameras to low-defect lines, where there is little quality cost to recover, so returns flatten.
How do I get an ROI estimate for my plant?
The most reliable estimate starts with a short pilot that measures your real defect-reduction rate, then feeds your quality cost, volume, and inspection labor into the model. That replaces brochure averages with figures specific to your lines. You can book a custom ROI calculation to build it for your facility.