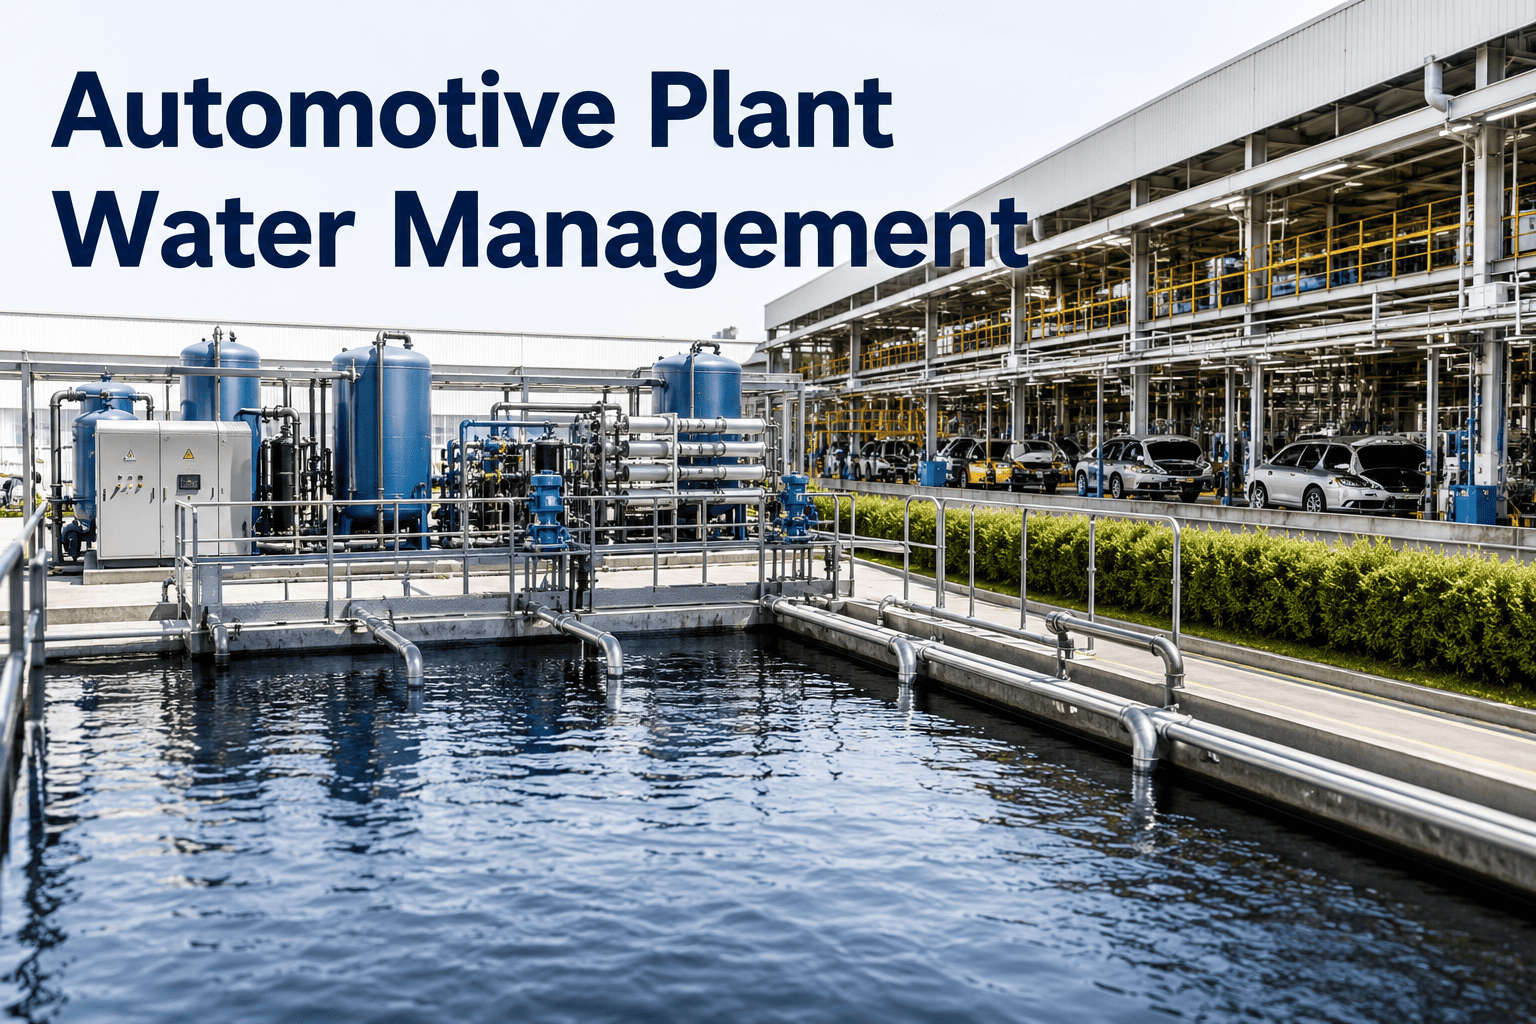
Paint shops and pretreatment lines are the single largest water draw in most automotive plants, often accounting for well over half of total site consumption once phosphating, e-coat rinsing, and cooling are added together. Every gallon that goes down the drain unmetered is a gallon a plant cannot account for when a municipal discharge audit arrives or when a drought-driven surcharge hits the utility bill. Most sites still manage water reactively, adjusting rinse flow by feel rather than by real consumption data tied to production volume. iFactory connects flow meters, conductivity sensors, and discharge quality monitors into one live water model so plant engineers can see exactly where every gallon is going, and you can book a demo to see it mapped against your own utility bills.
WATER INTELLIGENCE FOR AUTOMOTIVE PLANTS
Every Rinse Tank Is a Cost Center — Most Plants Just Never Metered It
iFactory turns intake meters, rinse conductivity sensors, and discharge monitors into a single closed-loop water model, so reuse, treatment, and compliance decisions are based on live data instead of quarterly guesswork.
01
Fresh Intake
Metered at source
02
Pretreatment Rinse
Phosphate & e-coat stages
03
Recovery & Treatment
Filtration, RO, or DI
04
Reuse or Compliant Discharge
Routed back or released
THE COST NOBODY LINE-ITEMS
What Unmetered Water Actually Costs an Automotive Plant Per Year
These figures reflect what plant engineering teams typically find once they install submetering across pretreatment, paint booths, and cooling loops for the first time. The gap between assumed and actual consumption is almost always larger than expected.
Paint Shop Share of Site Water Use
Up to 60% of total plant consumption
Freshwater Cut Achievable With Reuse Loops
30 to 40% reduction with rinse water recovery
Sites Without Real-Time Discharge Monitoring
Majority still rely on periodic manual sampling
Typical Payback Window on Metering Retrofit
Under 18 months for mid-size paint shops
WATER MAP
Where Water Actually Goes Across an Automotive Manufacturing Plant
Before any reduction program can work, engineering needs a process-level breakdown of consumption rather than a single site-wide utility number. The table below reflects the typical distribution across major process areas in a body-in-white and paint operation.
| Process Area | Primary Water Use | Relative Share | Reuse Potential |
|---|
| Pretreatment & Phosphating | Multi-stage spray and immersion rinse | High | High with cascade rinse design |
| E-Coat Rinse Stages | Ultrafiltrate rinse recovery | High | Very high, near closed-loop |
| Paint Booths | Overspray scrubbing water walls | Medium | Medium with sludge separation |
| Cooling Towers | Evaporative cooling for compressors | Medium | Low, mostly evaporative loss |
| Cleaning & Utility | Floor wash, equipment cleandown | Low | Medium with graywater capture |
REDUCTION LEVERS
Four Levers That Cut Freshwater Draw Without Touching Line Speed
None of these levers require slowing the paint line or changing the pretreatment chemistry. They work by making existing water infrastructure visible and controllable rather than replacing it.
1
Cascade Rinse Sequencing
Reroute rinse stages so the cleanest final rinse water feeds backward into dirtier earlier stages, cutting fresh intake per stage without changing dwell time or spray pressure.
2
Conductivity-Triggered Dosing
Replace fixed-interval bath dumps with conductivity sensors that trigger dumps only when contamination actually crosses threshold, extending bath life significantly.
3
Ultrafiltrate Recovery on E-Coat
Recover and return ultrafiltrate permeate to the rinse stages ahead of the e-coat tank, a proven near-closed-loop technique in most modern paint shops.
4
Predictive Cooling Tower Blowdown
Model cycles of concentration against ambient conditions so blowdown is triggered by actual water chemistry rather than a conservative fixed schedule.
Your Utility Bill Already Tells You There Is a Problem — It Just Cannot Tell You Where
iFactory builds a live, process-level water model of your plant so engineering can see reuse opportunities, discharge risk, and cost per process area in one place. Book a demo to see your paint shop water map built from your own meter data.
DISCHARGE COMPLIANCE
Discharge Limits Do Not Forgive a Missed Sample — Here Is What Changes With Live Monitoring
Municipal discharge permits set hard limits on pH, temperature, TSS, and metals concentration, and violations carry fines that scale with severity and frequency. The comparison below shows how monitoring approach changes the risk profile.
PERIODIC MANUAL SAMPLING
Grab samples taken once per shift or per day, missing transient spikes between samples
Lab turnaround of 24 to 72 hours means violations are discovered after the fact
No automatic alert when a batch dump pushes a parameter out of range
Compliance reporting assembled manually from lab result spreadsheets
CONTINUOUS AI MONITORING
In-line sensors log pH, temperature, and conductivity continuously across every discharge point
Threshold breaches trigger an immediate alert before water leaves the site boundary
Batch dumps can be held or diverted automatically when a parameter trends out of range
Compliance reports generate automatically with a full time-stamped audit trail
IMPLEMENTATION PATH
How a Water Reuse Program Actually Gets Built, Phase by Phase
Plants that succeed with water reuse do not start with the treatment plant. They start with metering, because you cannot optimize a system you cannot measure.
PHASE 1
Submeter Every Major Process Area
Install flow meters at pretreatment, paint booths, cooling towers, and utility water separately from the main site meter.
PHASE 2
Baseline Consumption Against Production
Correlate water draw with vehicles produced per shift to establish a true gallons-per-unit baseline instead of a flat daily number.
PHASE 3
Identify and Rank Reuse Opportunities
Score each process area on reuse potential, retrofit cost, and payback period to build a prioritized project list.
PHASE 4
Deploy Highest-ROI Loop First
Most sites start with e-coat ultrafiltrate recovery or cascade rinse sequencing, since both typically show payback within a year.
PHASE 5
Layer in Discharge Monitoring
Add continuous compliance monitoring once reuse loops are stable, closing the loop between consumption and discharge.
READINESS CHECK
Water Systems Readiness Checklist Before Starting a Reuse Program
Use this list to confirm the plant has the visibility needed before committing capital to reuse infrastructure.
✓
Submeters installed on pretreatment, paint booth, and cooling tower circuits separately
✓
At least 90 days of baseline consumption data correlated against production volume
✓
Discharge permit limits documented for every parameter with current margin to limit
✓
Reuse candidate list ranked by payback period and retrofit complexity
✓
Alert thresholds and escalation contacts defined for discharge parameter breaches
FREQUENTLY ASKED QUESTIONS
Questions Plant Engineers Ask About AI-Driven Water Management
How long does it take to see a measurable reduction in freshwater consumption?
Most plants see a measurable shift within the first billing cycle after submeters go live, simply because visibility alone changes behavior around dump schedules and rinse flow settings. Structural reductions from cascade rinse redesign or ultrafiltrate recovery typically show up over 60 to 90 days as the new loops stabilize and operators adjust setpoints.
Book a demo to see a realistic timeline based on your current metering setup.
Do we need to replace our existing treatment plant to implement AI water monitoring?
No, iFactory's water intelligence layer sits on top of existing treatment infrastructure by connecting to flow meters, conductivity probes, and pH sensors that either already exist or can be retrofitted without touching the treatment process itself. The system reads and correlates data rather than replacing pumps, filters, or reverse osmosis units.
Contact support to review compatibility with your current treatment equipment.
What happens if a discharge parameter trends toward the limit outside of business hours?
Continuous monitoring does not stop at shift change, so a trending parameter triggers the same alert regardless of time of day, routed to whichever escalation contact is on call for that shift. For sites with automated valve control, the system can also hold or divert a batch discharge automatically rather than waiting for a human response.
Book a demo to see the alert and escalation workflow in action.
Can water reuse data be tied into our existing sustainability or ESG reporting?
Yes, water consumption and reuse volumes captured at the process level roll up automatically into site-level and enterprise-level sustainability reporting, giving your ESG team verified, auditable numbers instead of estimated ones. This is typically the same dataset used for discharge compliance reporting, so the two reporting streams stay consistent with each other.
Contact support to discuss integration with your existing ESG reporting tools.
Is submetering disruptive to install on an active paint line?
Most flow and conductivity retrofits are installed during scheduled downtime such as a weekend or planned maintenance window, since they clamp onto or insert into existing piping without requiring a full process shutdown. Plants typically complete submetering across pretreatment and paint booth zones within one to two planned outage windows.
Book a demo to plan an installation window around your production schedule.
Stop Managing Water by the Utility Bill — Start Managing It by the Process
iFactory gives plant engineering a live, process-level view of water consumption, reuse, and discharge compliance across the entire site. Book a demo to see your paint shop's water map built from your own data.