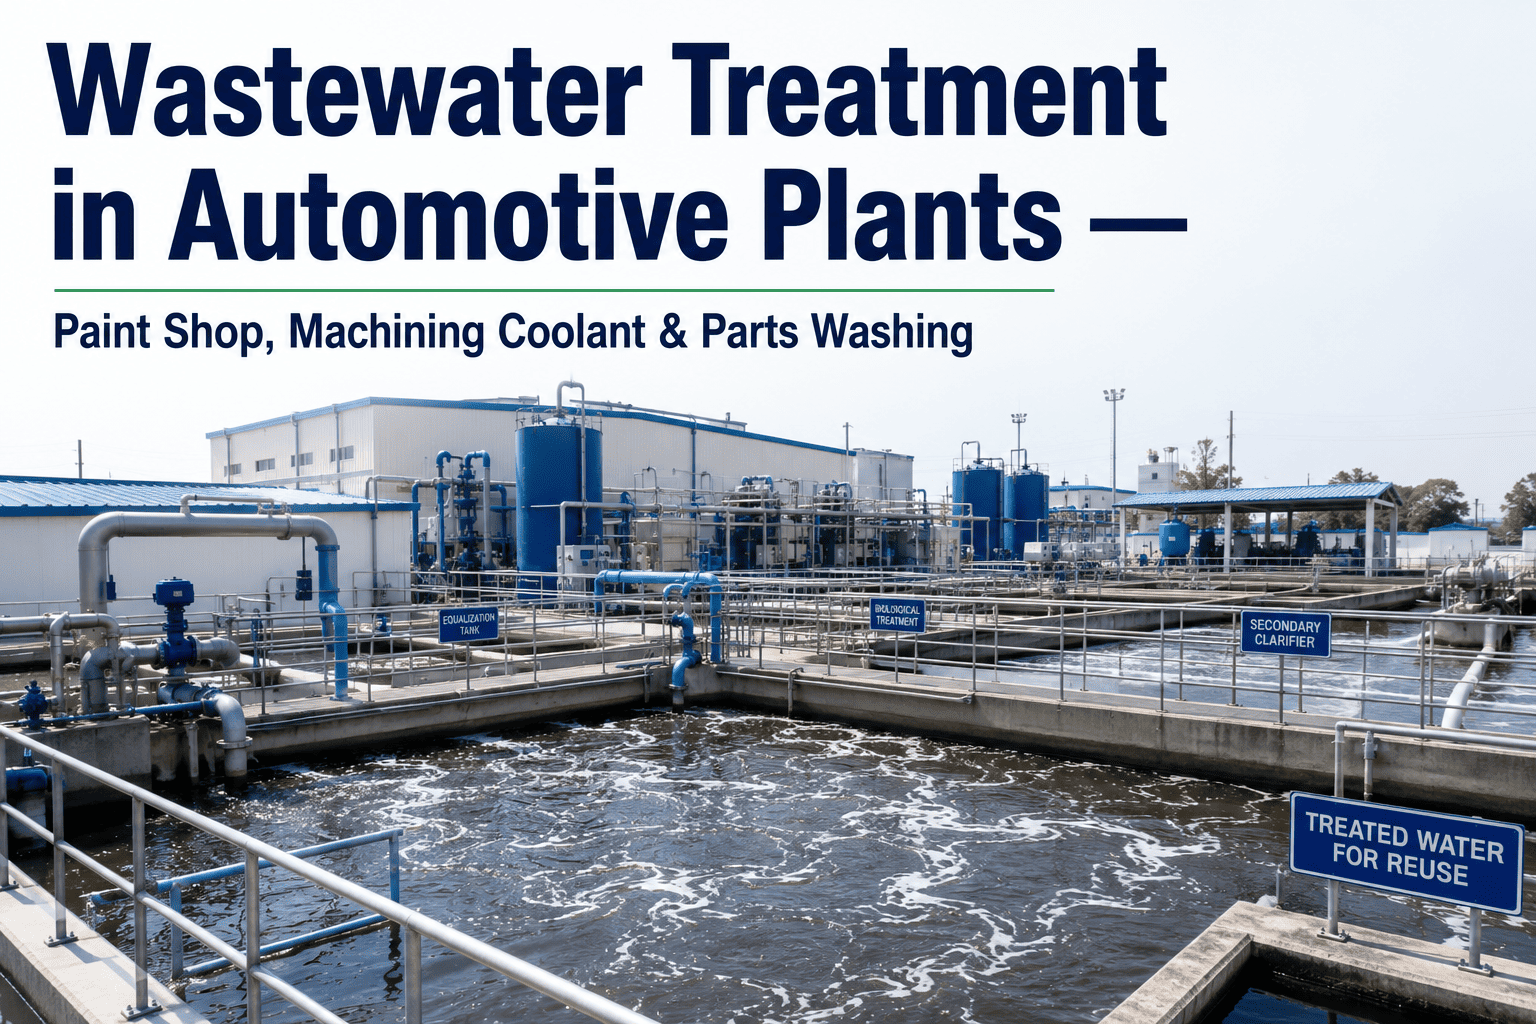
A paint shop effluent system running slightly out of pH range for a few hours rarely trips an alarm loud enough for anyone to notice before a batch sample fails, and by the time a lab result comes back, the plant may have already discharged water that puts its permit at risk. Automotive manufacturing generates wastewater from three very different sources under one roof — paint shop pretreatment and phosphating baths, machining coolant loaded with tramp oil and metal fines, and parts washing rinse water — and each stream needs its own chemistry managed continuously, not sampled periodically. iFactory monitors effluent quality, chemical dosing, and discharge parameters across all three streams in real time, catching a compliance drift hours before a grab sample would ever reveal it — see the platform at iFactory support.
AI-Driven Effluent Analytics · Automotive Manufacturing
Wastewater Treatment Monitoring: Catch a Compliance Drift in Paint Shop or Machining Effluent Hours Before a Grab Sample Would
iFactory continuously monitors pH, conductivity, oil and grease, and heavy metal indicators across paint shop pretreatment, machining coolant, and parts washing wastewater streams, adjusting chemical dosing automatically to keep discharge inside permit limits.
Paint Shop pHIn Range
7.2
Permit range 6.5 – 8.5
Machining Oil & GreaseTrending Up
38 mg/L
Permit limit 50 mg/L
Parts Wash ConductivityStable
1,180 µS
Within seasonal baseline
Three Streams, Three Chemistries
Why Automotive Plant Wastewater Can't Be Managed as a Single Effluent Stream
A modern automotive plant produces distinctly different wastewater from three separate processes, and treating them as one blended discharge stream makes it far harder to isolate where a compliance issue is actually originating.
Paint Shop Pretreatment
Phosphating and e-coat rinse water carries heavy metal and phosphate loads that require tight pH control before discharge or reuse, with drift often traced to bath concentration changes upstream.
Machining Coolant
Tramp oil contamination and metal fines accumulate in coolant systems over time, degrading treatment performance gradually until oil and grease readings spike close to the permit limit.
Parts Washing Rinse
Detergent and surfactant carryover changes conductivity and total dissolved solids in ways that fluctuate with production volume and washer cycle frequency across a shift.
Continuous Monitoring Flow
From Sensor Reading to Automated Dosing Correction
1
Inline Sensing
pH, conductivity, oxidation-reduction potential, and turbidity sensors continuously monitor each stream at key points in the treatment train.
2
Baseline Comparison
Readings are compared against each stream's own operating baseline, accounting for normal variation tied to production volume and shift schedule.
3
Dosing Adjustment
Chemical dosing pumps for pH correction and flocculation are adjusted automatically within configured limits to hold parameters inside permit range.
4
Compliance Alert
If a parameter trends toward its permit limit faster than dosing correction can compensate, the EHS team is alerted with hours of lead time before discharge.
A Failed Discharge Sample Is a Compliance Event You Only Find Out About After It's Already Happened.
iFactory watches every effluent stream continuously, so the drift is caught and corrected long before a grab sample ever gets pulled for the lab.
Grab Sampling vs. Continuous Monitoring
Wastewater Compliance — Periodic Testing vs. iFactory Real-Time Analytics
Function
Periodic Grab Sampling
iFactory Continuous Monitoring
pH Compliance
Checked at scheduled intervals, missing excursions that occur between samples
Monitored continuously with dosing adjusted automatically to hold within range
Oil & Grease Trend
Trend only visible by comparing separate lab results collected days apart
Trended continuously, flagging gradual accumulation before it nears the limit
Discharge Documentation
Built from periodic lab reports and manual logbook entries
Generated automatically from continuous sensor data, ready for permit reporting
Root Cause Identification
Difficult to trace an excursion back to its source process after the fact
Correlated to the specific stream and time window the deviation originated from
Chemical Dosing Cost
Often over-dosed to maintain a safety margin against infrequent testing
Dosed precisely to actual real-time demand, reducing unnecessary chemical usage
Measured Outcomes
What EHS Teams Report After Deploying Continuous Effluent Monitoring
0
Permit Excursions Since Deployment
Plants running continuous dosing correction on paint shop and machining streams report meaningfully fewer permit exceedances than under periodic sampling alone.
15–20%
Chemical Dosing Cost Reduction
Precision dosing tied to real-time readings, instead of a conservative fixed margin, reduces treatment chemical consumption in this range.
Hours, Not Days
Deviation Detection Speed
A parameter trending toward its permit limit is typically flagged within hours rather than waiting for the next scheduled lab sample.
50%
Faster Permit Reporting Preparation
EHS teams report significant time savings when discharge monitoring reports build automatically from continuous sensor data.
3
Wastewater Streams Monitored Individually
Paint shop pretreatment, machining coolant, and parts washing rinse are each tracked against their own chemistry baseline rather than one blended reading.
10–14 days
Typical Deployment Timeline
Time from integration kickoff to live continuous monitoring for a plant with existing inline sensors in the treatment train.
Field Case
Catching a Coolant Oil Accumulation Trend Three Days Before a Permit Threshold Would Have Been Crossed
A machining plant discharging treated coolant wastewater under a fixed oil and grease permit limit had been relying on twice-weekly grab samples to confirm compliance. After moving to continuous monitoring, the system flagged a gradual upward trend in oil and grease readings that would have crossed the permit threshold within roughly three days if left unaddressed, traced to a coolant recycling unit's separator running below its normal skimming efficiency. The maintenance team serviced the separator before the trend reached a level that would have required a compliance notification, and the same trend pattern is now used as an early warning indicator for that specific piece of equipment going forward.
3 daysLead time before threshold would be crossed
1Separator identified as root cause
0Compliance notifications required
Frequently Asked Questions
Automotive Wastewater Treatment — What EHS Managers Ask First
Which wastewater streams and parameters does iFactory monitor?
iFactory monitors paint shop pretreatment and e-coat rinse water, machining coolant systems, and parts washing rinse streams, tracking pH, conductivity, oxidation-reduction potential, turbidity, and oil and grease trends depending on which sensors are present at each treatment point. Heavy metal indicators relevant to paint shop phosphating processes can also be incorporated where inline sensing is available, with periodic lab confirmation used to validate sensor readings over time. Each stream is configured against its own baseline rather than a single blended discharge standard.
Book a Demo to review which parameters matter most for your discharge permit.
Does this replace our required lab testing for permit compliance?
No — most discharge permits require certified lab analysis on a defined sampling schedule, and continuous monitoring does not replace that regulatory requirement. What it does is give an EHS team visibility into trends between those required lab samples, catching drift and enabling corrective action well before the next scheduled sample is due. In practice, this significantly reduces the chance that a required lab sample comes back out of range, since the underlying process is being actively corrected rather than only checked periodically.
Can the system automatically adjust chemical dosing, or does it just alert a person?
Both modes are supported depending on how a plant wants to operate. Where a treatment system has dosing pumps with remote control capability, iFactory can adjust dosing automatically within configured safety limits to hold parameters inside permit range, reducing the frequency of manual intervention. Where a plant prefers to keep a person in the loop for any dosing change, the system instead generates a specific recommended adjustment and alerts the operator, who applies the change manually.
Contact support to discuss which mode fits your treatment system and internal procedures.
How does the system tell a real compliance risk apart from normal production-driven variation?
Wastewater chemistry naturally shifts with production volume, shift schedule, and which process is actively discharging at a given time, so baselines are built against those operating variables rather than a flat historical average. A reading that is explained by a known production pattern, such as a higher parts wash volume during a peak shift, is not flagged, while the same magnitude of change occurring outside that expected pattern is treated as a genuine deviation worth investigating.
How long does deployment take across multiple wastewater streams?
For a plant with inline sensors already installed in the treatment train, a live dashboard covering paint shop, machining, and parts washing streams typically takes 10 to 14 days from integration kickoff. Plants requiring new inline sensor installation across multiple treatment points generally take four to six weeks depending on how many streams and treatment stages are involved.
Book a Demo to get a configuration timeline for your treatment system.
Don't Wait for the Next Grab Sample to Find Out Your Discharge Is Drifting Out of Range.
Continuous wastewater monitoring and automated dosing correction across paint shop, machining, and parts washing streams — live in as little as 10 days.