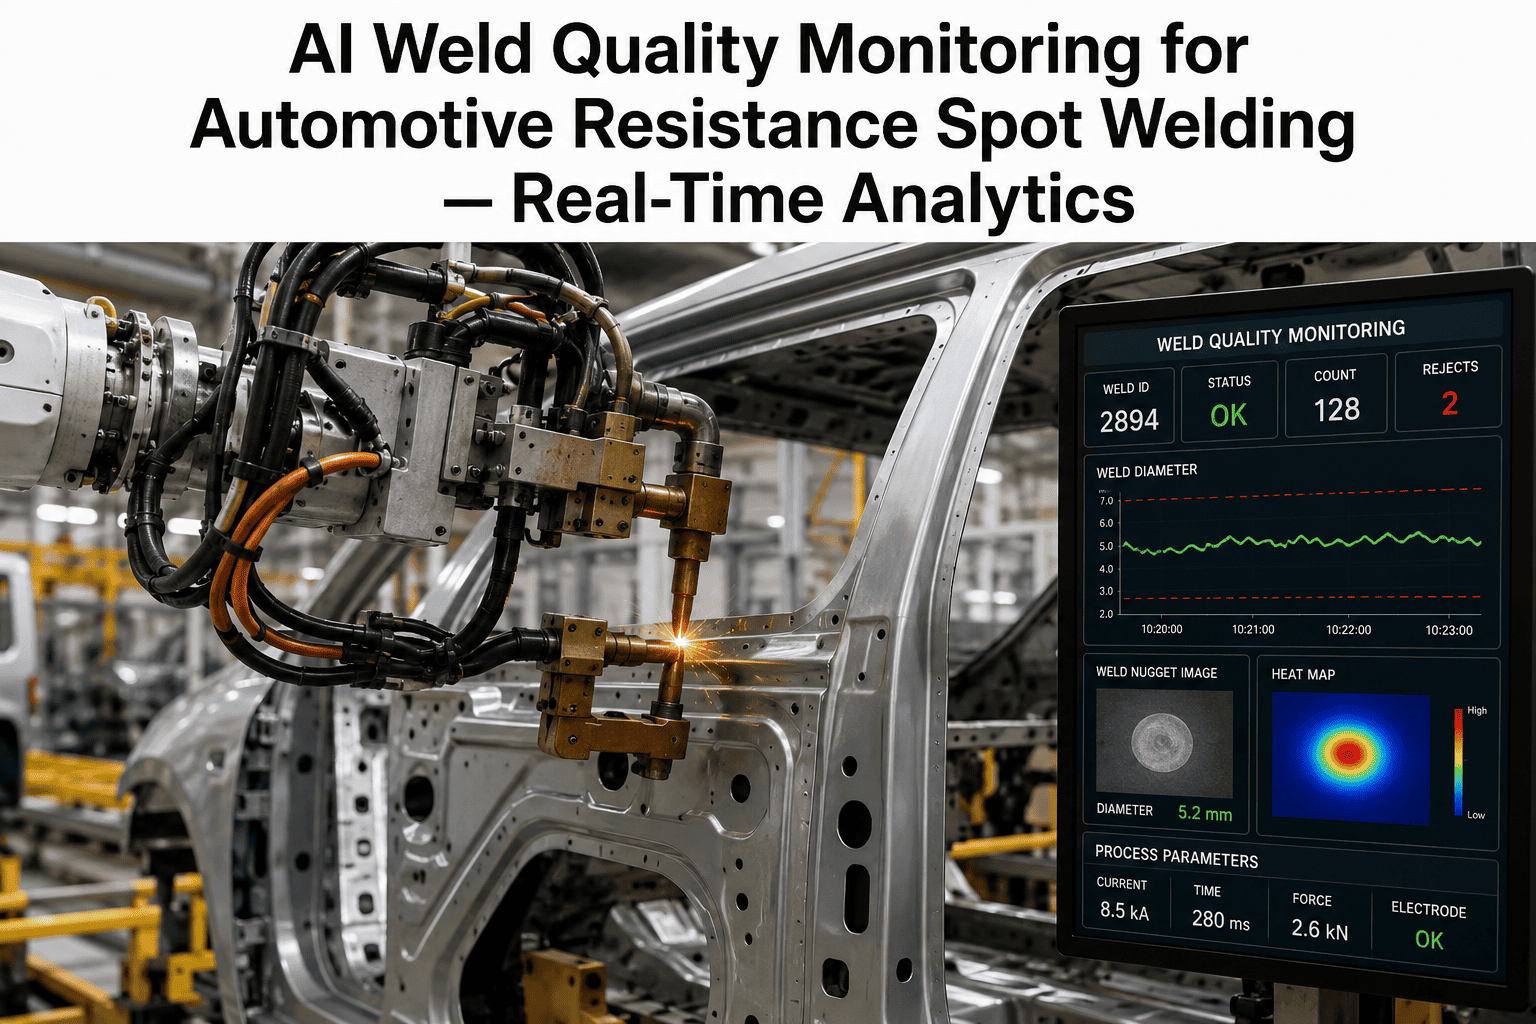
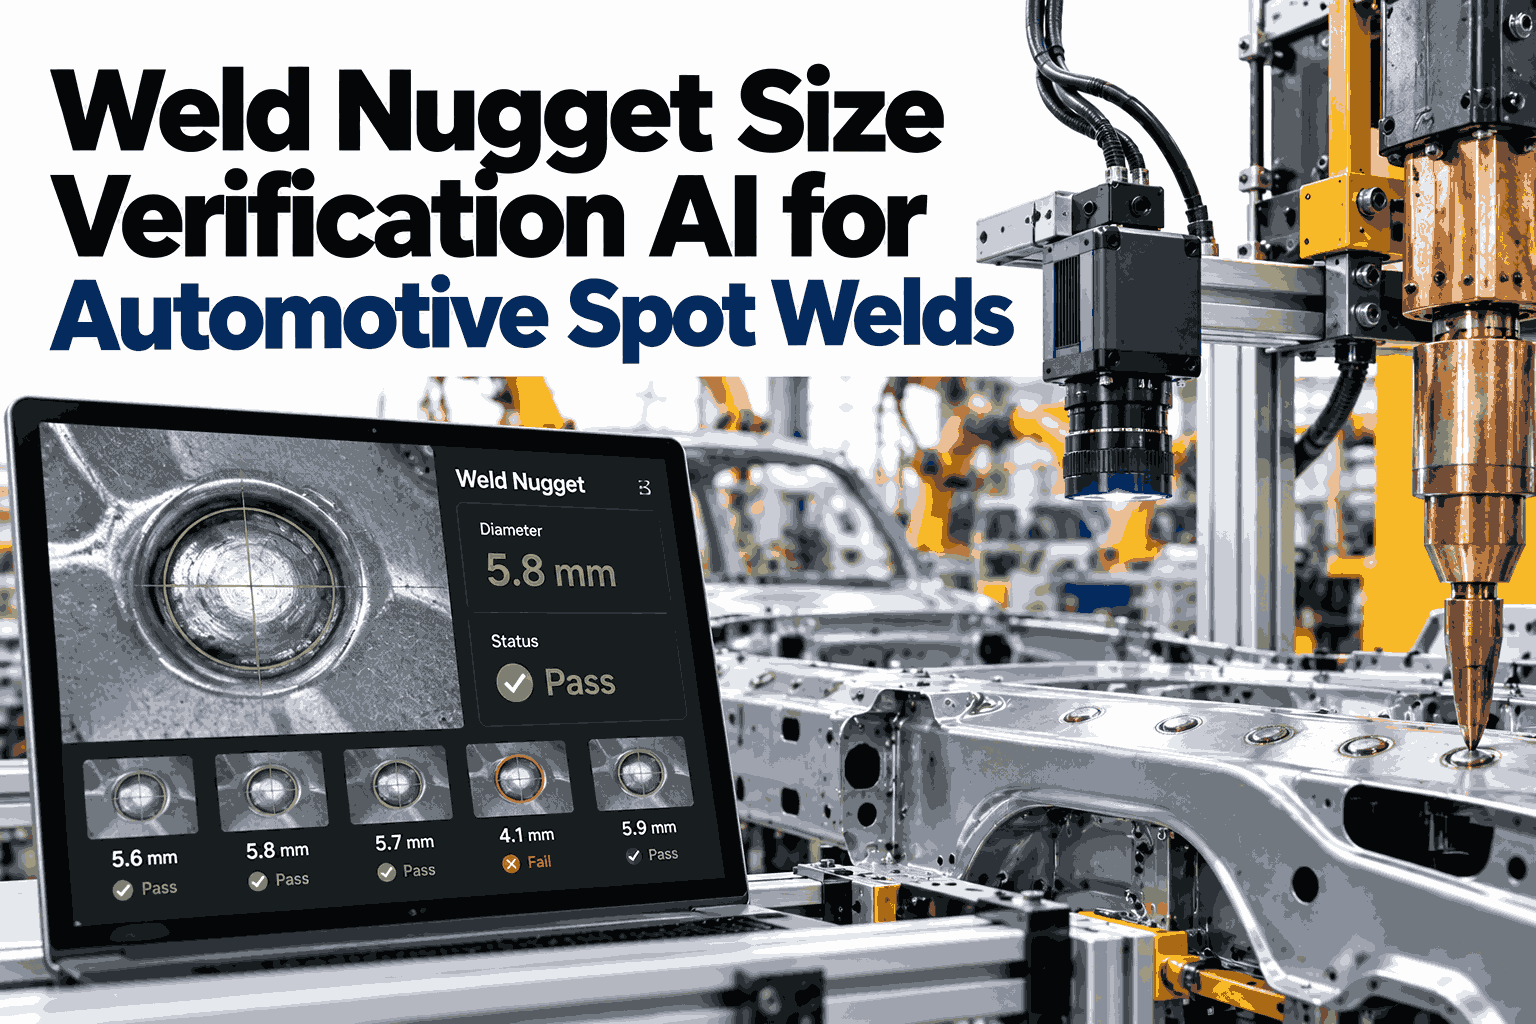
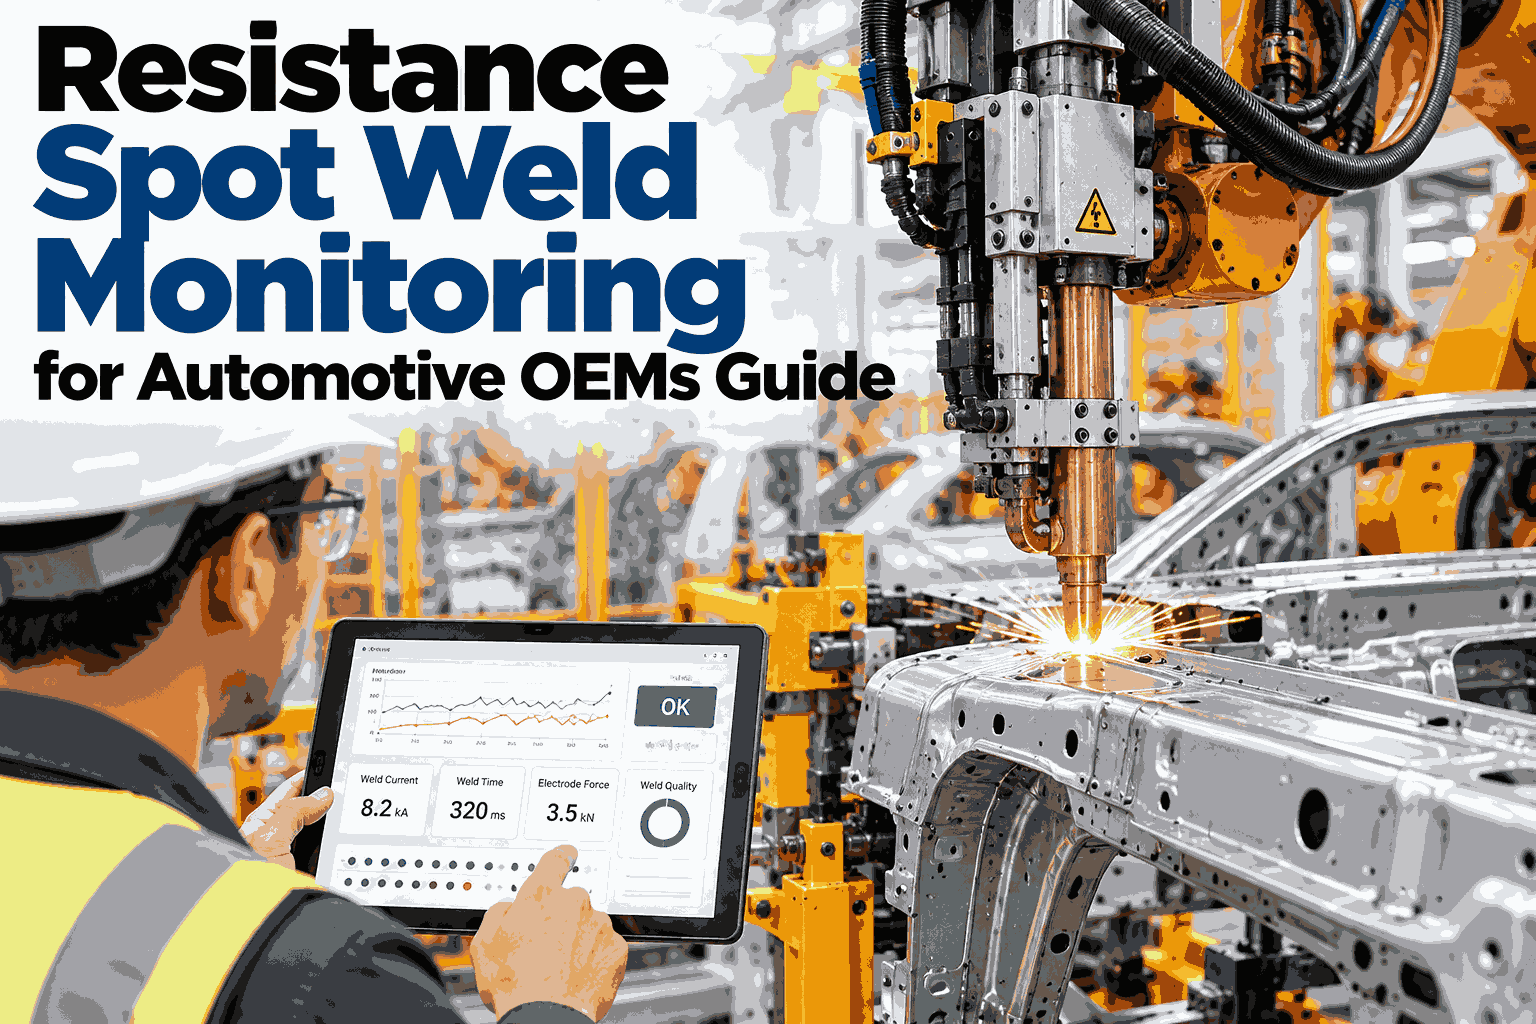
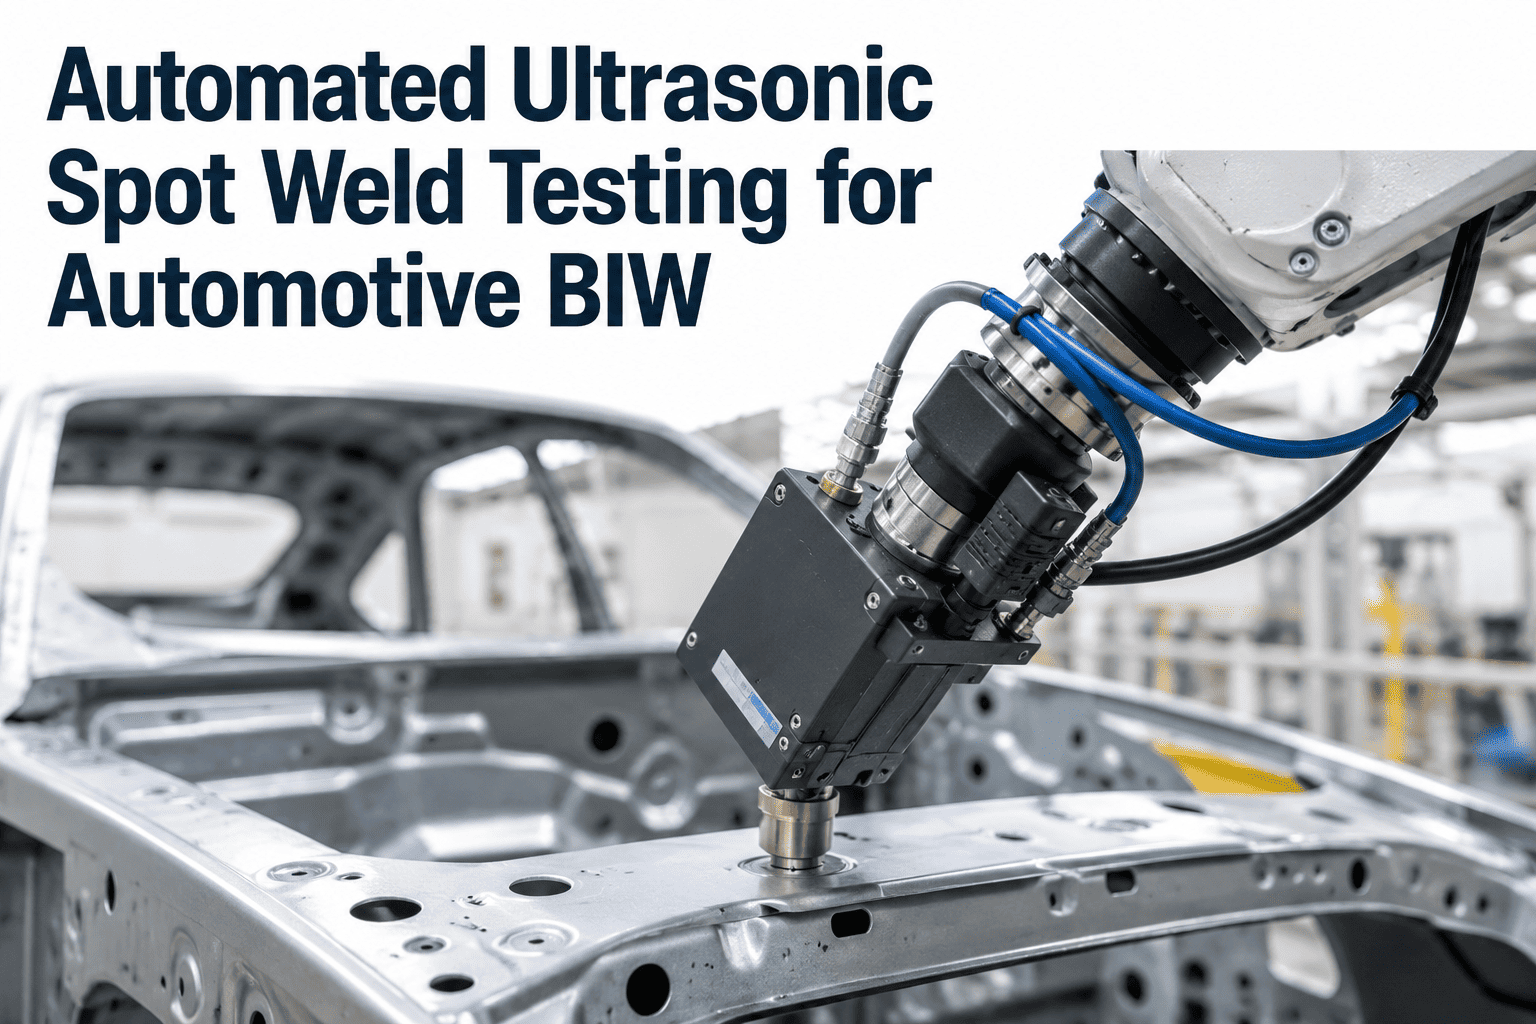
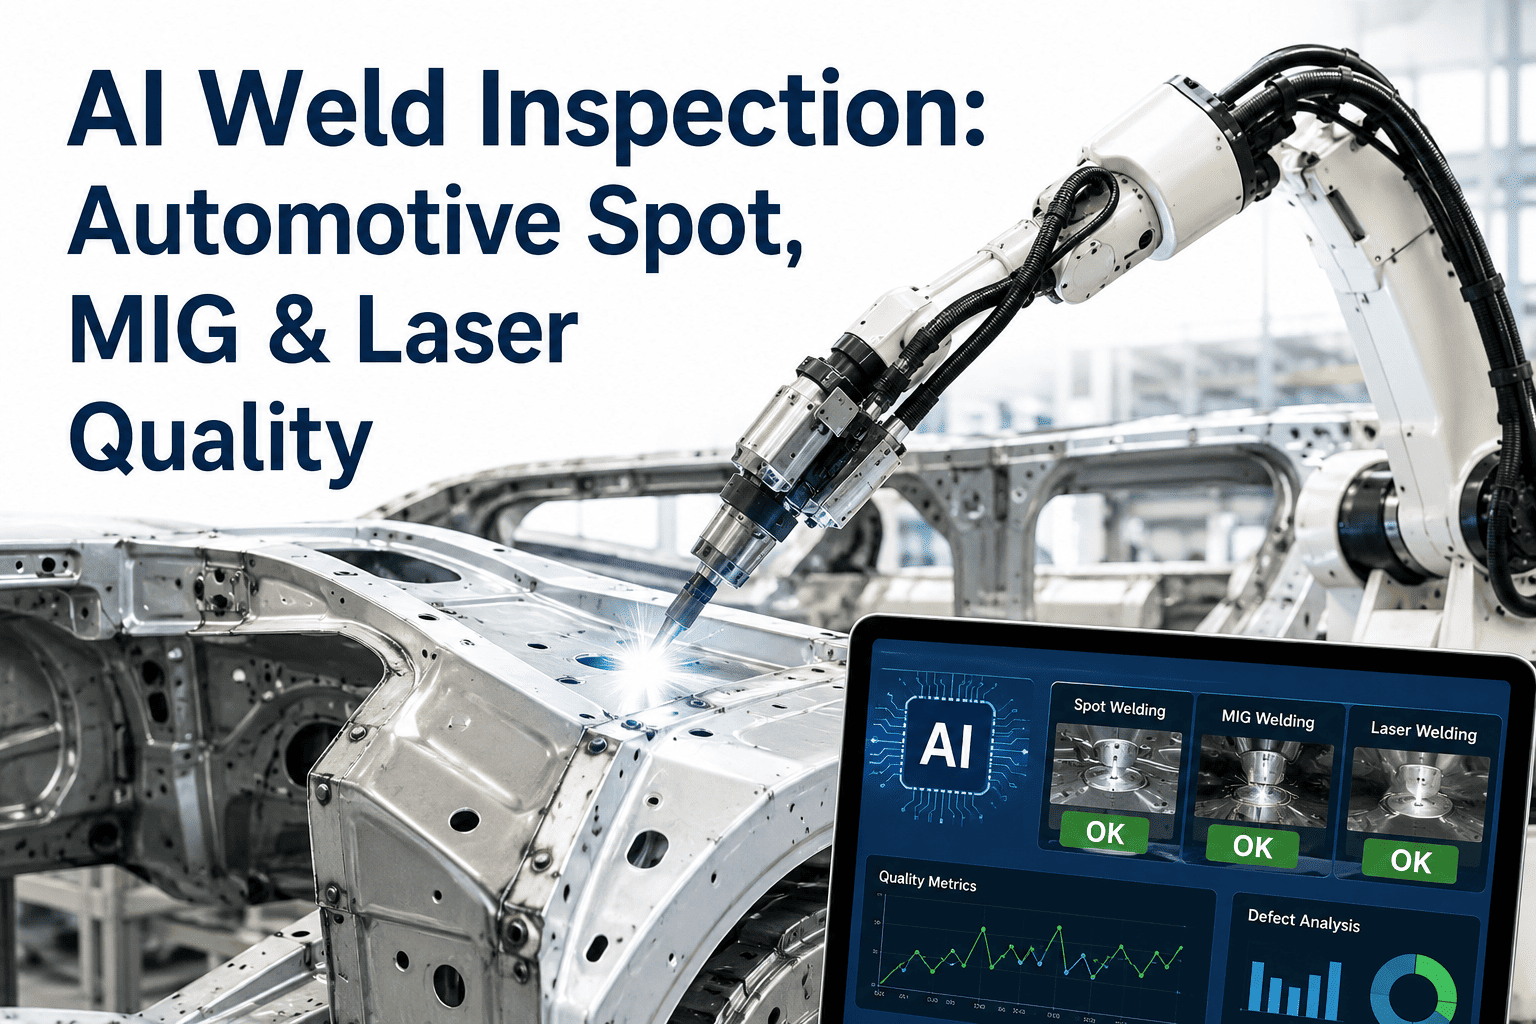
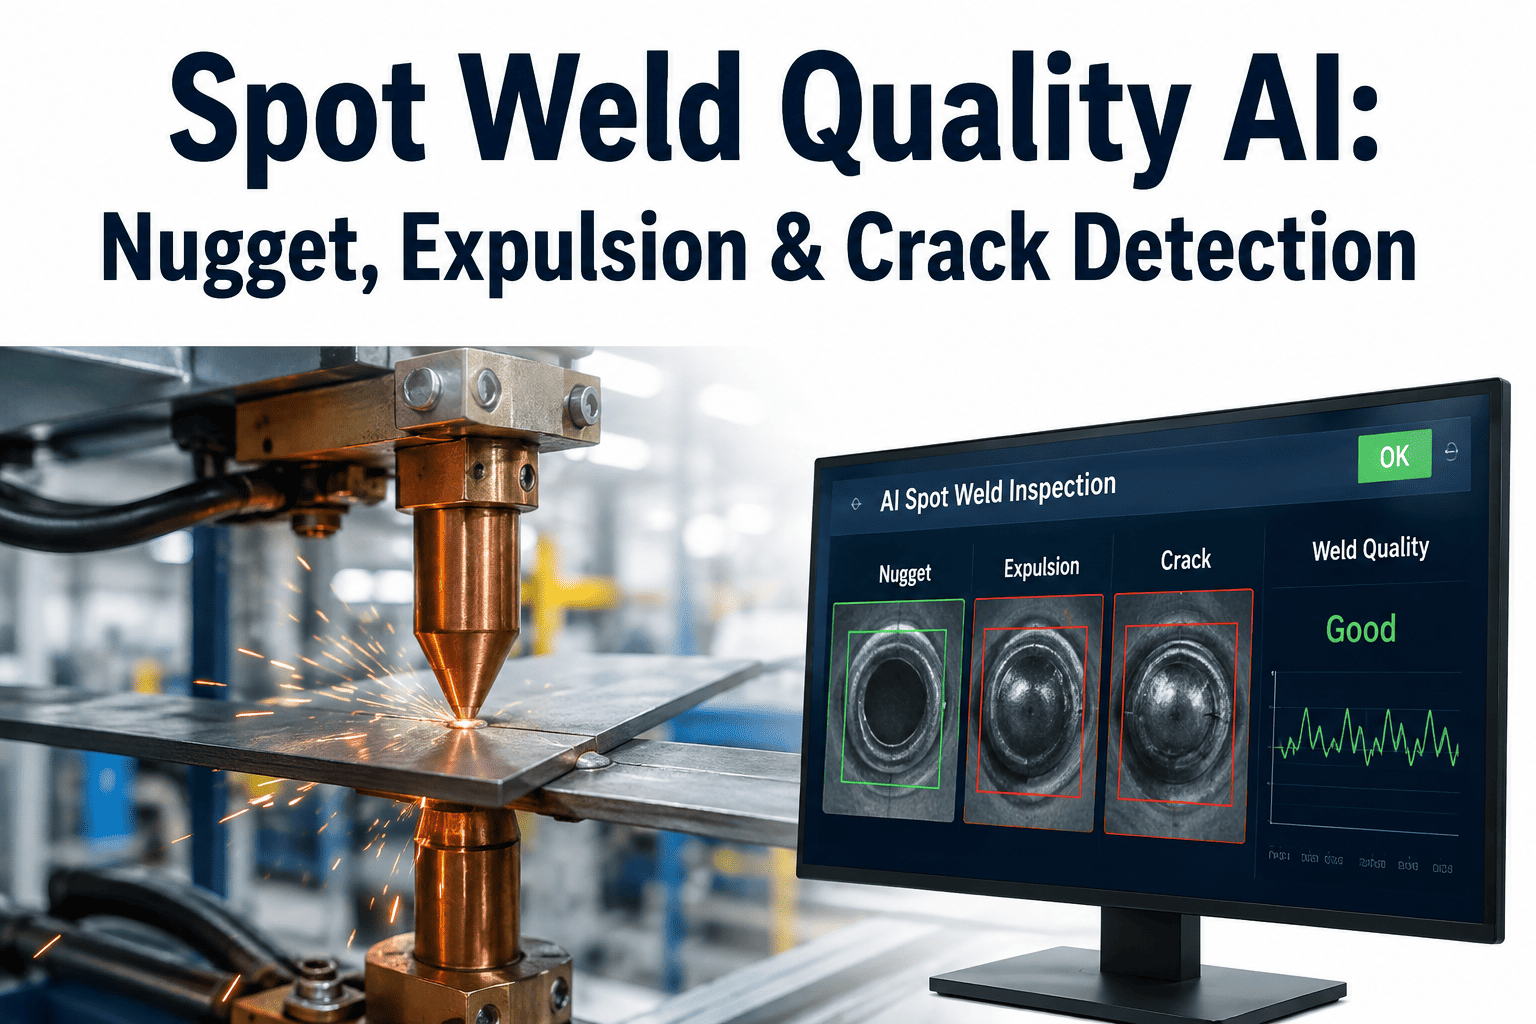
A modern car body carries between three and five thousand resistance spot welds, and for decades the only way to confirm a weld actually formed a proper nugget was to cut one open. Destructive testing samples a handful of welds per shift, chisels or peels them apart, measures the nugget, and throws the part away — which means the other 4,995 welds on that body are trusted based on a sample that was, by definition, not actually inspected. That gap between "we tested a few welds" and "we know every weld is good" is exactly what AI-based weld quality monitoring closes, using the current, voltage, and resistance signal that every weld gun already generates. Book a demo to see how that signal becomes a real-time nugget diameter prediction on your own line.
WELD QUALITY MONITORING · RESISTANCE SPOT WELDING · 2026 GUIDE
AI Weld Quality Monitoring for Automotive Resistance Spot Welding
Every spot weld already produces a dynamic resistance curve. This guide covers how AI models turn that signal into a real-time nugget diameter prediction, why destructive testing alone can't scale to modern weld counts, and how to move from random checks toward continuous weld verification.
3,000–5,000
Resistance spot welds in a typical vehicle body
<20
Welds typically checked destructively per shift
94%+
Reported nugget defect classification accuracy in published studies
100%
Weld coverage achievable with inline signal-based monitoring
THE DESTRUCTIVE TESTING PROBLEM
Why Destructive Testing Cannot Scale to Modern Weld Volumes
Destructive weld testing is genuinely accurate — cutting a weld open and measuring the nugget directly tells you exactly what happened, with no inference involved. The problem is scale. At three to five thousand welds per body and thousands of bodies per week, testing enough welds destructively to represent the whole population would mean scrapping a meaningful share of production just to check it, which no plant can afford. So quality teams sample instead, typically checking fewer than twenty welds per shift, and treat the rest of the population as inspected by extension. That extension is a statistical leap, not a measurement.
The gap shows up when a weld gun starts drifting — an electrode wearing down, a tip dressing schedule slipping, a shunt current problem from a nearby ground — and produces a run of undersized or cold welds that the sample never happens to catch. Those welds pass through final assembly, through paint, through the whole build process, and the first anyone hears about them is a field failure, a body shop teardown, or in the worst case a structural issue discovered after the vehicle has shipped.
HOW SIGNAL-BASED MONITORING WORKS
Turning the Dynamic Resistance Curve Into a Quality Verdict
WHAT THE GUN ALREADY MEASURES
The Dynamic Resistance Curve
Every resistance spot weld gun already records current, voltage, and the resulting dynamic resistance curve as the weld forms — this data exists today, whether or not anyone is using it. The curve's shape reflects the physical process happening between the electrodes: initial contact resistance, heating, expulsion if it occurs, and cooling.
WHAT THE MODEL DOES WITH IT
Feature Extraction and Prediction
Machine learning models — commonly convolutional networks, autoencoders paired with regression, or gradient-boosted models — extract features from the resistance curve and correlate them to nugget diameter and pull strength, the two properties destructive testing traditionally measured directly.
WHAT THE LINE GETS BACK
A Verdict on Every Weld
The output is a pass, marginal, or fail classification delivered within the weld cycle itself, so a cold weld or expulsion event triggers an immediate rework flag rather than surfacing hours or days later in an audit.
Published research on this approach has used a range of model architectures — from backpropagation neural networks combined with Bayesian optimization, to one-dimensional convolutional networks with attention mechanisms, to Gaussian process regression trained on autoencoder-extracted features — and consistently reports the same conclusion: the dynamic resistance curve carries enough information to predict weld quality without cutting the part open, at accuracy levels increasingly close to destructive testing itself.
Move From Sampled Welds to Continuous Weld Verification
iFactory AI ingests welding current, voltage, and resistance signal directly from your weld controllers and delivers a real-time quality verdict on every spot weld — no destructive testing required to know a weld held.
DEFECT TAXONOMY
What AI Weld Monitoring Actually Catches
Cold welds and undersized nuggets. Insufficient heat input produces a nugget below the minimum diameter for structural strength, typically caused by low current, worn electrodes, or excessive shunting through nearby welds.
Expulsion events. Molten metal ejected during welding weakens the joint and often indicates excessive current or poor electrode fit-up; the resistance curve shows a characteristic spike that signal-based models detect immediately.
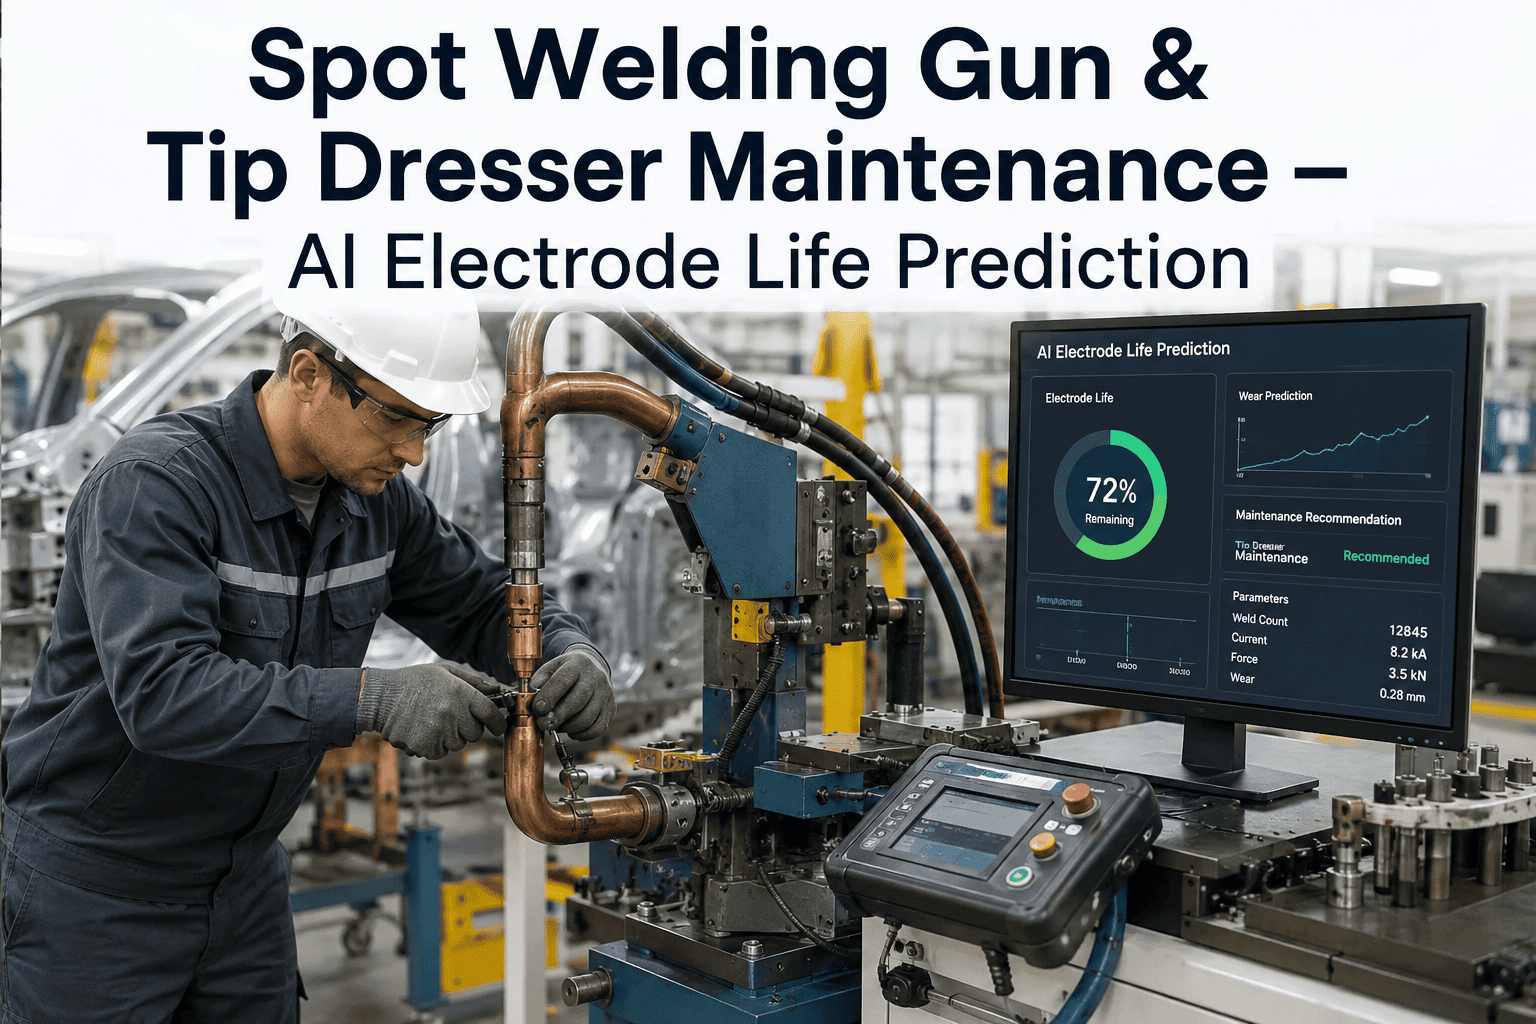
Electrode wear drift. As electrode tips wear, contact area increases and current density drops, gradually shrinking nugget size across a run of welds — a trend that shows up in the signal well before it becomes an out-of-spec weld.
Stack-up and fit-up gaps. A gap between sheets before welding changes the initial contact resistance profile, which the model reads directly from the early portion of the dynamic resistance curve.
Shunt current effects. Current diverting through adjacent already-welded joints reduces effective weld current at the current joint, a pattern that is difficult to catch with post-weld visual inspection but visible in the electrical signal.
EXPERT REVIEW
Industry Perspective on Weld Quality Verification Strategy
Marcus Ferreira
Principal Welding Engineer · 26 years in body shop process engineering · Former Manufacturing Engineering Lead, Stellantis
Every body shop I've worked in had the same argument every quarter: are we destructive-testing enough welds. The honest answer was always no, because there is no number of welds you can afford to cut apart that actually represents five thousand welds on a body. What changed the conversation for us wasn't a better sampling plan, it was realizing the resistance curve was sitting right there in the weld controller the whole time, unused. Once we started scoring every weld against that signal, the sampling argument became irrelevant — we weren't inferring quality from a handful of welds anymore, we were looking at all of them. The destructive tests didn't go away, they became the calibration check for the model instead of the primary quality gate.
FREQUENTLY ASKED QUESTIONS
Common Questions About AI Weld Quality Monitoring
Does AI weld monitoring eliminate the need for destructive testing?
No, and it isn't meant to. Destructive testing remains valuable as a calibration and validation check — it confirms the AI model's nugget diameter predictions continue to match physical reality over time, and it is still typically required for certain audit and PPAP purposes on automotive programs. What changes is the role destructive testing plays: instead of being the primary quality gate for a small sample of welds, it becomes the periodic ground-truth check that keeps the continuous, 100%-coverage signal-based monitoring system accurate. Most plants that adopt this approach reduce destructive testing volume significantly while increasing their actual weld coverage from a small sample to effectively all welds.
What data does a weld quality AI model actually need?
The core input is the dynamic resistance curve — current and voltage measured throughout the weld cycle, from which resistance is derived — which virtually every modern resistance spot welding controller already records or can be configured to output. Some approaches supplement this with thermal imaging of the weld pool, structured light measurement of weld profile and indentation depth, or acoustic emission sensors, but the electrical signal alone has proven sufficient for strong nugget diameter and quality classification in published research and production deployments, which keeps the sensor and integration footprint relatively simple.
How accurate is AI-based weld quality prediction compared to destructive testing?
Reported accuracy varies by study and model architecture, but published research on convolutional and Bayesian-optimized models generally reports nugget diameter prediction with relative error in the low single digits to roughly 14 percent depending on material stack-up, and defect classification accuracy commonly cited above 94 percent. This is not identical to a physical measurement, which is why destructive testing continues in a reduced, calibration-focused role, but the accuracy is high enough that undersized, cold, or expulsion-affected welds are reliably flagged for rework before the body moves further down the line.
Can this integrate with our existing weld controllers without new hardware?
In most cases the current and voltage signal is already available from the weld controller through its existing monitoring output or a standard interface, meaning integration is primarily a data connectivity project rather than a new sensor installation. Some deployments add supplementary sensing such as thermal or structured-light imaging for additional confidence on specific joint types, but the baseline signal-based approach is designed to work with the electrical data resistance spot welding equipment already generates. iFactory's
support team can review your specific weld controller model to confirm the integration path.
What causes most spot weld quality issues in production?
The most common issues are electrode wear, which gradually reduces current density and nugget size over a run of welds; shunt current through adjacent already-welded joints, which reduces effective current at the current weld; stack-up or fit-up gaps between sheets before welding; and expulsion from excessive current or poor electrode fit-up. Each of these leaves a distinct signature in the dynamic resistance curve, which is part of why signal-based monitoring is effective — the electrical data doesn't just say pass or fail, it often points toward which of these root causes is responsible.
Score Every Weld, Not Just the Sample
See how iFactory AI turns your existing weld controller signal into real-time nugget diameter prediction and defect classification across your entire body shop.