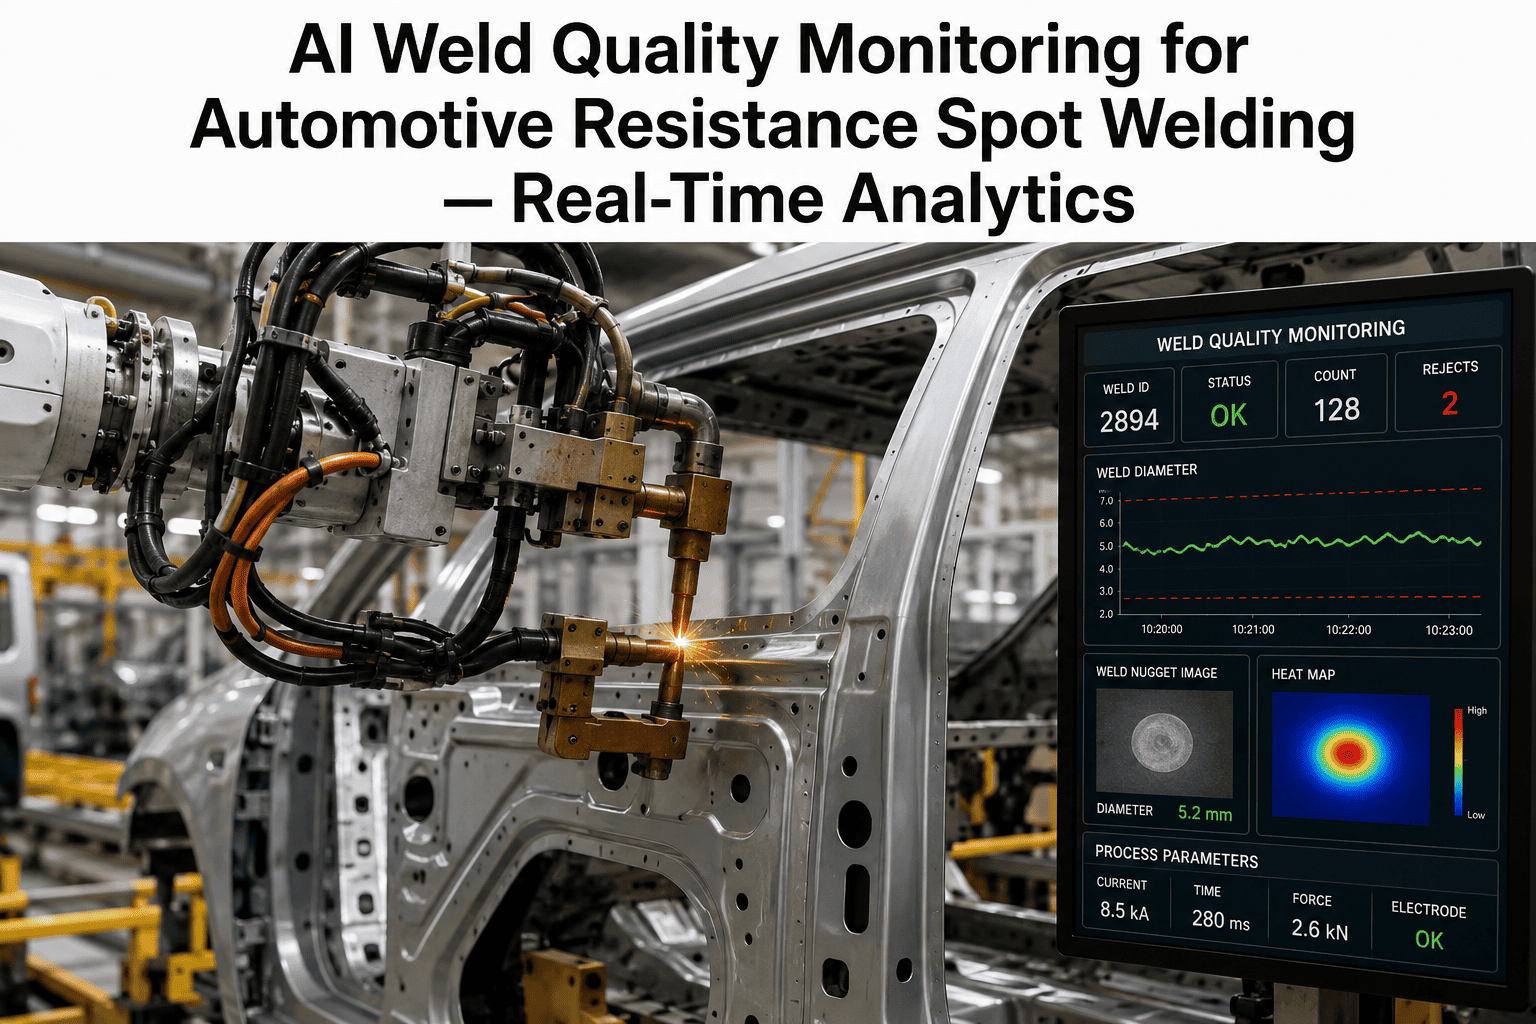
A modern car body carries thousands of resistance spot welds, and every one of them is a joint you cannot see once the panel is closed. Most plants still verify them by sampling: pull a few bodies, chisel or peel-test the welds, and assume the rest look the same. The trouble is that electrode wear, coating variation and shunting drift weld by weld, not sample by sample. Monitoring the electrical signature of each weld as it happens is how OEMs close that blind spot. Body-in-white teams can see weld monitoring run on their own line data before their next launch.
Know Every Spot Weld Is Good Before the Body Leaves the Cell
iFactory Automotive Weld AI reads dynamic resistance, flags expulsion and estimates nugget size on every weld, then scores your confidence in it.
Why Sampling Misses the Welds That Matter
Destructive testing is accurate for the weld you cut open. It says very little about the welds around it, or the ones made an hour later with a more worn tip.
Monitoring does not replace periodic destructive audits. It tells you which welds and which stations deserve them.
What Pushes a Weld Off Target
Weld quality rarely fails all at once. A handful of inputs move slowly and stack up, which is why the bars below matter more as a group than one at a time.
Illustrative relative sensitivity. Actual ranking differs by plant, gun and material stack.
Reading the Dynamic Resistance Curve
During a weld, the resistance across the electrodes changes in a recognisable pattern. That pattern is a fingerprint of what is happening inside the joint.
Contact breakdown
Surface films and asperities collapse under force and current.
Softening dip
Heating lowers bulk resistivity contact improves, so resistance falls.
Nugget growth
Molten metal forms and resistance climbs toward a peak.
Collapse or plateau
A sharp drop points to expulsion. A smooth plateau suggests stable growth.
Catching Expulsion in the Act
Expulsion is molten metal thrown from the joint. It thins the nugget and leaves spatter, and the curve records it the instant it happens.
Sudden resistance drop
A steep fall late in the weld separates expulsion from normal growth.
Too much heat, too soon
Worn tips, low force or high current push the joint past its limit.
Flag and adapt
The weld is marked, and the trend tells the team which gun to service.
From Signal to Nugget Size Estimate
Nugget diameter is what engineers actually specify. Monitoring estimates it from the signals the controller already produces.
Estimates are calibrated against teardown results from your own line, so the model reflects your steel grades, coatings and guns.
See Your Own Weld Curves Scored
Book a 30-minute session and walk through how iFactory would monitor a station on your body shop line.
The Weld Confidence Score
Operators do not want raw curves on every screen. They want a clear answer, and the score condenses the evidence into one number per weld.
| Score Input | What It Tells You | Typical Action |
|---|---|---|
| Curve shape | Whether growth followed the expected pattern | Compare against reference for the stack |
| Expulsion flag | Whether metal was lost from the joint | Inspect gun, force and tip condition |
| Nugget estimate | Predicted diameter against specification | Rework or add a weld if undersize |
| Station trend | Direction of drift across recent welds | Schedule dressing or tip change |
Coverage Across the Body Shop
Weld risk differs by area, so monitoring priorities differ too. Start where a missed weld costs the most.
Underbody
High volume and structural loads. Stability and shunting are the main concerns.
Framing
Geometry drives fit-up. Gaps show up quickly in the curve.
Closures
Doors and hoods mix thin gauges and coatings, where expulsion is common.
High-strength areas
Advanced steels need tight control of heat input and tip condition.
A Practical Rollout Path
Most OEMs start narrow, prove the method, and then widen coverage once the alerts earn trust.
Frequently Asked Questions
Does weld monitoring replace destructive testing?
No. Destructive audits remain the ground truth and are still needed for calibration. Monitoring tells you where to aim them and covers every weld in between. Walk through a paired monitoring and audit plan with us for your line.
What data do we need from our weld controllers?
Typically weld current, voltage or resistance, force and weld time per spot. Most modern controllers already record these values. The gap is usually collecting them consistently across stations. Check which signals we can pull from your controllers in a short walkthrough.
How accurate is nugget size estimation?
Accuracy depends on how well the model is calibrated to your materials and guns. Teardown data from your own line is used to tune it. Estimates should be treated as screening, with periodic teardown checks confirming them. Compare estimates against your own teardown results in a live session.
Can it handle coated and high-strength steels?
Yes, though each stack needs its own reference curves because coatings and grades change the resistance pattern. Calibrating per stack keeps false alarms low. Review your material mix in a live working session with our team.
Where should we start on a large body shop?
Pick one cell with known quality pain, such as frequent expulsion or rework. Prove the alerts there first. Once quality and operators trust the score, expansion to other stations is far smoother. Pick your pilot cell together with our engineers in a half-hour call.
Turn Every Spot Weld Into a Verified Weld
Bring your controller data and one problem station. We will show how dynamic resistance, expulsion flags and confidence scores work on your own welds.