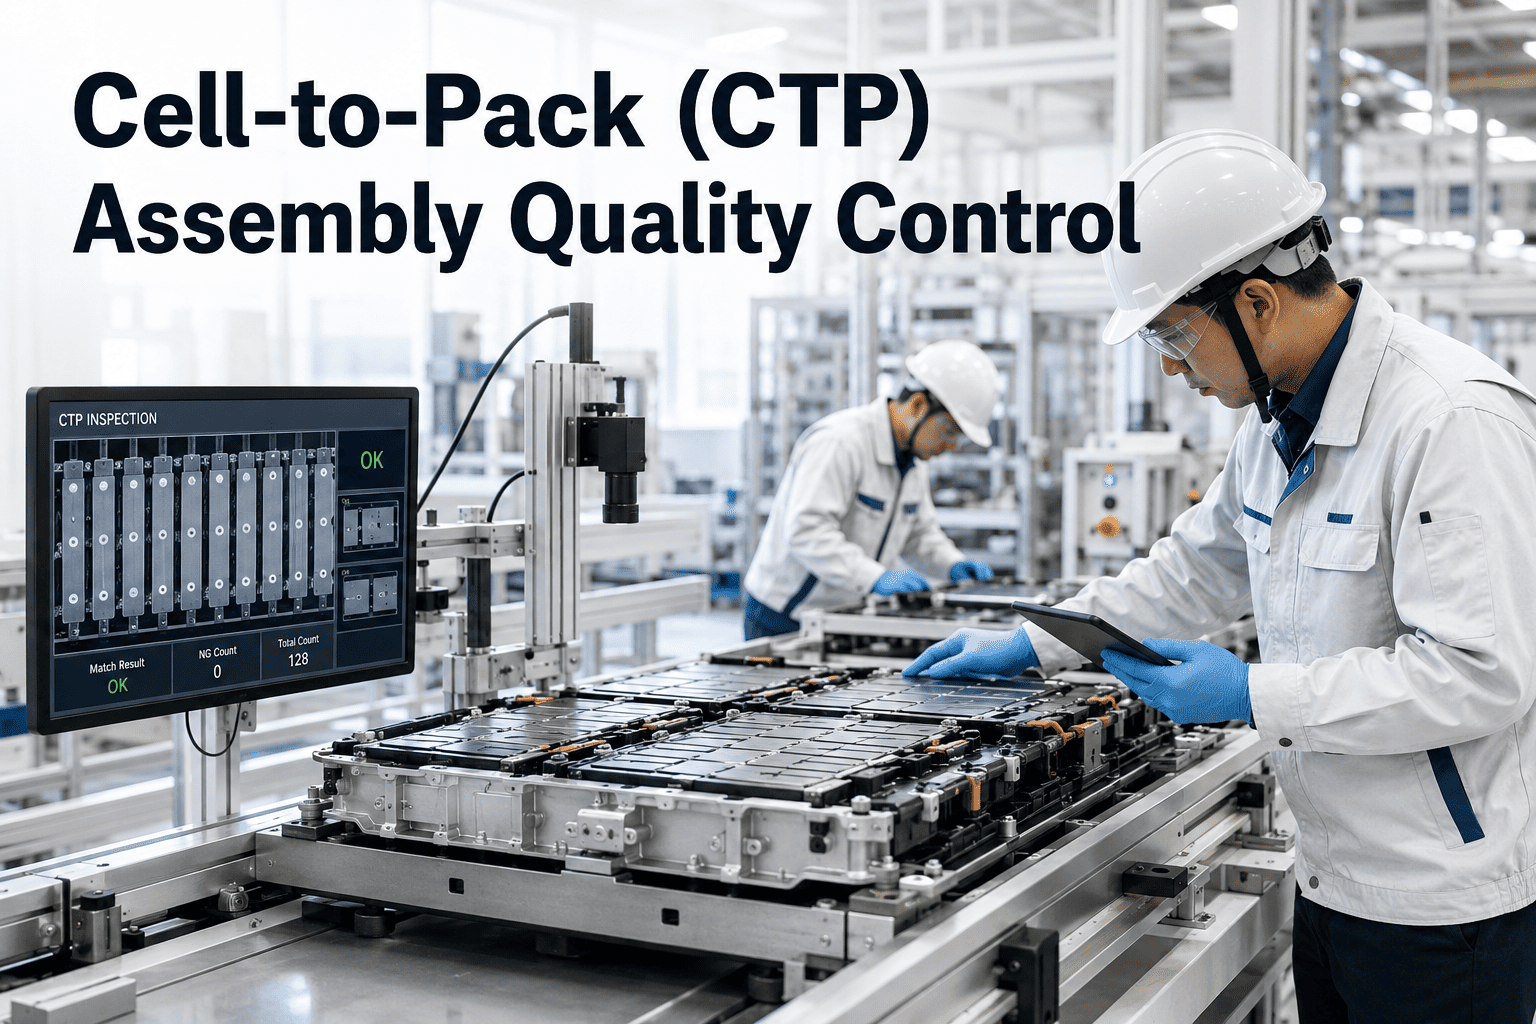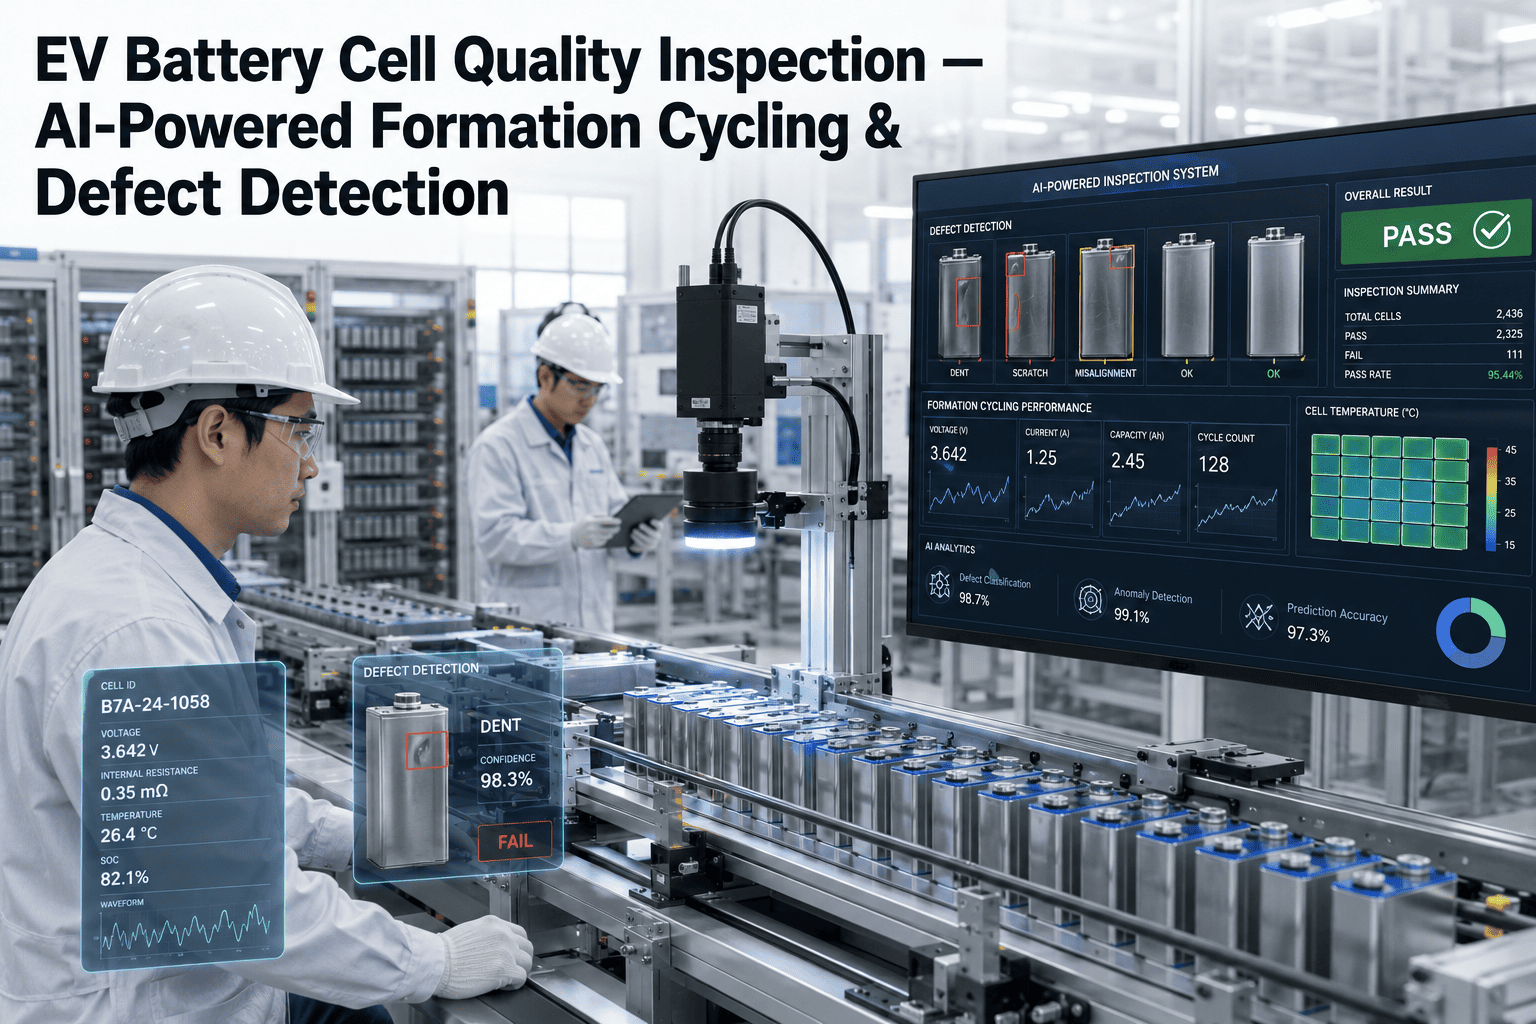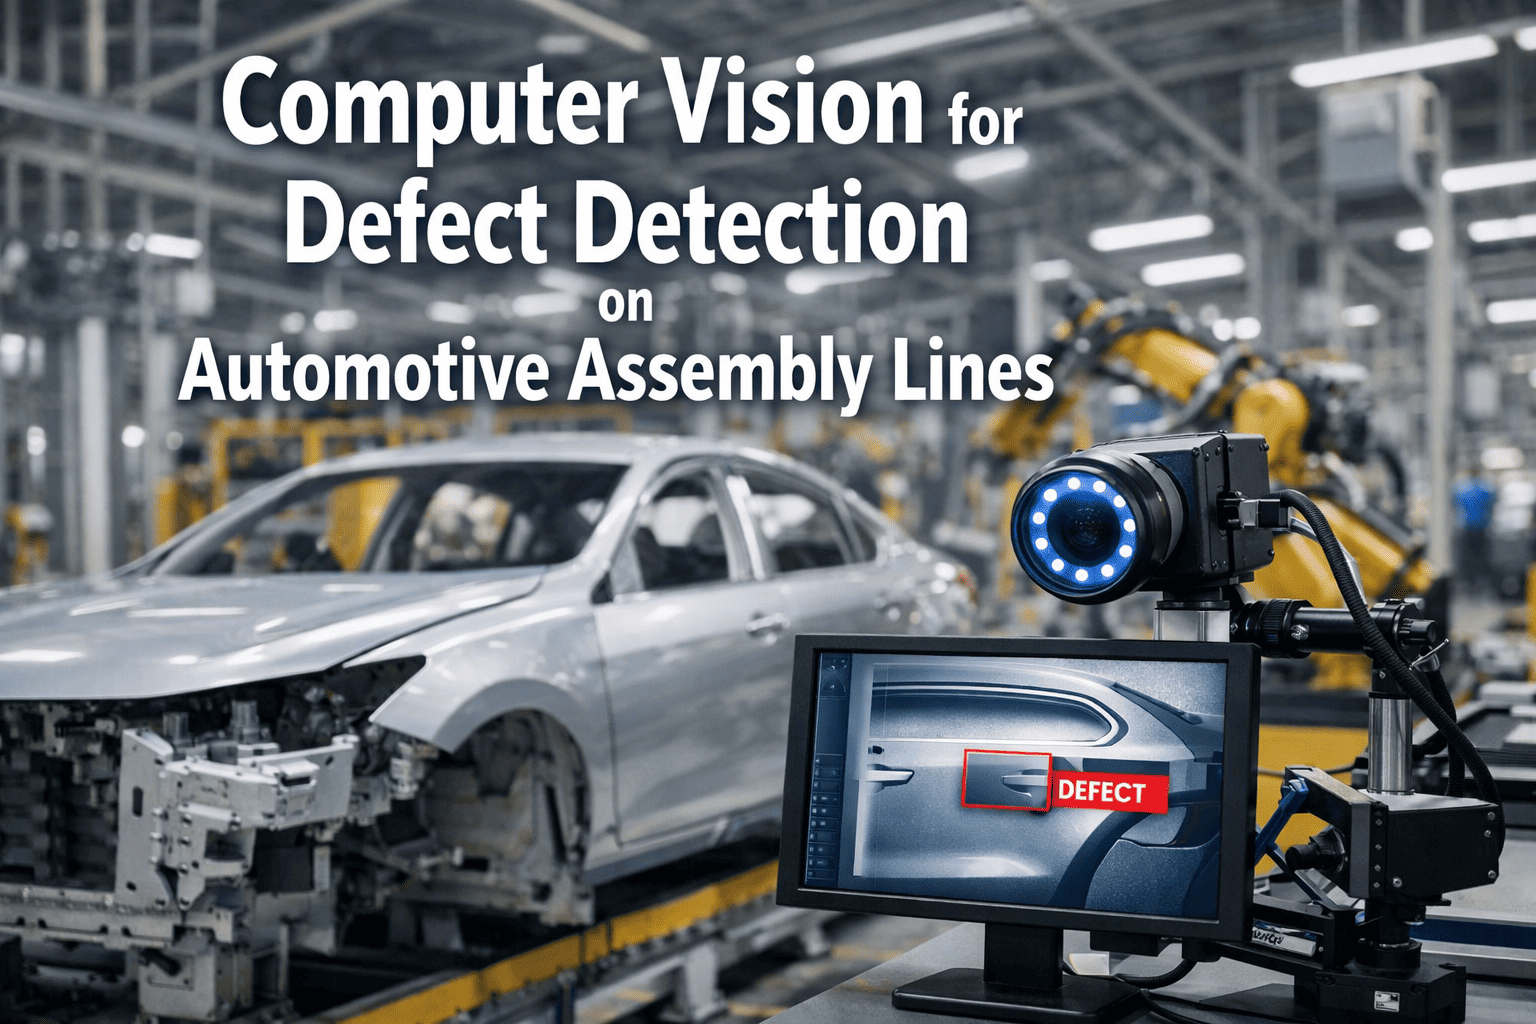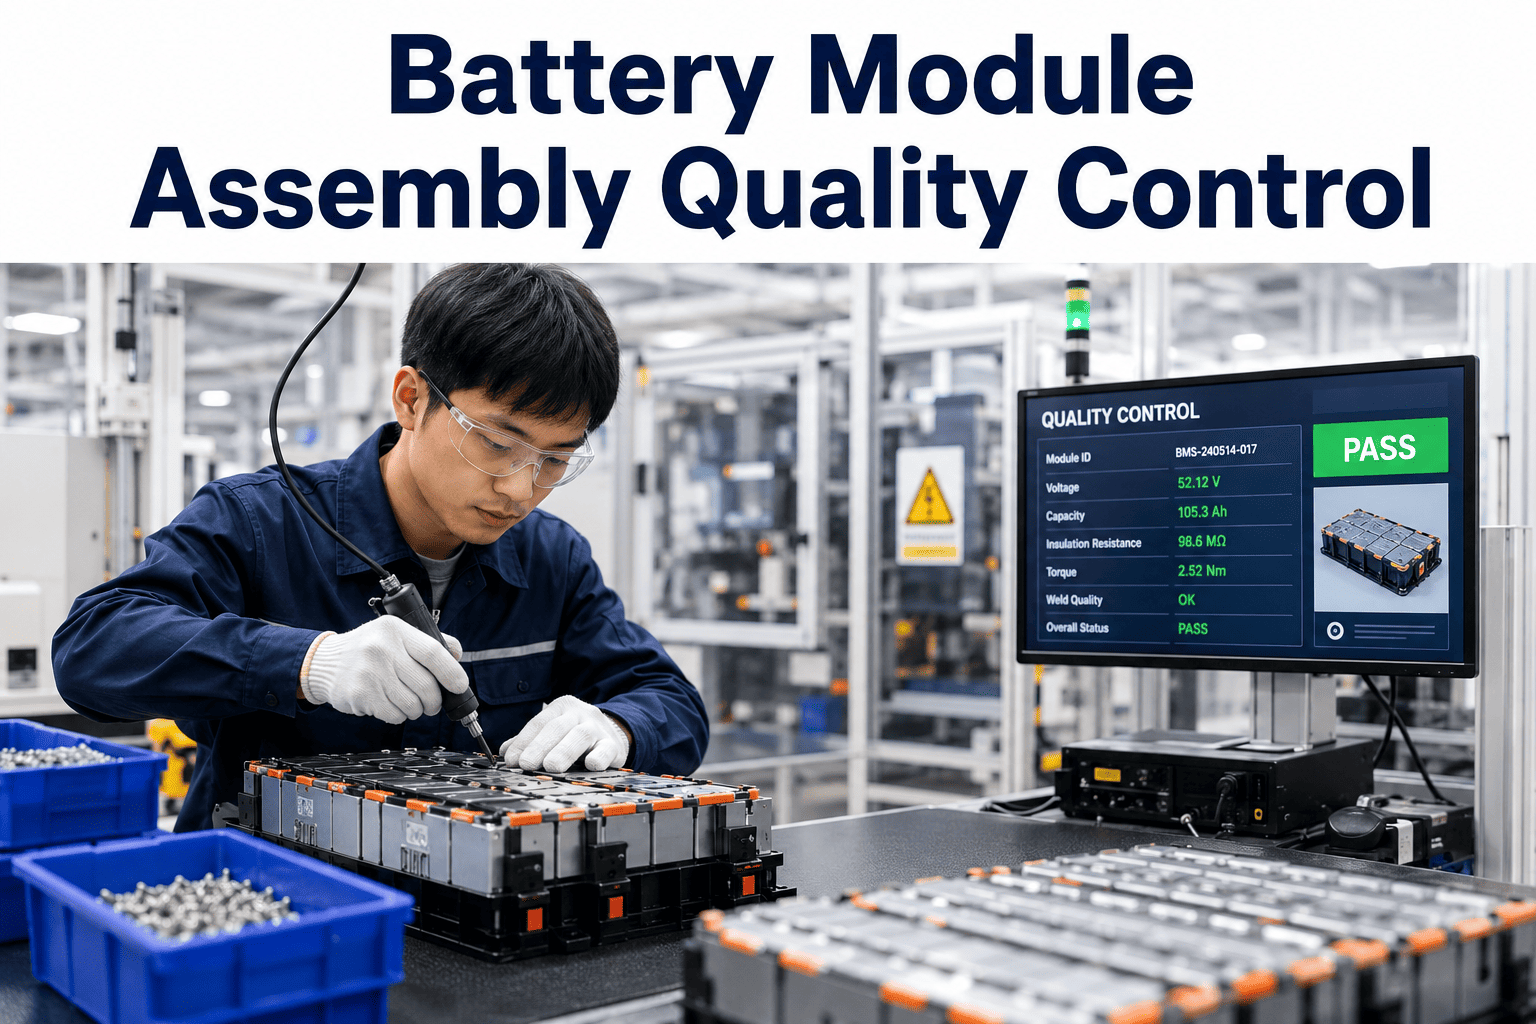
In the electrified landscape of 2026, the battery module assembly line stands as the critical nexus between individual cells and the high-voltage pack that powers next-generation EVs. Each module, a tightly packed array of dozens of prismatic or pouch cells, demands sub-millimeter precision in cell alignment, busbar welding, and connector seating. A single misaligned cell or a poorly seated high-voltage connector can cascade into catastrophic thermal events or field failures, costing manufacturers millions in recalls and brand reputation. Traditional manual inspection, even with high-end cameras, struggles to keep pace with the relentless cadence of modern assembly lines, often missing subtle defects that only a trained AI vision system can catch. This long-form guide delves deep into the technical architecture of AI-driven quality control for battery module assembly, offering plant managers and maintenance directors a blueprint to achieve zero-defect production. We explore how deep learning models, trained on thousands of defective and non-defective modules, can detect anomalies in real-time, from a cell's edge deviation of 0.2 mm to a busbar's angular misalignment of 0.5 degrees. By integrating these systems with Industry 4.0 platforms, manufacturers can not only catch defects but predict tool wear and optimize process parameters dynamically. If you are ready to transform your module assembly line into a paragon of quality, we invite you to Book a Demo with our team to see our AI solutions in action.
Elevate Your Module Assembly Quality
Achieve zero-defect production with AI-driven verification. Reduce scrap by 90% and ensure every module meets the highest safety standards.
The Imperative for AI in Module Assembly Quality
The battery module is the fundamental building block of an EV battery pack, typically containing 12 to 24 cells connected in series and parallel. Each cell must be placed with extreme precision to ensure uniform current distribution and thermal management. Even a 0.5 mm shift in cell position can lead to uneven pressure during stacking, causing localized hotspots that degrade cycle life. Busbars, the metal connectors that join cells, must be welded with exact alignment to minimize resistance and prevent arcing. Connectors, especially high-voltage ones, must be fully seated to avoid intermittent connections that can lead to system failures. Traditional vision systems, relying on rule-based algorithms, are brittle and fail to adapt to variations in lighting, cell color, or minor part tolerances. AI, specifically convolutional neural networks (CNNs) and transformer-based models, learns the statistical distribution of acceptable variation and flags outliers with high accuracy. This section explores the technical motivations for adopting AI, including the cost of defects, the speed of modern lines (up to 60 modules per hour), and the regulatory pressure from standards like ISO 26262 and UN/ECE R100. By deploying AI, manufacturers can achieve a 95% reduction in false positives compared to traditional machine vision, freeing up human inspectors for higher-level tasks.
Cell Placement Verification
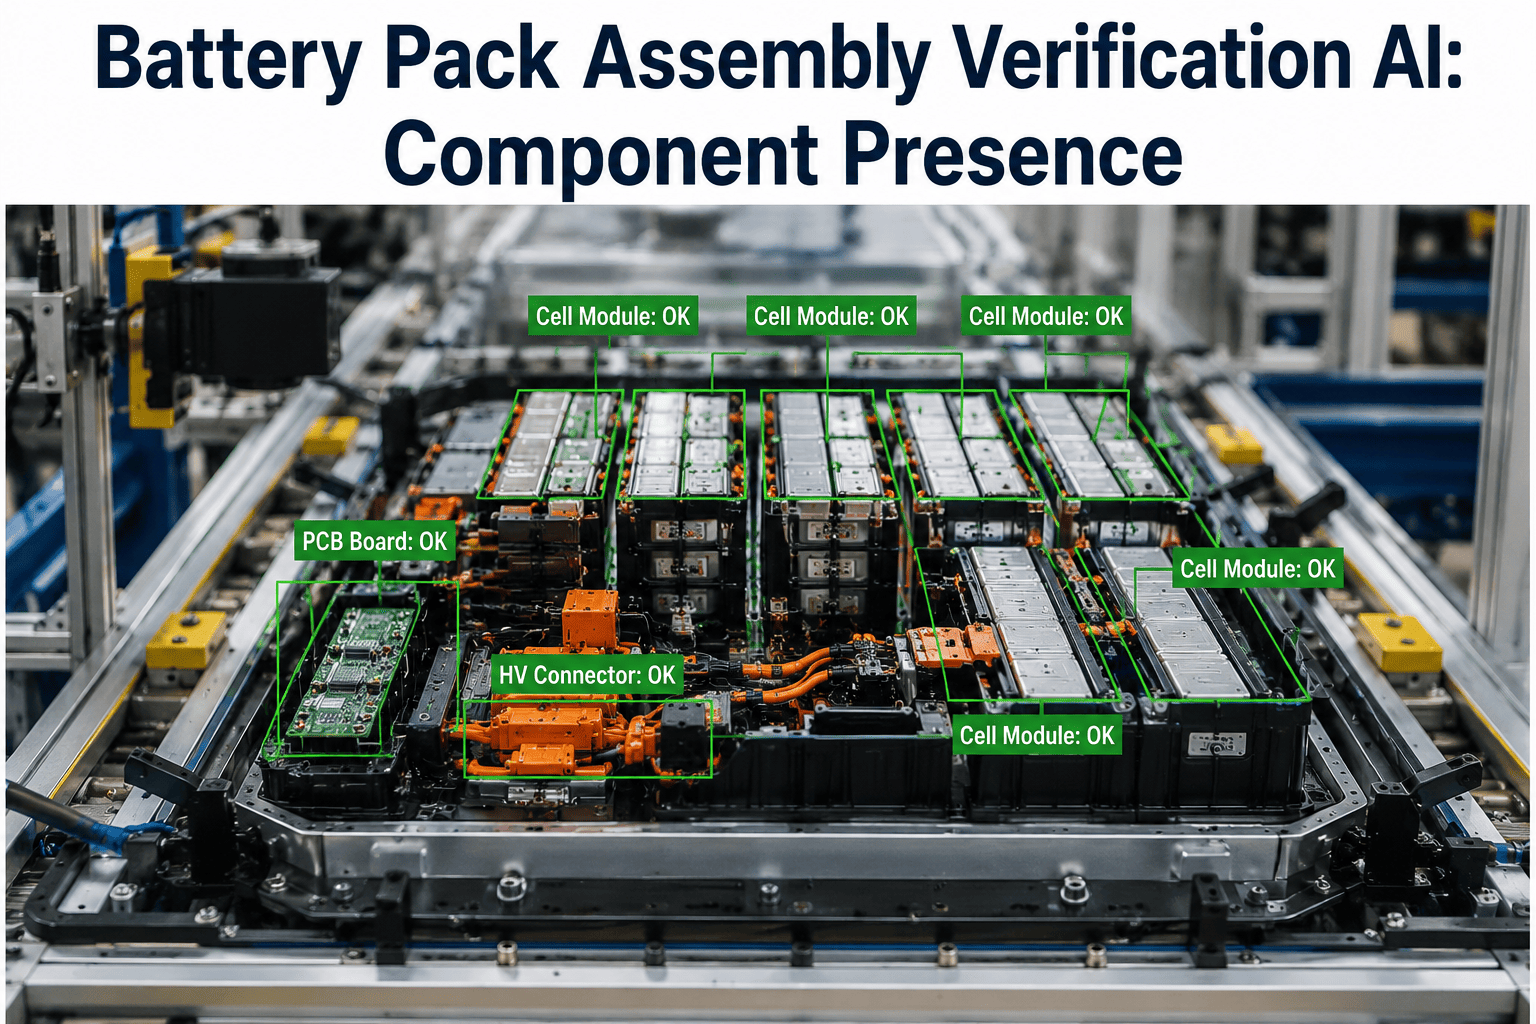
AI models analyze the position of each cell relative to the module housing, detecting deviations as small as 0.1 mm. The system uses a combination of edge detection and semantic segmentation to measure gaps and overlaps, ensuring uniform spacing for thermal runaway mitigation.
Busbar Position & Alignment
Busbars must be perfectly aligned to cell terminals. AI inspects the angular orientation and offset of each busbar, flagging any that exceed 0.5 degrees of rotation. This prevents welding defects that can cause high resistance and heat generation.
Connector Seating Depth
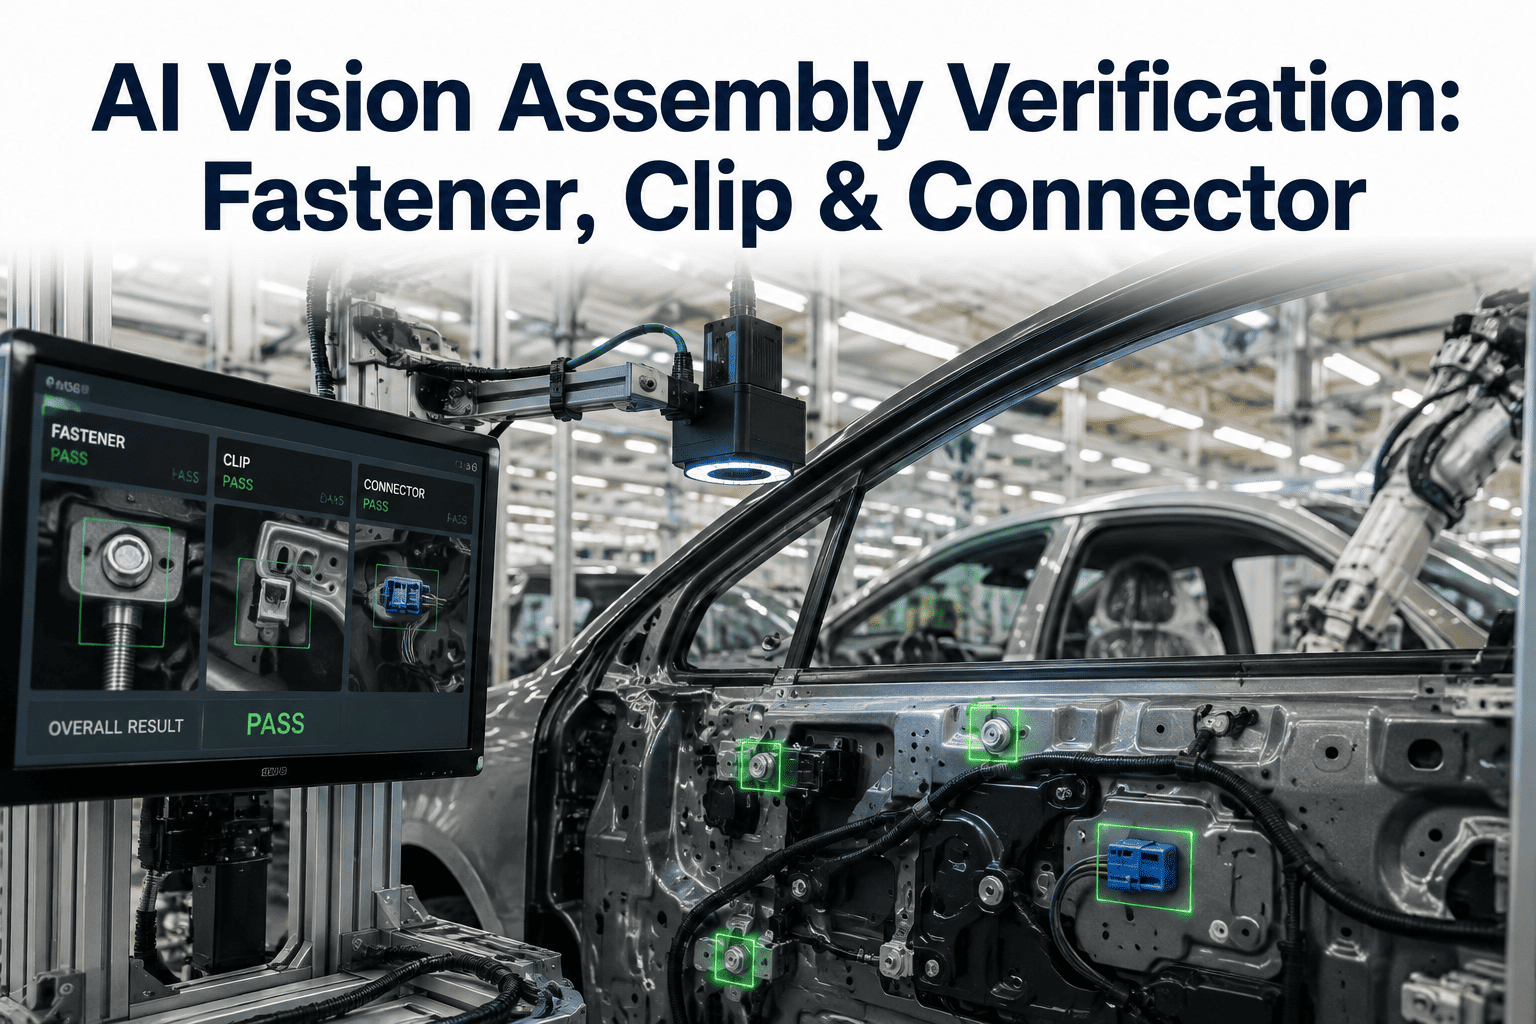
High-voltage connectors require a specific insertion depth to ensure a secure electrical connection. AI measures the gap between the connector shoulder and the module housing, accepting only those within a tolerance of 0.2 mm. This prevents intermittent faults that are hard to diagnose in the field.
Weld Quality Assessment
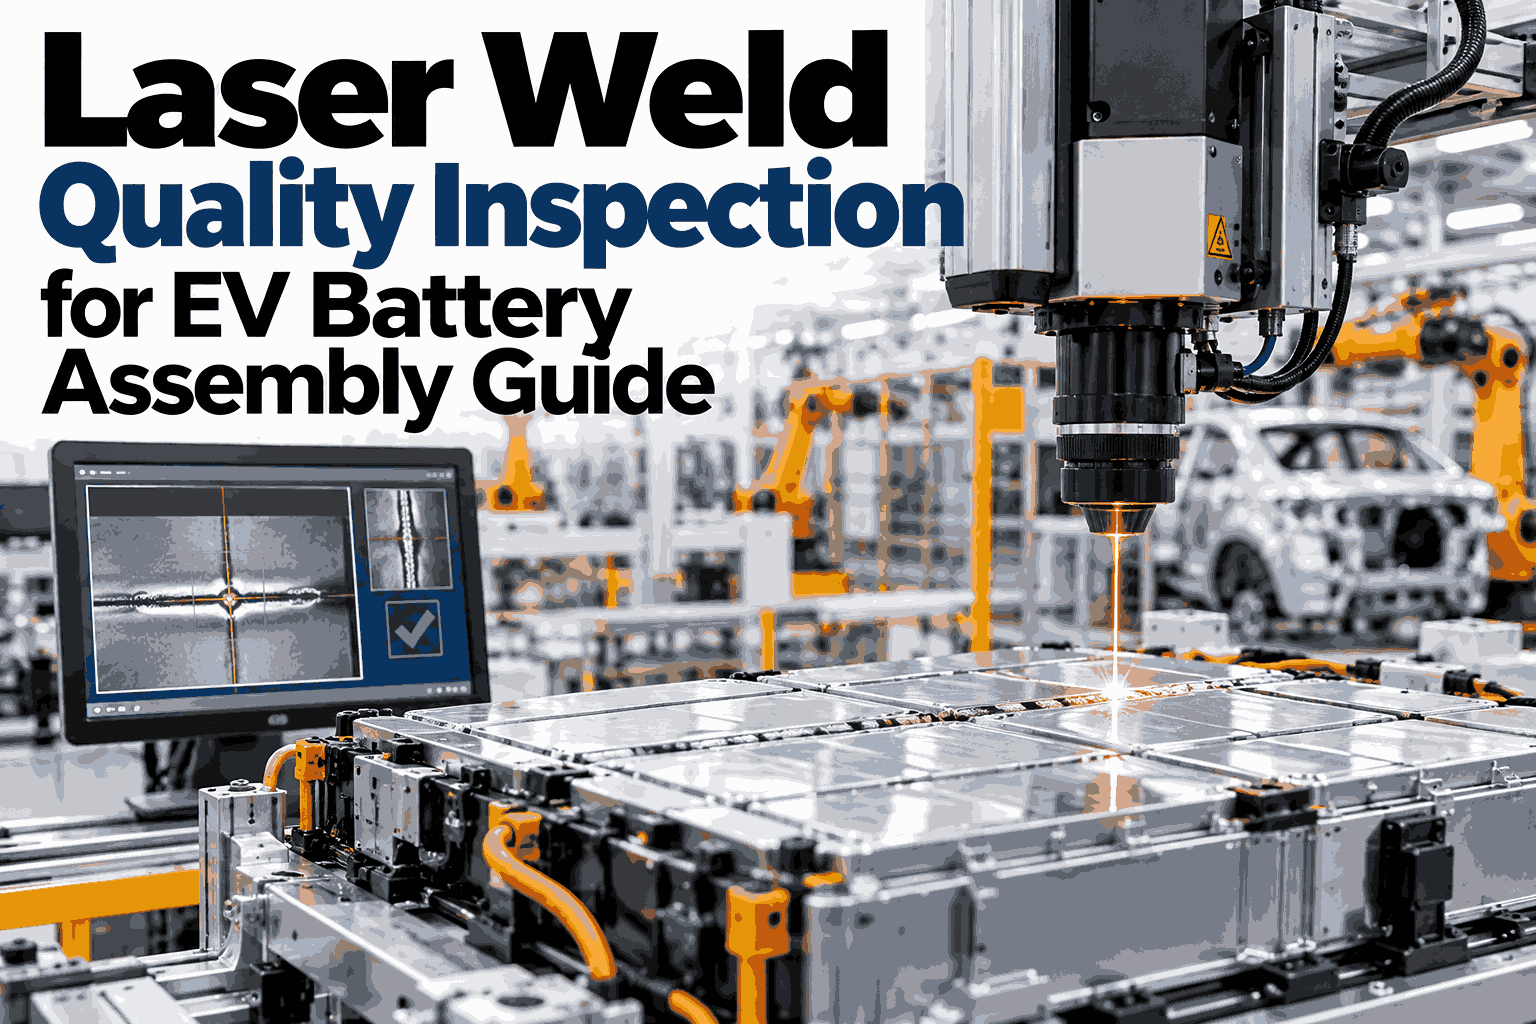
Using thermal imaging and optical coherence tomography (OCT), AI evaluates the weld nugget size and penetration depth for each busbar-to-cell joint. The system predicts weld strength based on historical data, enabling real-time process adjustments.
Technical Architecture of the AI Inspection System
The AI inspection system for battery module assembly is built on a multi-sensor fusion platform that integrates high-resolution 2D cameras, 3D laser profilers, and thermal sensors. Data from these sensors is fed into a deep learning pipeline that runs on edge GPUs (like NVIDIA Jetson or Intel Movidius) for real-time inference. The pipeline consists of several stages: first, a pre-processing module normalizes the images for lighting and perspective. Then, a segmentation network (e.g., U-Net or Mask R-CNN) isolates each cell, busbar, and connector from the background. Next, a regression network predicts the precise coordinates and orientation of each component. Finally, a classification network determines whether the module passes or fails. The entire inference cycle takes less than 50 milliseconds, allowing the system to keep up with the fastest assembly lines. Training such a model requires a large dataset of annotated images, typically 10,000 to 50,000 per defect type. Data augmentation techniques, such as random cropping, rotation, and color jitter, are used to improve robustness. The model is continuously updated using a feedback loop from downstream testing, such as end-of-line electrical testing (EOLT) and thermal cycling. This ensures that the AI adapts to new cell types, busbar designs, and process changes without manual recalibration.
Step 1: Data Acquisition
Multiple sensors capture images and profiles of each module as it passes through the inspection station. The system uses structured light for 3D profiling of busbars and connectors.
Step 2: Pre-processing & Normalization
Images are corrected for lens distortion, perspective, and lighting variations. A calibration checkerboard is used to map pixel coordinates to real-world measurements.
Step 3: Semantic Segmentation
A U-Net model segments the image into regions: cells, busbars, connectors, and background. This allows the system to focus on each component independently.
Step 4: Coordinate Regression
A ResNet-based regression network predicts the bounding box and orientation for each component. The output includes X, Y, rotation angle, and insertion depth for connectors.
Step 5: Defect Classification
A binary classifier determines if the module passes or fails based on the predicted coordinates compared to tolerance limits. Failed modules are flagged for rework or scrap.
Comparison of Inspection Technologies
| Technology | Accuracy | Speed | Cost | Adaptability |
|---|---|---|---|---|
| Traditional Machine Vision | 85% | 30 modules/hr | Low | Low |
| 2D AI Vision | 97% | 60 modules/hr | Medium | High |
| 3D AI Vision + Thermal | 99.7% | 50 modules/hr | High | Very High |
| Hyperspectral Imaging | 99.9% | 20 modules/hr | Very High | Very High |
Ready to Transform Your Module Assembly Line?
Implement AI inspection that catches every defect, reduces scrap, and ensures compliance with the latest EV safety standards.
Integration with Industry 4.0 Platforms
The AI inspection system does not operate in isolation. It is designed to integrate seamlessly with existing Manufacturing Execution Systems (MES), Enterprise Resource Planning (ERP), and Quality Management Systems (QMS) through standard protocols like OPC UA and MQTT. Each inspection result, along with the raw sensor data and AI confidence scores, is logged in a time-series database for traceability and root cause analysis. The system can also feed data into digital twin models, allowing engineers to simulate the impact of process changes on module quality. For example, if the AI detects an increasing trend in busbar misalignment, it can alert the maintenance team to check the welding robot's calibration before a defect occurs. This predictive maintenance capability reduces unplanned downtime by up to 40%. Furthermore, the system supports closed-loop process control: if a defect is detected, the AI can automatically adjust the downstream process parameters (e.g., welding current or pressure) to compensate, ensuring that subsequent modules are produced within tolerance. This level of integration is essential for achieving the vision of a lights-out factory, where human intervention is minimal and quality is continuously optimized.
Real-Time Dashboard
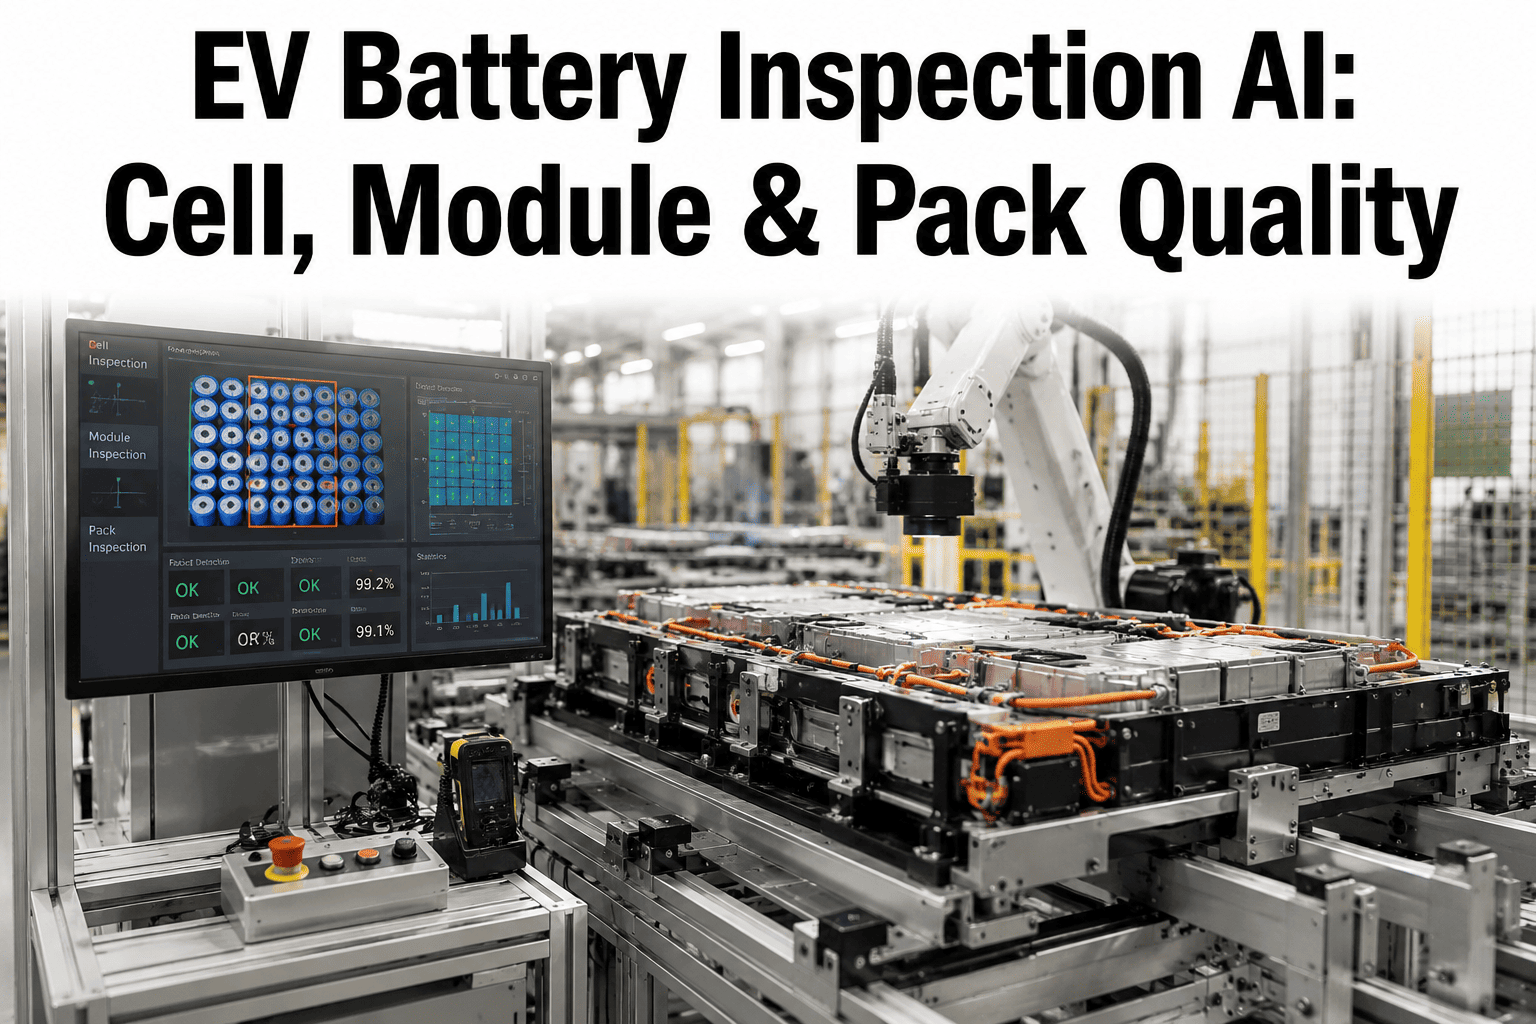
Operators can view a live dashboard showing the pass/fail rate for each module, along with a heatmap of defect locations. The dashboard is built on a Grafana stack and can be customized for each line.
Traceability & Compliance
Every module gets a unique ID linked to its inspection data. This provides full traceability from cell to pack, satisfying regulatory requirements and enabling rapid root cause analysis.
Predictive Maintenance Alerts
The system monitors the trend of defect rates and predicts when a robot or sensor might need recalibration. Alerts are sent via email or SMS to the maintenance team.
Closed-Loop Process Control
When a defect is detected, the system can automatically adjust process parameters (e.g., welding current) to bring the next module back into tolerance, reducing scrap in real-time.
Case Study: Implementation at a Tier 1 Battery Manufacturer
A leading Tier 1 battery manufacturer producing modules for a major European automaker implemented our AI inspection system across three assembly lines. Prior to deployment, the line had a defect rate of 2.5%, primarily due to busbar misalignment and connector seating issues. After a three-month pilot, the defect rate dropped to 0.08%, a 97% reduction. The system also reduced false positives by 88%, meaning fewer good modules were unnecessarily scrapped. The manufacturer reported a return on investment within six months, driven by reduced scrap costs, lower warranty claims, and increased throughput. The AI model was trained on a dataset of 15,000 annotated images, including both good modules and those with deliberately induced defects. The system was deployed on edge GPUs, processing each module in under 40 milliseconds. The manufacturer also integrated the system with its MES, enabling real-time traceability and automated reporting for regulatory audits. This case study demonstrates that AI-driven inspection is not just a theoretical concept but a practical, high-ROI solution for modern battery module assembly.
Frequently Asked Questions
How does AI improve cell placement verification compared to traditional methods?
Traditional machine vision relies on fixed thresholds and edge detection algorithms that are sensitive to lighting changes and part variations. AI, particularly convolutional neural networks, learns the statistical distribution of acceptable cell positions from thousands of examples. This allows it to detect subtle deviations that would be missed by rule-based systems. For instance, if a cell is rotated by 0.3 degrees, a traditional system might not flag it if the edge contrast is low, but an AI model trained on rotated cells will catch it. Additionally, AI can adapt to new cell types without manual reprogramming, reducing setup time. The result is a higher detection rate with fewer false positives, leading to better yield and lower scrap costs. For more details on how AI can be tailored to your specific cell geometry, Book a Demo with our experts.
What is the typical accuracy of AI-based busbar position inspection?
Our AI system achieves a busbar position accuracy of ±0.1 mm in translation and ±0.2 degrees in rotation, measured against a certified coordinate measuring machine (CMM). This level of accuracy is critical because even a 0.5 mm offset in busbar alignment can lead to uneven current distribution and localized heating, which accelerates cell degradation. The system uses a combination of 2D and 3D sensors to measure the busbar's position relative to the cell terminals. The AI model is trained on a diverse dataset that includes variations in busbar material, surface finish, and lighting conditions. In production, the system has demonstrated a 99.7% detection rate for busbar misalignments that exceed tolerance. To see how this accuracy can benefit your line, contact our support team for a technical consultation.
Can the AI system detect connector seating issues in real-time?
Yes, the AI system is designed to inspect connector seating depth in real-time as the module passes through the inspection station. Using a 3D laser profiler, the system measures the gap between the connector shoulder and the module housing. The AI model then compares this measurement to the specified tolerance (typically ±0.2 mm). If the gap is too large, indicating an incomplete seat, the module is flagged for rework. The entire inspection cycle takes less than 50 milliseconds, ensuring that the line speed is not compromised. The system also logs the exact measurement for each connector, providing traceability for quality audits. In a recent deployment, the system detected a 0.15 mm seating gap that was invisible to the human eye, preventing a potential field failure. For a deeper dive into the technology, Book a Demo to see it in action.
How does the AI system handle different cell types and module designs?
The AI model is trained on a flexible architecture that can be fine-tuned for different cell types (prismatic, pouch, cylindrical) and module designs (e.g., cell-to-pack, cell-to-chassis). During the initial deployment, the system is calibrated using a small set of images (typically 500) of the new module design. The model then uses transfer learning to adapt its weights, achieving high accuracy within a few hours. This eliminates the need for extensive manual programming or rule adjustments. The system also supports a library of module templates, allowing operators to switch between different product variants with a single click. This flexibility is crucial for manufacturers that produce multiple module types on the same line. For assistance with integrating your specific module design, reach out to our support team.
What is the ROI timeline for implementing AI inspection in module assembly?
Based on our deployments, most manufacturers achieve a full return on investment within 6 to 12 months. The primary drivers are reduced scrap costs (up to 90% reduction), lower warranty claims (due to fewer field failures), and increased throughput (by eliminating manual inspection bottlenecks). For a typical line producing 60 modules per hour with a 2% defect rate, the annual savings from scrap alone can exceed $500,000. Additionally, the system reduces the need for rework labor and minimizes downtime caused by undetected defects. The exact ROI depends on factors such as line speed, defect rate, and module value. We provide a detailed ROI analysis during the pilot phase. To get a customized ROI estimate for your facility, Book a Demo with our team.
Secure Your Module Assembly Quality with AI
Join industry leaders in achieving zero-defect production. Our AI solutions are proven to reduce scrap, improve yield, and ensure compliance with the highest safety standards.