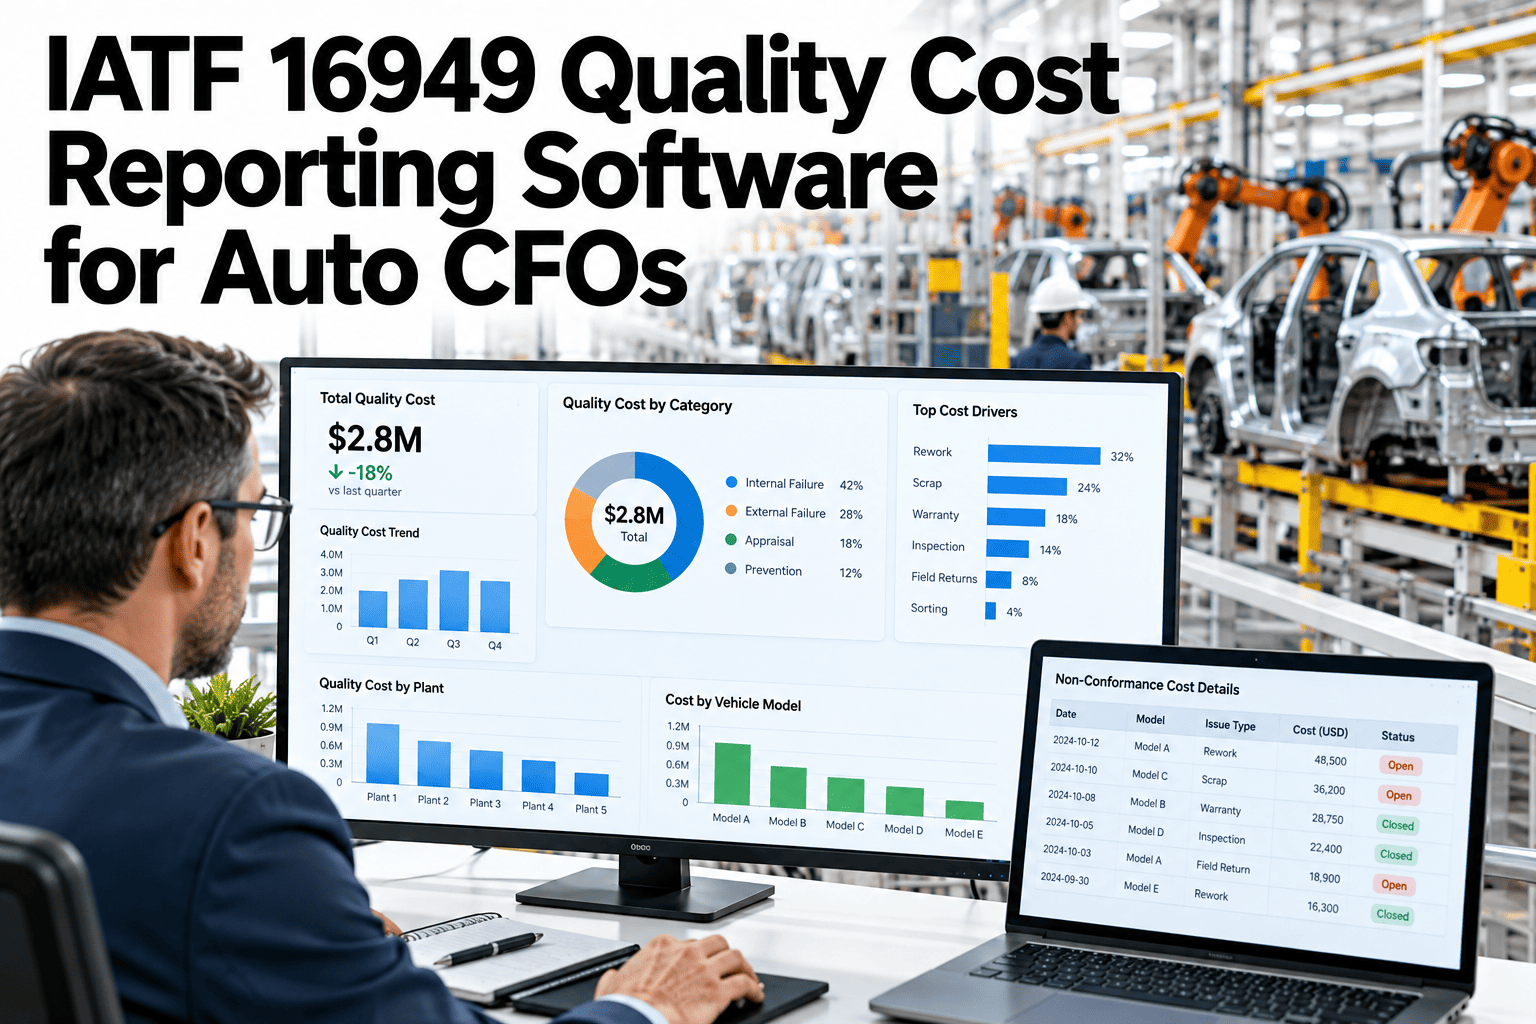
Quality cost in most OEM plants lives in three different places, scrap and rework numbers with operations, warranty and field return costs with finance, and inspection labor buried in headcount budgets. A CFO trying to build an investment case for a quality improvement project usually has to manually stitch these together, and by the time the numbers are assembled they're already a quarter stale. Internal failure, external failure and appraisal cost on one live scorecard turns quality from a compliance line item into a number finance can actually act on. CFOs and quality leaders can see their own quality cost consolidated this way in a short session.
One Scorecard for Internal, External and Appraisal Cost
iFactory consolidates quality cost into one live CFO scorecard, updated continuously instead of reassembled quarterly.
Why These Three Categories, Together
Each category tells a different part of the story, and viewed separately they can mislead. Appraisal cost going up while internal failure drops might be exactly the tradeoff worth making, but only if you can see both at once.
| Cost Category | Definition | Typical Driver |
|---|---|---|
| Internal failure | Cost of defects caught before the product leaves the plant | Scrap, rework labor, line downtime from quality holds |
| External failure | Cost of defects that reach the customer | Warranty claims, field returns, recall-related cost |
| Appraisal cost | Cost of checking and verifying quality | Inspection labor, testing equipment, audit time |
See Your Quality Cost Consolidated on One View
Book a 30-minute session and iFactory will build a sample cost scorecard from your own plant and warranty data.
Six Months of Total Quality Cost
One plant tracked total quality cost as a share of revenue over six months after consolidating reporting and acting on the visible tradeoffs.
Why CFOs Need This on One Scorecard
Investment Justification
A clear before-and-after cost picture makes the business case for a quality investment concrete rather than qualitative.
Early Warning on Warranty Exposure
Rising external failure cost shows up in near real time instead of surfacing in a quarterly finance close.
Cross-Plant Comparison
Consistent categorization across plants lets a CFO compare quality cost on a normalized basis, not an apples-to-oranges one.
Signals Your Quality Cost Reporting Has a Gap
Where iFactory Fits
iFactory pulls scrap, rework, warranty and inspection data into one continuously updated quality cost scorecard.
Live Cost Consolidation
Internal failure, external failure and appraisal cost are pulled from existing systems into one continuously updated view.
Trend and Benchmark Reporting
Cost trends over time and across plants are tracked on a consistent basis for direct comparison.
Investment Case Modeling
A proposed appraisal investment can be modeled against historical failure cost reduction to build a defensible business case.
CFO-Ready Reporting
The scorecard is built for finance review, not just a quality department dashboard.
Reviewed by iFactory's Quality Systems team for alignment with standard cost-of-quality categorization and IATF 16949 practice. The trend figures shown are illustrative; actual categorization and cost definitions should align with your own finance team's standards.
Frequently Asked Questions
How does this connect to our existing finance systems?
Cost data is built to feed into or align with your existing ERP and finance reporting rather than creating a separate, disconnected ledger, so figures reconcile rather than conflict. Support can review your current finance system integration.
Can quality cost categories be customized to our own definitions?
Yes, cost-of-quality categorization can vary slightly by organization, and the scorecard is configured to match your existing definitions rather than imposing a new standard.
How current is the data on the scorecard?
Data updates continuously as source systems report new figures, rather than on a quarterly or monthly batch cycle, which is the main difference from a manually assembled quality cost report. See update frequency demonstrated on your own data in a short session.
Does this work across multiple plants with different ERP systems?
Yes, data from different plant-level systems is normalized into a consistent categorization, allowing direct cross-plant comparison even when underlying systems differ.
How is this used to build a capital investment case?
Historical cost trends tied to specific quality interventions provide the evidence base for projecting the return on a proposed investment, rather than relying on industry benchmarks alone. Ask support for a sample investment case format.
Give Finance One Live View of Quality Cost
iFactory consolidates internal failure, external failure and appraisal cost into one CFO-ready scorecard. Book a walkthrough on your own data.