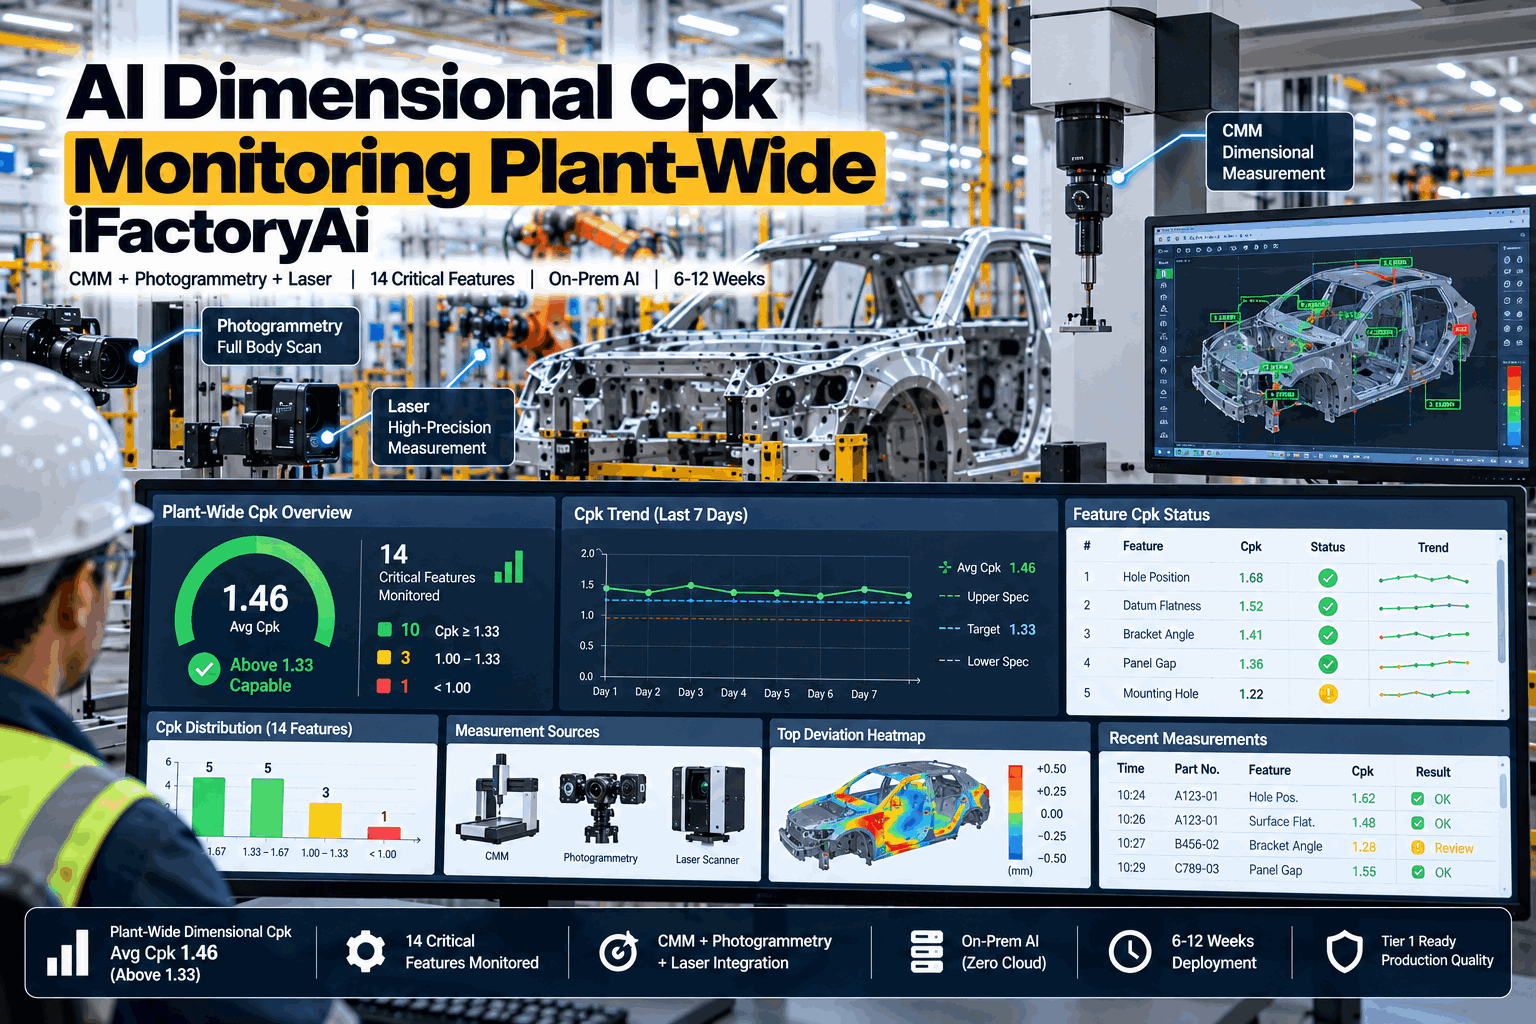
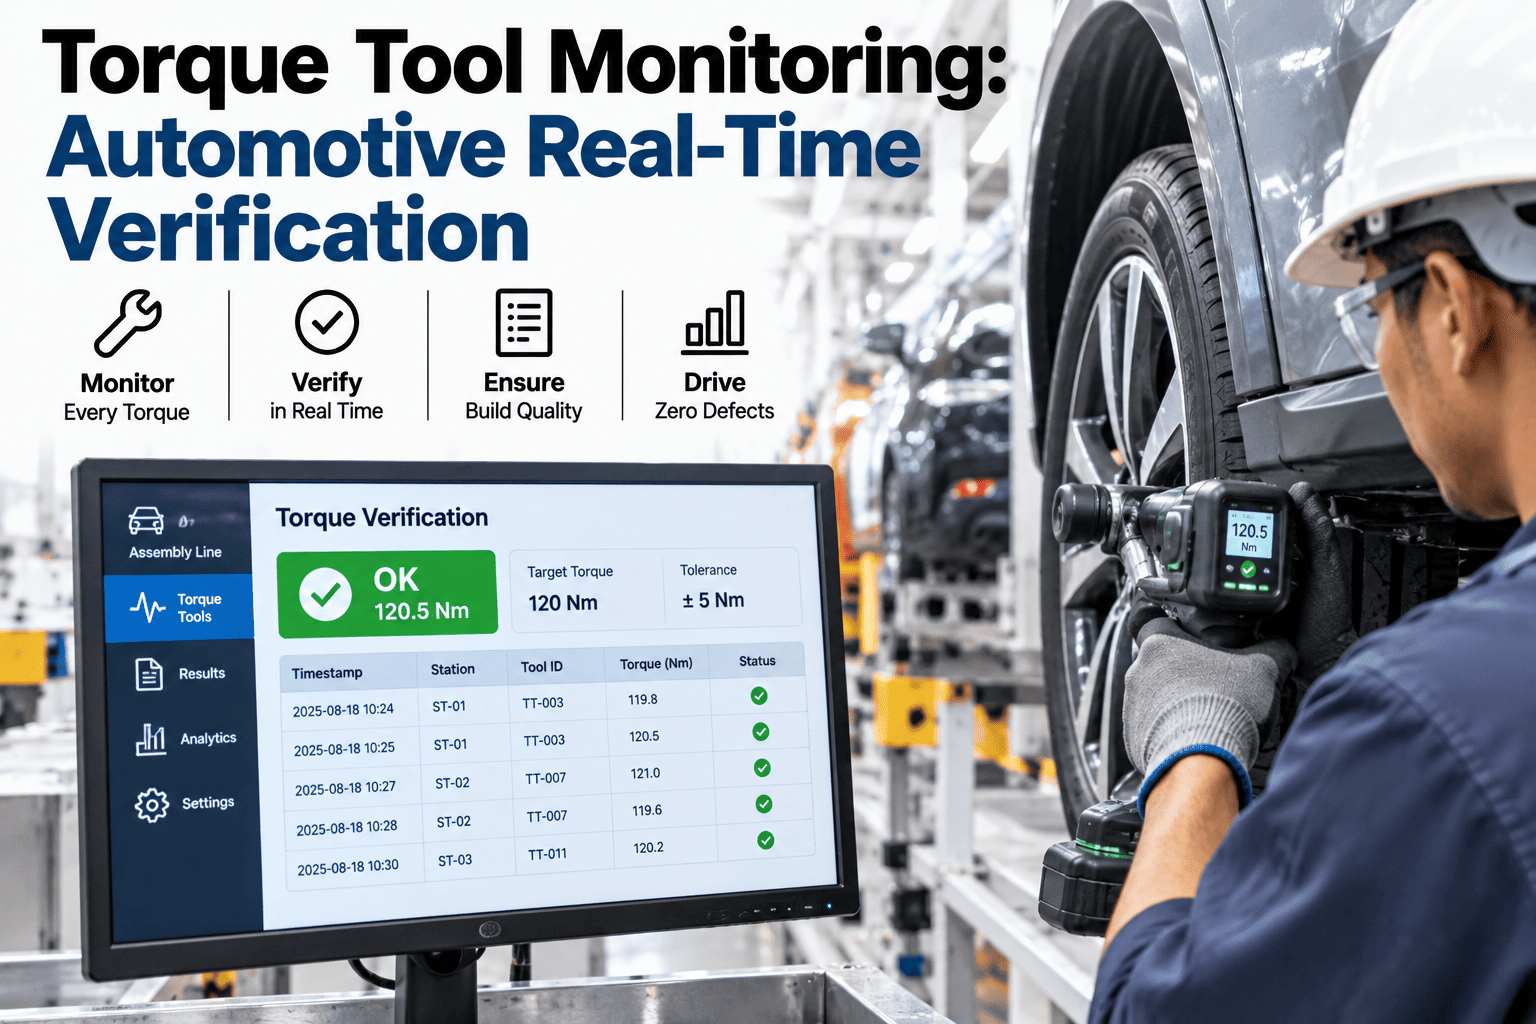
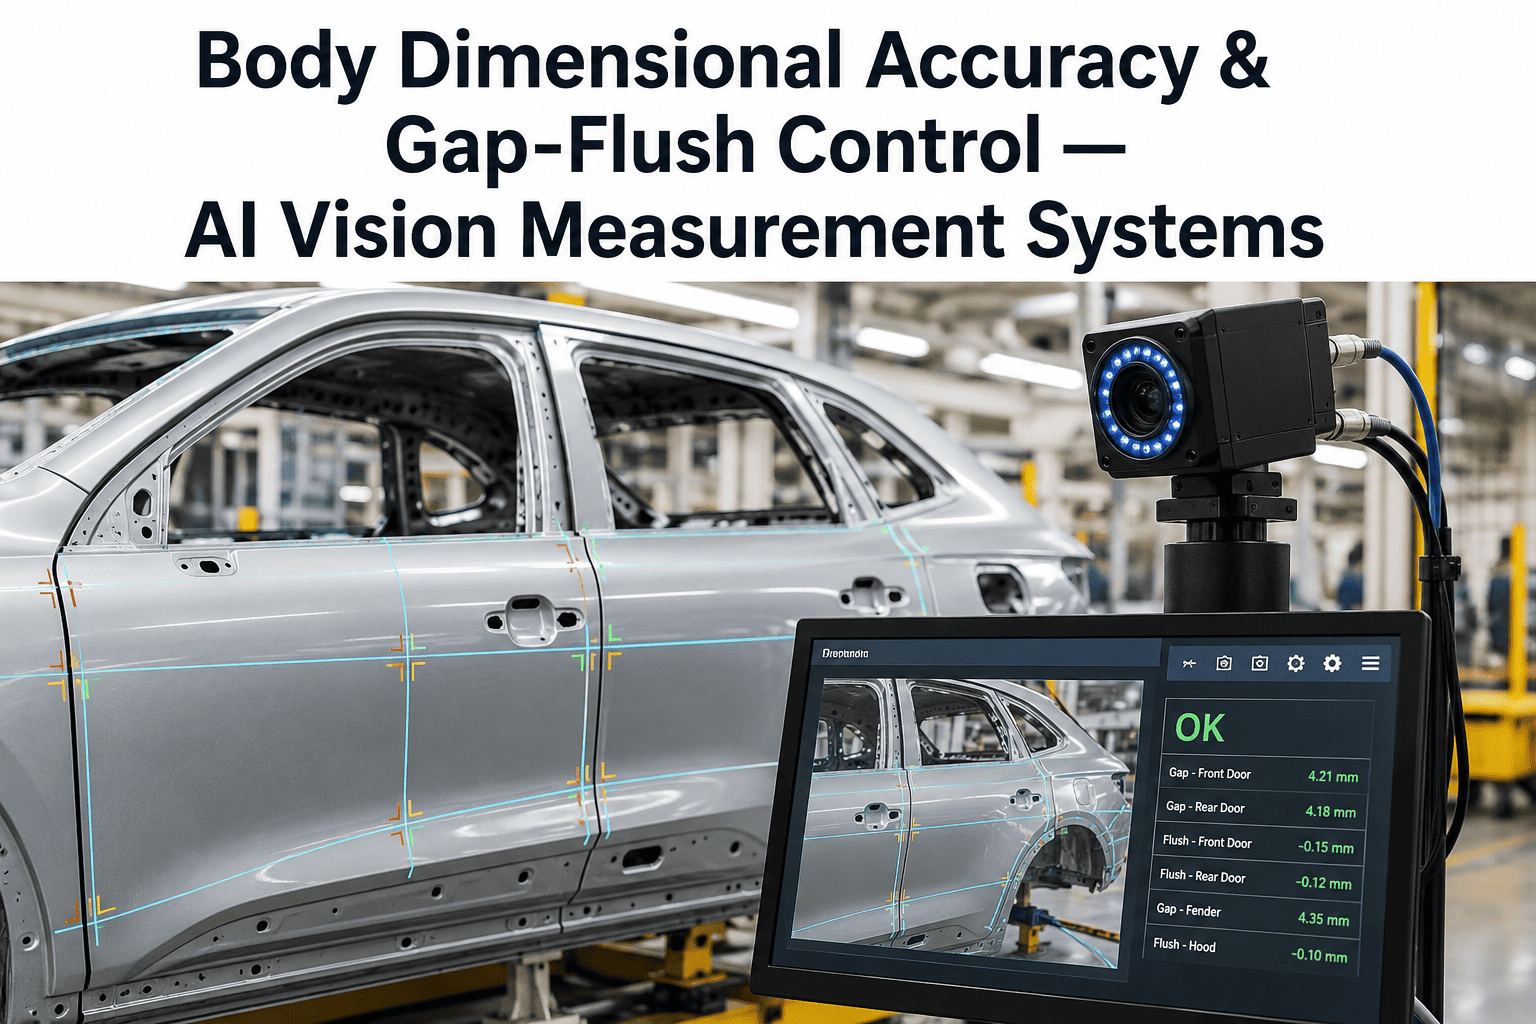
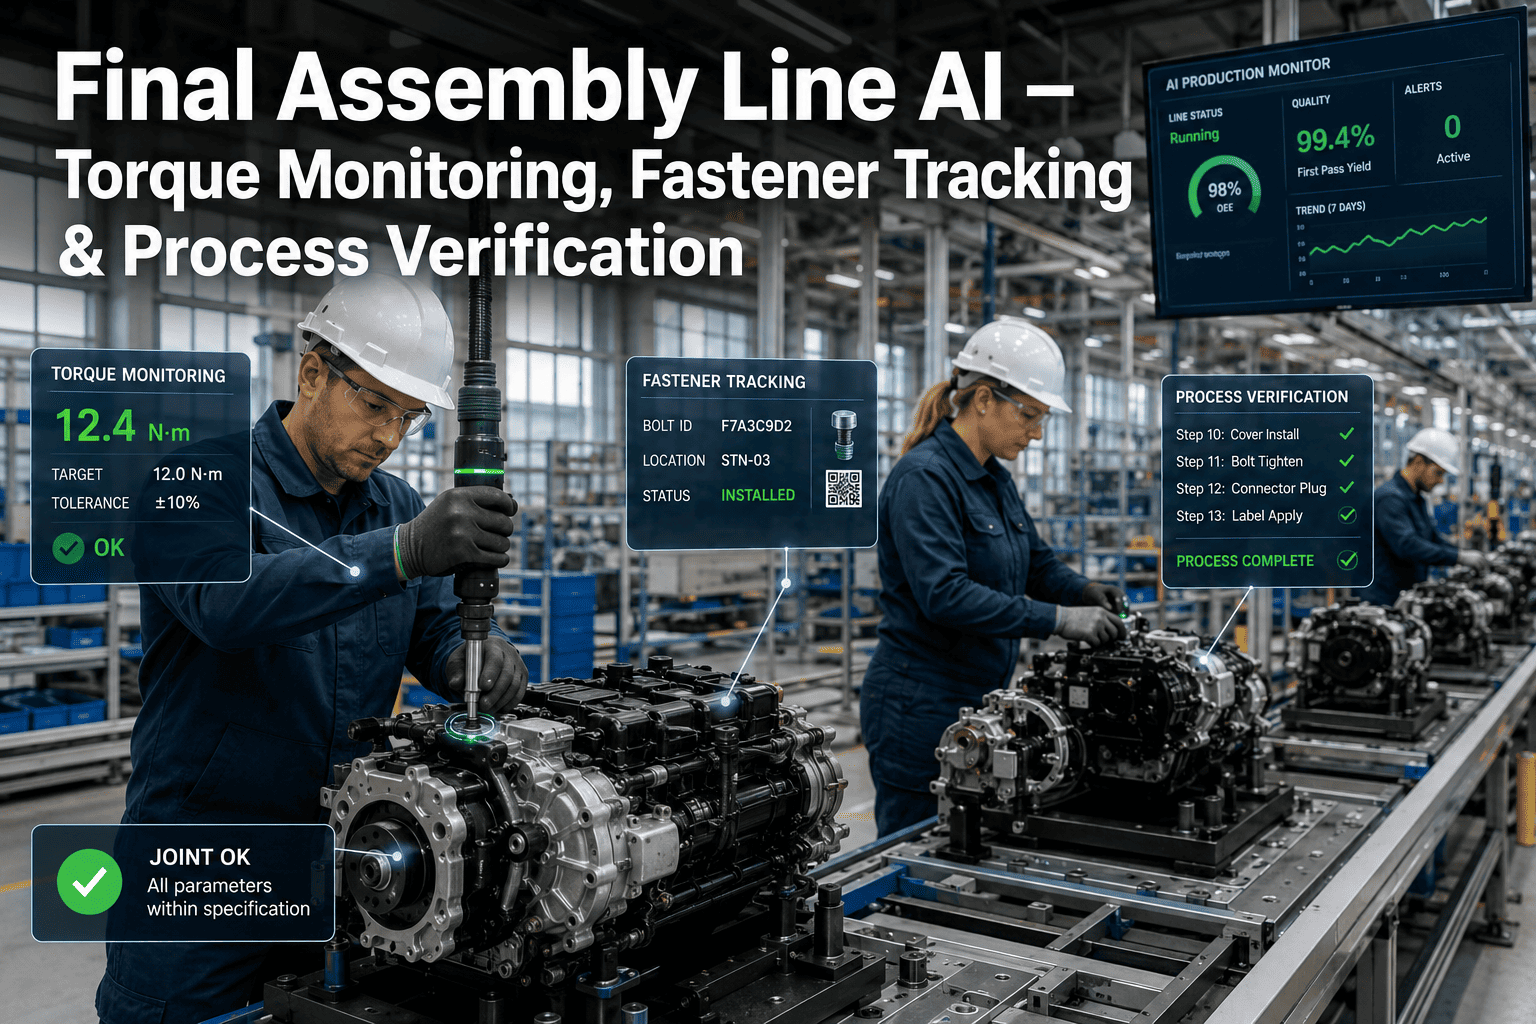
A machined engine block has one bore diameter, one flatness spec, and one bolt torque sequence with eight fasteners — and most SPC deployments still chart these as though they have nothing to do with each other. A bore that drifts out of round rarely does so in isolation; it correlates with a fixture wear pattern that also shows up as a torque variance three stations downstream. Charting each characteristic on its own separate, disconnected control chart means an engineer sees three unrelated yellow flags instead of one clear root-cause signal. Multi-characteristic SPC exists to fix exactly this — correlating dimensional, torque, and force data so a pattern across characteristics becomes visible before it becomes a scrap event. If your dashboard still shows each measurement in its own silo, book a demo to see correlated monitoring on a real part family.
One Part, Many Characteristics, One Root Cause
Automotive components rarely fail on a single dimension alone. iFactory's multi-characteristic SPC correlates dimensional, torque, and force measurements on the same chart family, surfacing the shared root cause that isolated single-characteristic charts miss entirely.
Why Single-Characteristic Charts Miss the Real Pattern
A traditional SPC deployment assigns one X-bar and R chart per characteristic, reviewed independently by whichever engineer owns that specific dimension or torque spec. This structure made sense when charts were plotted by hand on paper. It creates a real blind spot in a modern multi-station assembly line, where a single upstream cause — a worn locating pin, a drifting fixture, a degrading tool — can simultaneously affect a bore diameter at one station and a torque reading three stations later.
Different engineers own different characteristics, so nobody has visibility across the full set of measurements on the same part to notice a shared pattern.
By the time someone manually cross-references two separate charts and notices a timing correlation, hours or shifts of affected production may have already occurred.
Without a connected view, root-cause investigation starts from scratch on each isolated violation rather than immediately checking related characteristics for the same signature.
Two engineers can spend hours separately investigating what turns out to be the exact same upstream fixture issue, simply because their charts never talked to each other.
A Correlated Failure Pattern Across Three Characteristics
The table below illustrates a real category of failure pattern common on transmission housing assembly — a single fixture wear condition manifesting across three separately-charted characteristics that, viewed together, immediately point to one root cause.
| Characteristic | Station | Isolated Signal | Correlated Interpretation |
|---|---|---|---|
| Bore diameter, bearing bore | Machining, Station 4 | Gradual upward trend over 6 hours | Locating pin wear beginning to affect part positioning |
| Bolt torque, housing cover | Assembly, Station 11 | Increased variance, no trend | Misaligned bore causing inconsistent clamp load during fastening |
| Press-fit force, bearing insertion | Assembly, Station 12 | Two-of-three rule violation | Bore diameter drift directly affecting interference fit force |
Viewed in isolation, each of these three signals looks like a separate, moderate-severity issue worth a routine investigation. Viewed together on a correlated multi-characteristic view, the shared timing and shared station family point directly at the Station 4 locating pin as the single root cause — collapsing three investigations into one.
See Your Own Part's Characteristics Correlated on One Screen
Bring your dimensional, torque, or force data from a recent investigation and we'll show you how a correlated view would have shortened the root-cause path.
The Three Measurement Types Most Commonly Correlated
Multi-characteristic SPC is most valuable when it spans measurement types that share a physical relationship, even when they are captured by entirely different gauges at different stations.
Dimensional Measurements
Bore diameters, flatness, concentricity, and positional tolerances captured by CMM, vision systems, or fixed gauges at machining and inspection stations.
Torque Measurements
Fastening torque and angle data from smart wrenches and nutrunners, directly sensitive to upstream dimensional variation affecting clamp surfaces.
Force Measurements
Press-fit insertion force, weld force, and crimp force data that reflect interference fit and material engagement, often the first place a dimensional drift becomes visible downstream.
How a Correlated Multi-Characteristic View Is Built
Building a genuinely useful correlated view requires more than displaying multiple charts side by side — it requires the underlying data model to understand which characteristics are physically related.
Characteristic Relationship Mapping
Engineers define which characteristics share a physical or process relationship — same fixture, same tool, same upstream operation — so the system knows what to correlate.
Time-Synchronized Data Capture
Measurements from different stations and different gauge types are aligned by part serial number or build sequence rather than by capture timestamp alone.
Cross-Characteristic Signal Detection
The platform watches for the same rule violation pattern appearing across related characteristics within a defined time window, flagging it as a likely shared root cause.
Unified Investigation View
A single investigation record consolidates all related characteristic data, rather than requiring an engineer to manually pull and compare separate reports.
Where Multi-Characteristic Monitoring Pays for Itself
A driveline supplier producing CV joints found that torque violations on the boot clamp station and dimensional violations on the housing bore station were being investigated as entirely separate quality events for months, each closed with a different corrective action that didn't hold. Once the two characteristics were correlated on a single view, the timing overlap across three separate incidents became visible immediately — all three traced back to the same worn broach tool on an upstream spline-cutting operation. A single tool change resolved what had previously generated three separate, only partially effective corrective actions.
The financial impact of this kind of consolidation compounds across a plant running dozens of part families simultaneously. Every hour saved on redundant root-cause investigation is an hour an engineer spends on process improvement instead of re-diagnosing the same underlying issue from a different angle.
Measuring the Value of Correlated Monitoring
Quality leaders adopting multi-characteristic SPC typically track a small set of metrics to confirm the investment is paying off in reduced investigation time and fewer repeat corrective actions.
| Metric | Before Correlation | After Correlation |
|---|---|---|
| Average root-cause investigation time | 4 to 8 hours per event | 1.5 to 3 hours per event |
| Duplicate investigations on same root cause | Common across siloed teams | Rare — single consolidated record |
| Repeat corrective actions within 60 days | 15% to 25% of closed findings | Under 8% of closed findings |
| Engineer time on cross-referencing charts | Significant manual effort weekly | Near zero — automated correlation |
Frequently Asked Questions
How do we decide which characteristics should be correlated together?
Start with characteristics that share a physical relationship through a common fixture, tool, or upstream process step — a bore diameter and a downstream press-fit force are naturally related because the bore directly determines interference fit, while two unrelated cosmetic dimensions on opposite ends of a part are unlikely to share a meaningful correlation. Process FMEA documentation is often the best starting reference, since it already maps which characteristics share failure modes and upstream causes. Our engineering team can review your control plan and FMEA to identify the highest-value correlation groups for your specific part family — book a demo to walk through it.
Does multi-characteristic SPC require different gauges or measurement equipment?
No — multi-characteristic correlation is a data and analysis capability layered on top of whatever measurement equipment you already use, whether that is a CMM, a smart torque wrench, a load cell, or a fixed gauge. The requirement is that each measurement is captured with enough part-level traceability, typically a serial number or build sequence identifier, to allow the system to align readings from different stations back to the same physical part. Most automotive plants already have this traceability infrastructure in place for warranty and recall purposes. For a technical review of your current data capture setup, reach out to support.
Can correlated charts create false patterns between characteristics that aren't actually related?
This is a real risk if correlation groups are defined purely on statistical coincidence rather than engineering judgment about physical relationship. The recommended approach is to define correlation groups based on process knowledge — FMEA, control plan structure, and known process physics — rather than letting the system automatically group any two characteristics that happen to trend together over a short window. This keeps the correlated view grounded in genuine cause-and-effect relationships rather than statistical noise. To review best practices for defining correlation groups on your specific parts, schedule a session with our team.
How does multi-characteristic SPC change the role of the quality engineer?
Rather than eliminating the need for engineering judgment, correlated SPC shifts the engineer's time away from manually cross-referencing separate charts and toward evaluating root-cause hypotheses that the system has already narrowed down. An engineer reviewing a flagged correlation group starts the investigation with three related characteristics and a shared time window already identified, rather than starting from a single isolated violation with no context about what else might be happening on the same part. For a walkthrough of how this changes daily workflow for your quality team, contact our support team.
Is multi-characteristic SPC only useful for high-complexity parts with many measurements?
While the benefit scales with part complexity, even a relatively simple part with two or three related characteristics — a bore and its mating press-fit force, for example — can benefit meaningfully from correlated monitoring, since the root-cause investigation time saved on even a single recurring issue often justifies the setup effort. Higher-complexity powertrain and driveline components with a dozen or more interrelated characteristics see the largest relative benefit, but the underlying capability applies broadly across automotive component types. For a specific ROI estimate based on your part complexity, book a demo with our team.
Stop Investigating the Same Root Cause Three Separate Times
See how iFactory correlates dimensional, torque, and force data on your own part family, and how much faster root-cause investigation becomes when the connection is visible from the start.