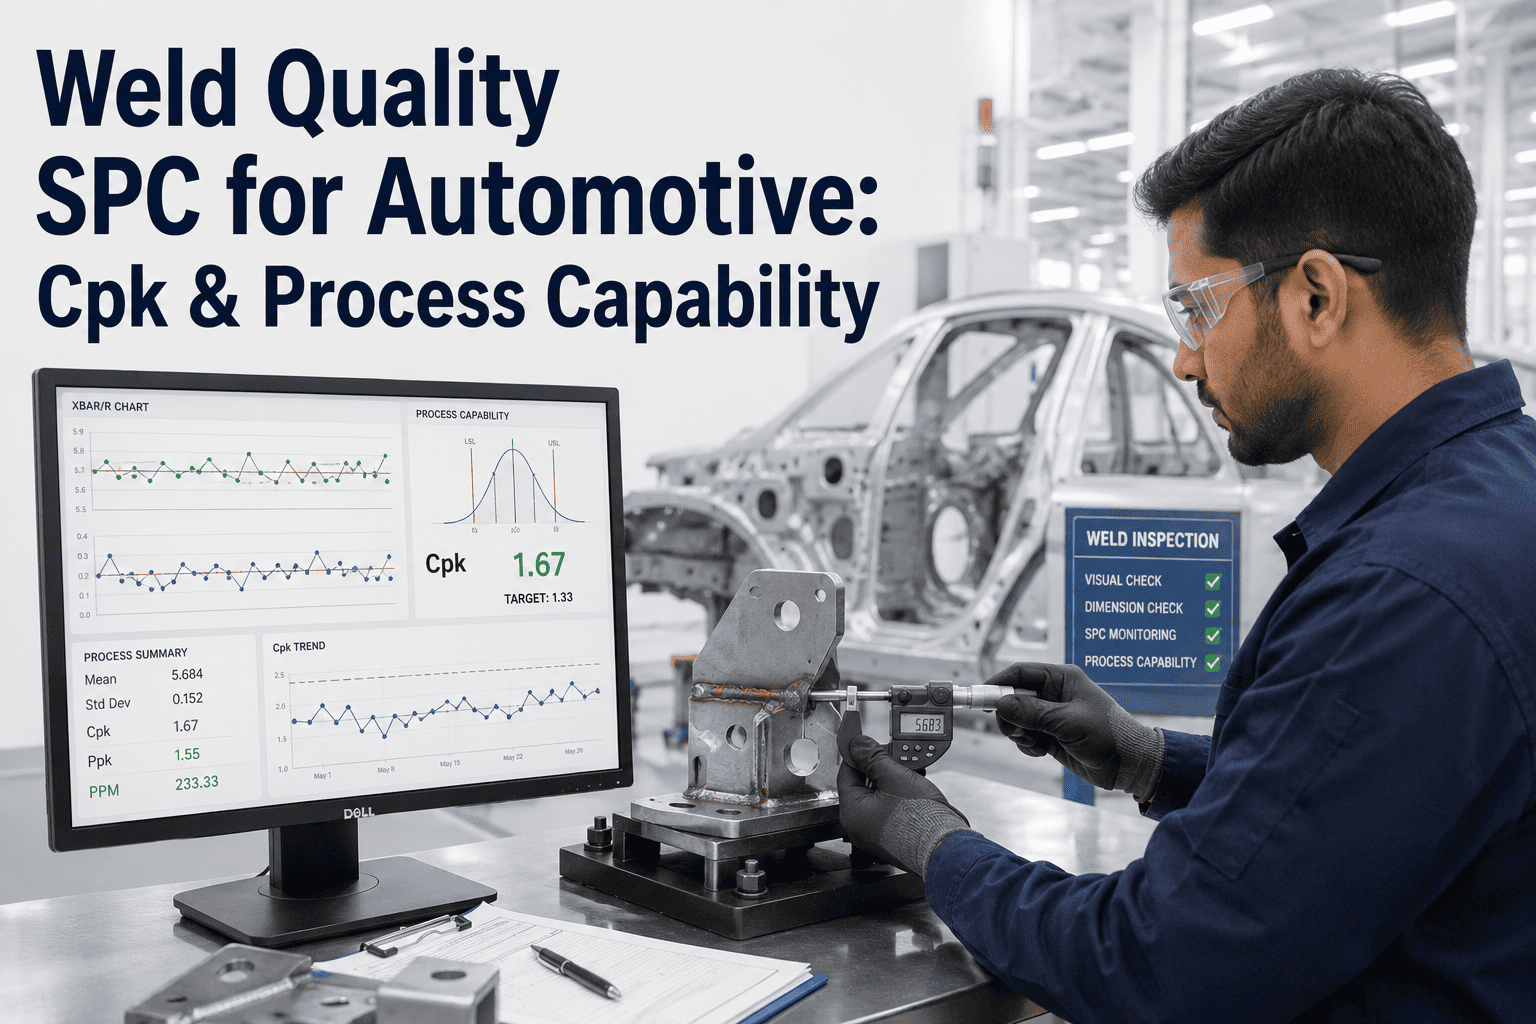
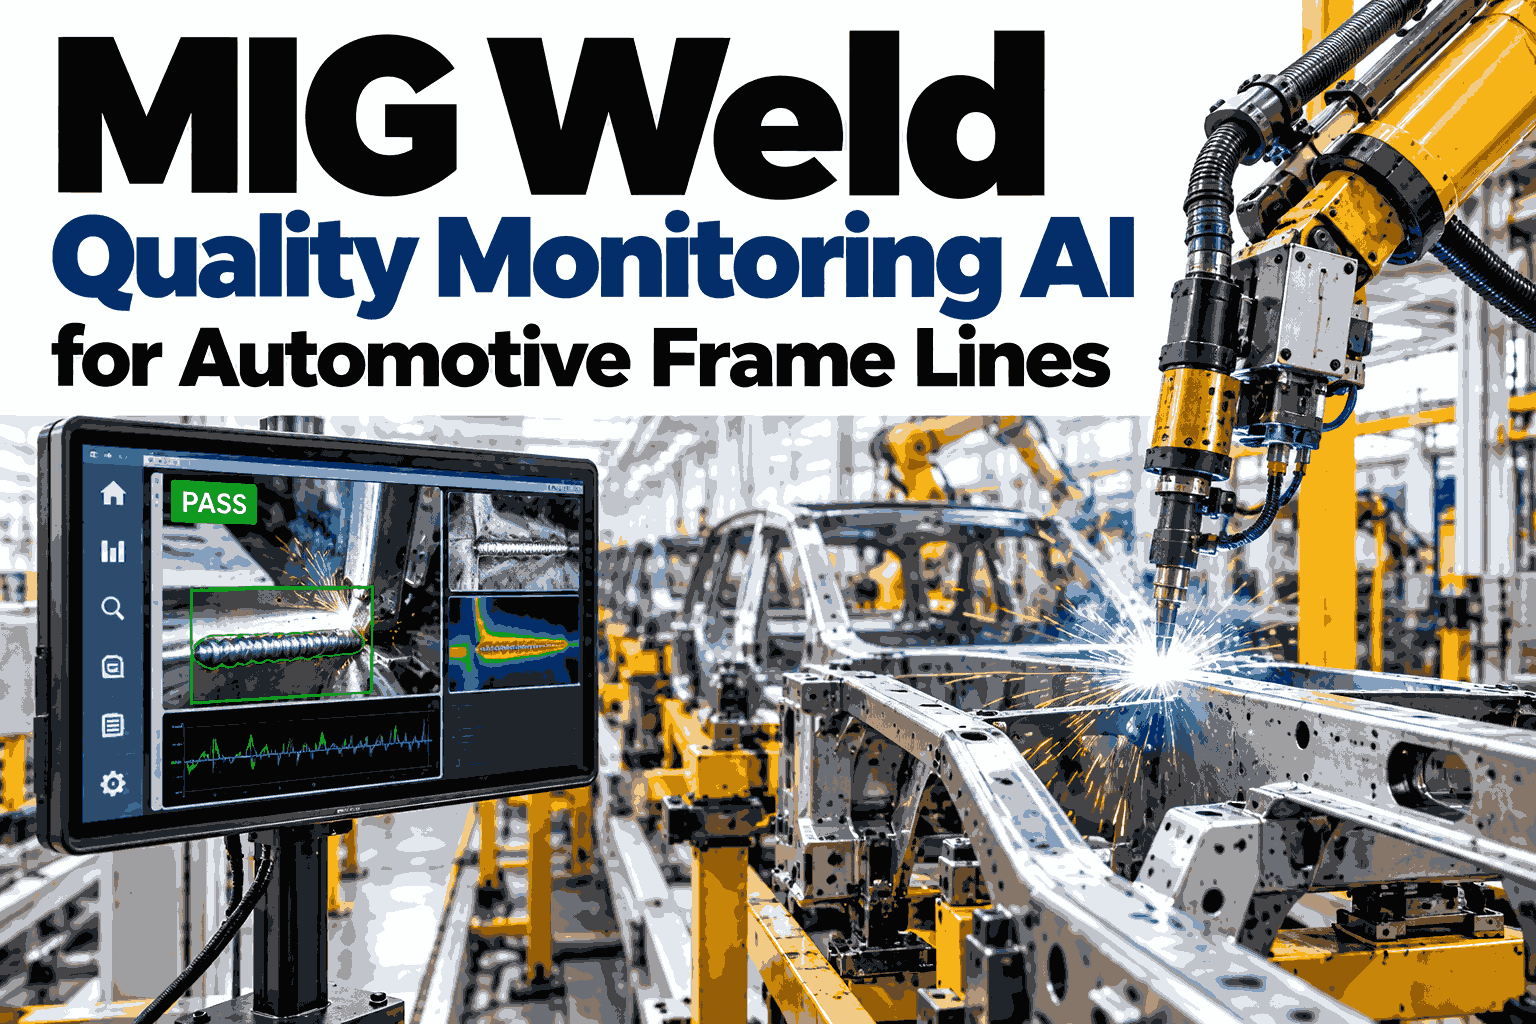
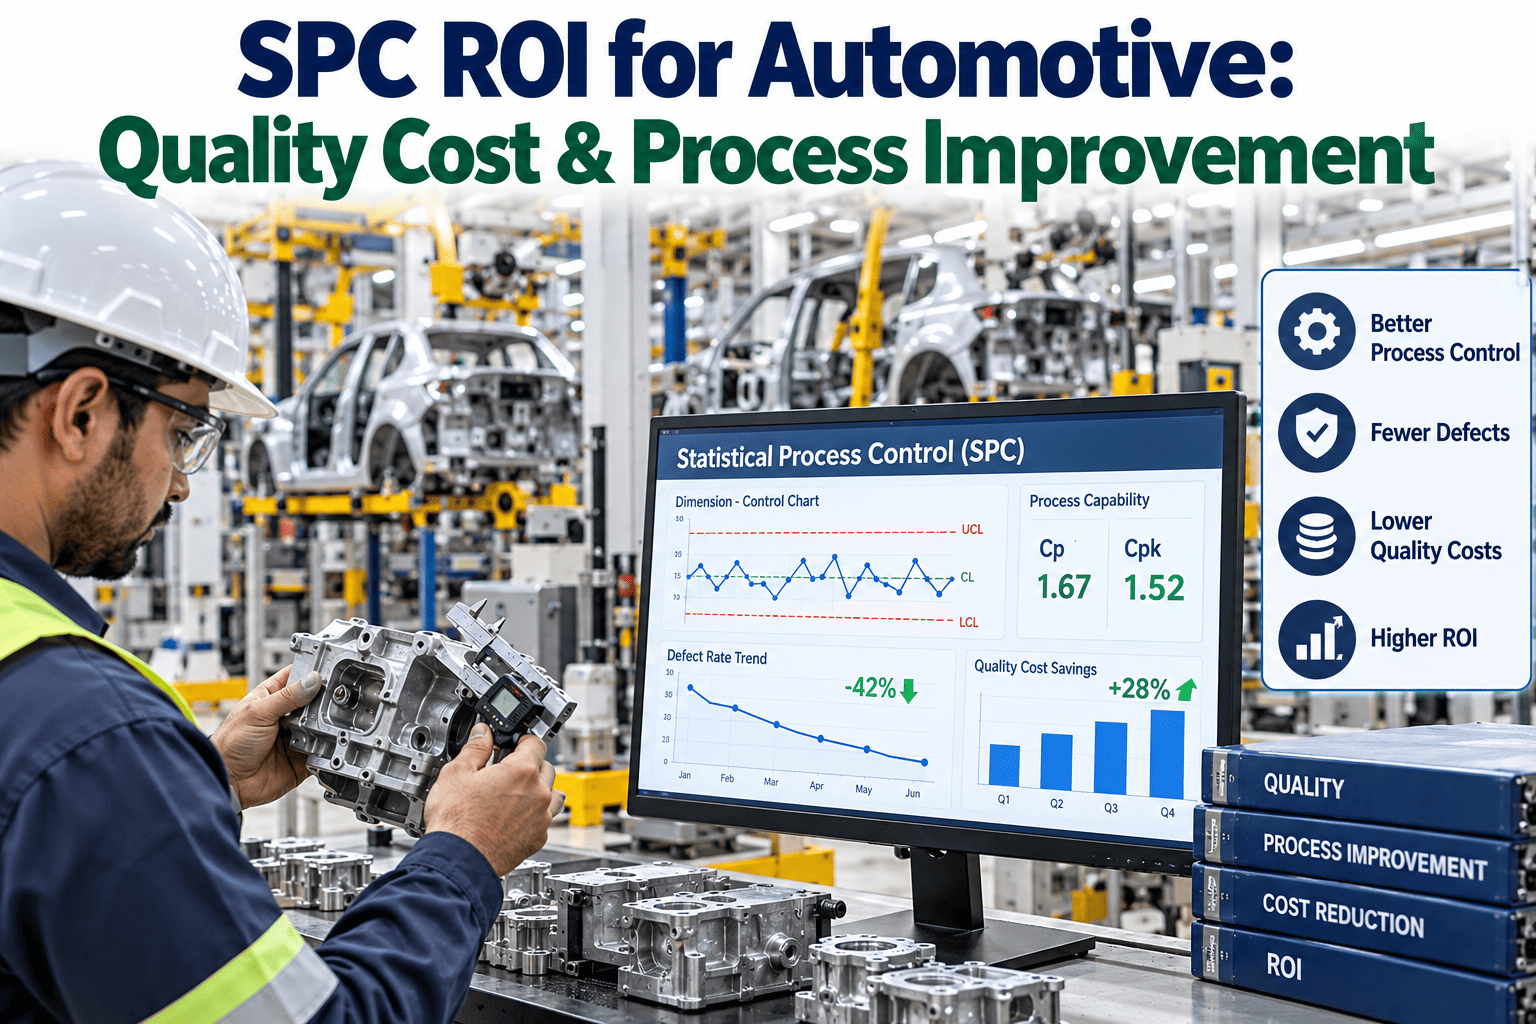
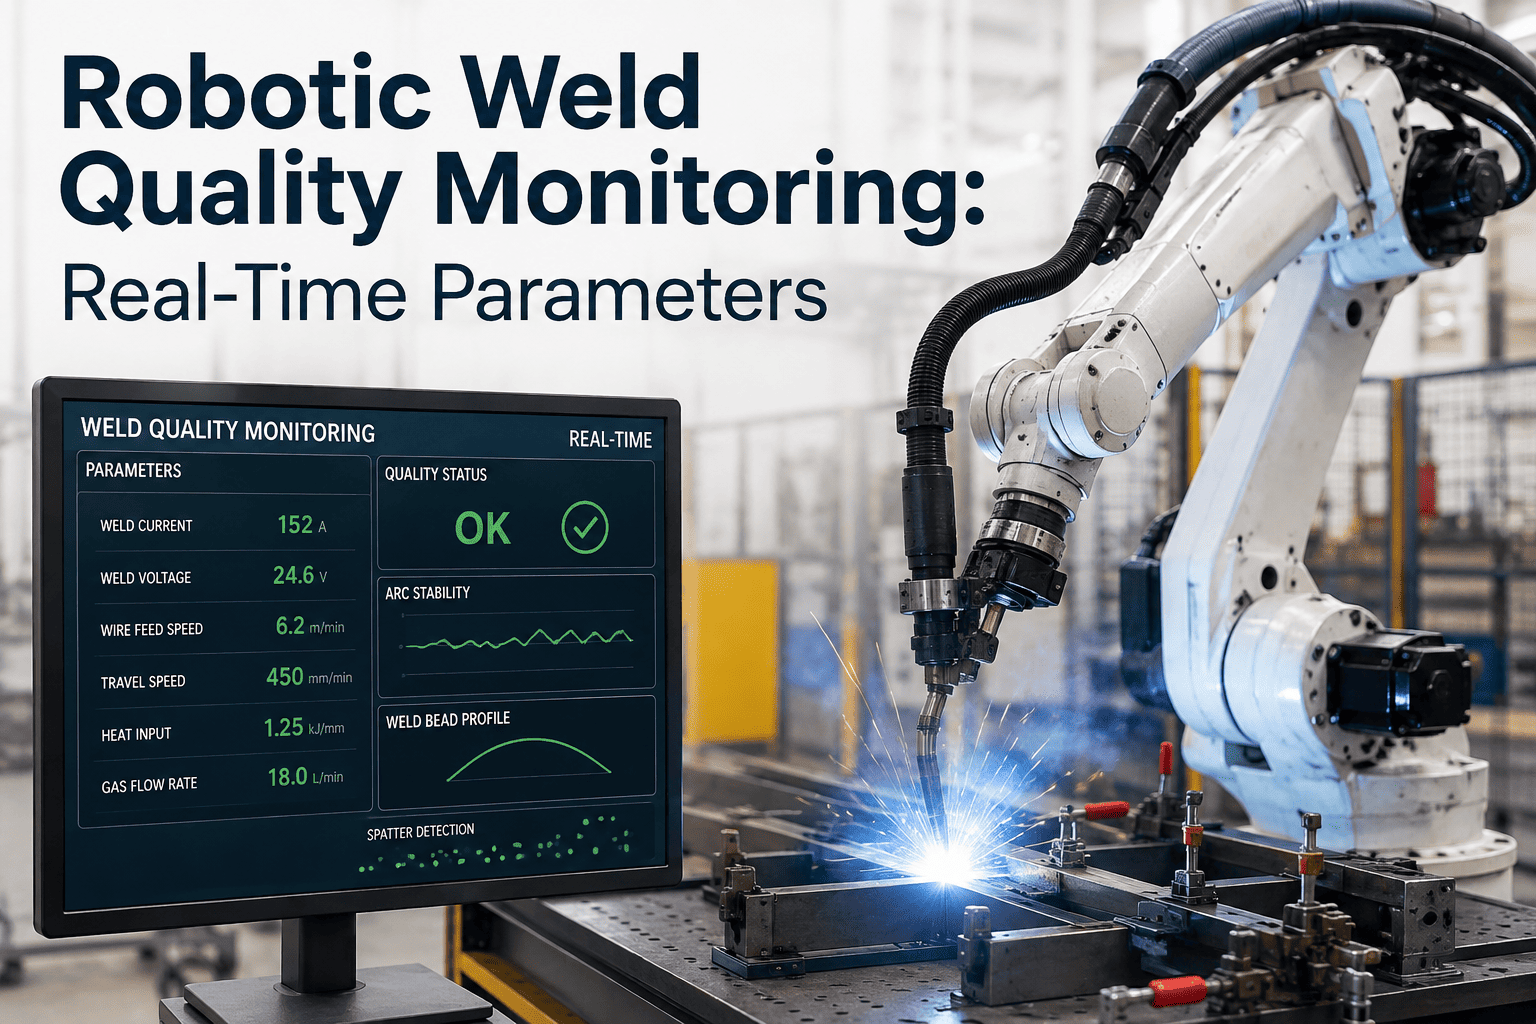
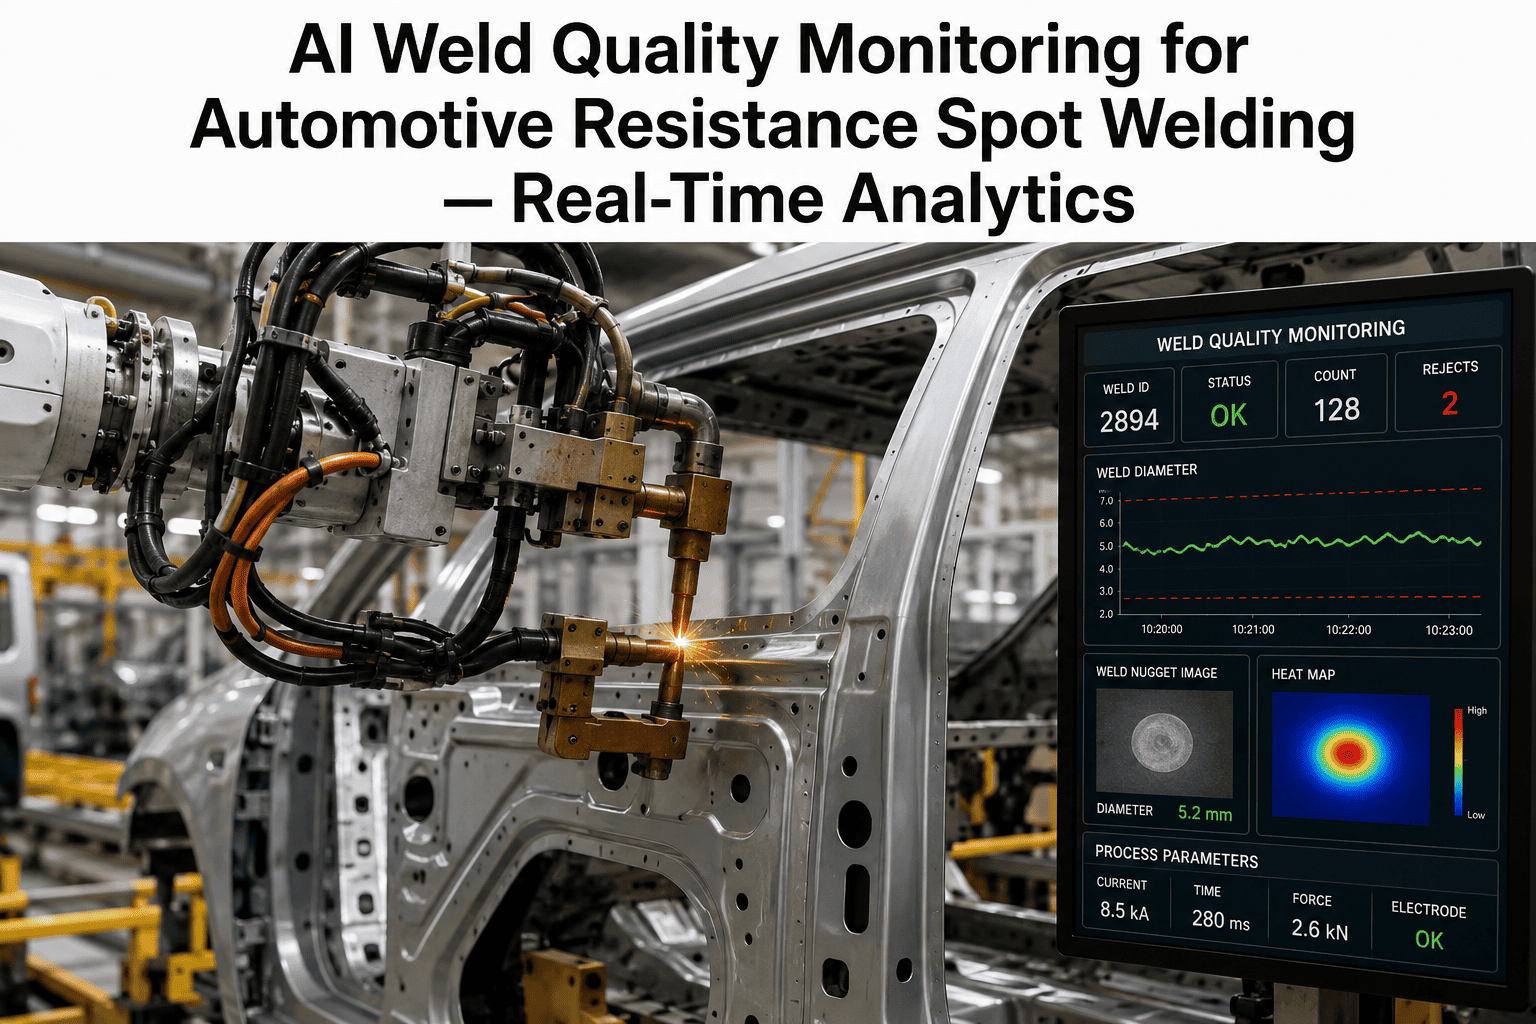
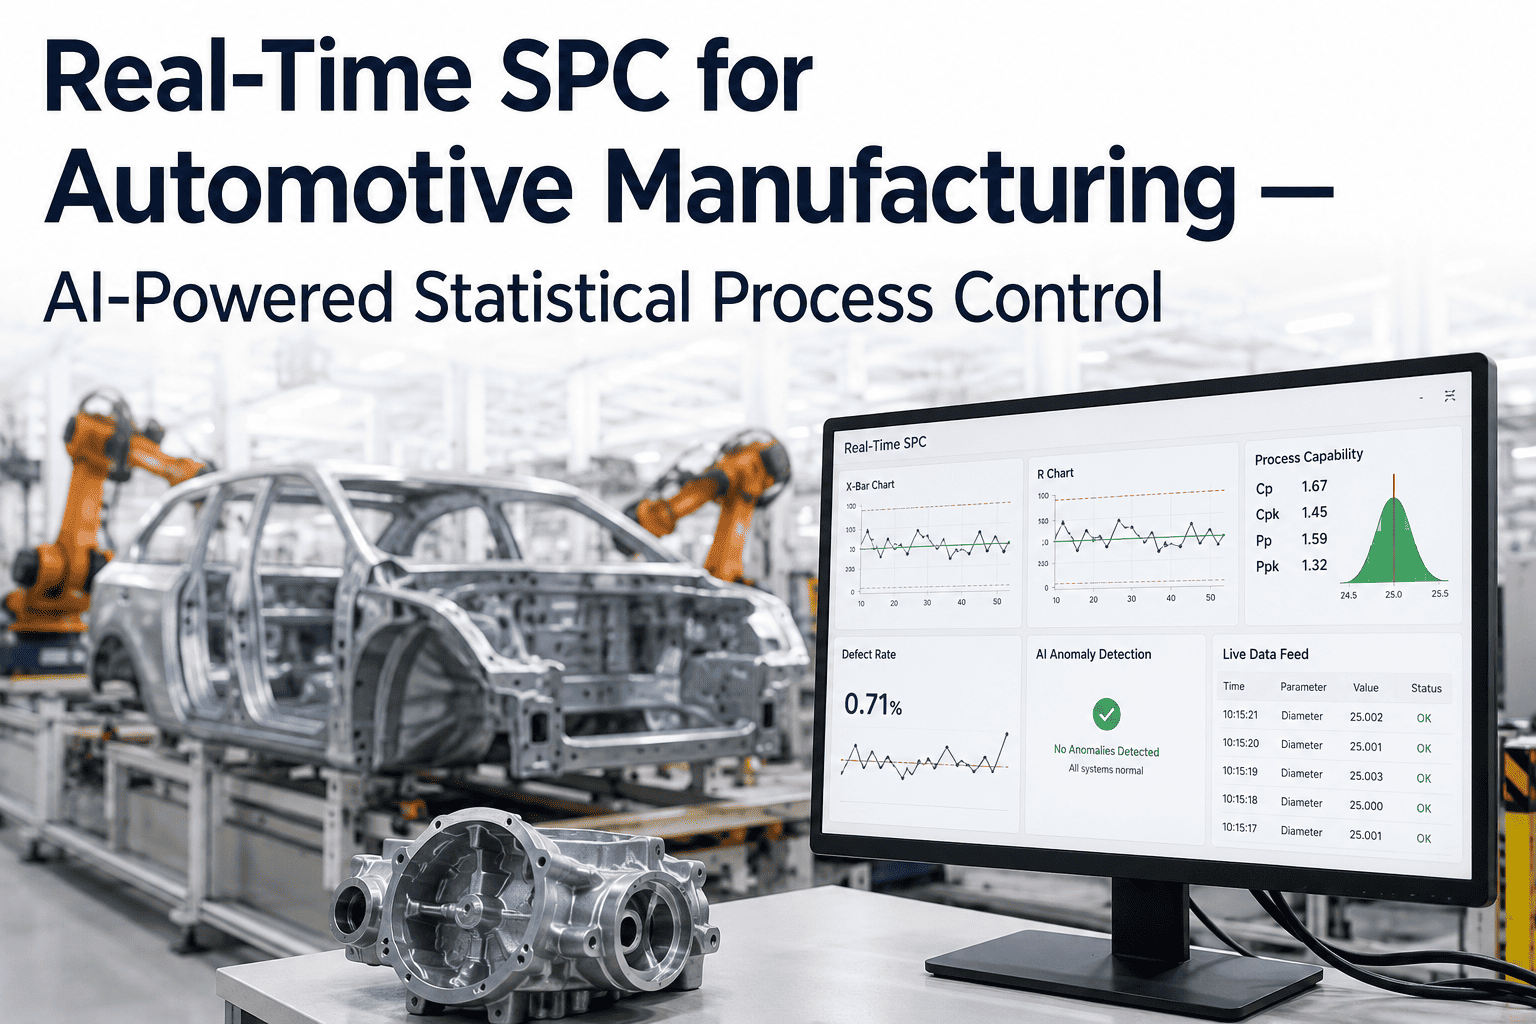
A resistance spot weld takes roughly 200 milliseconds to form, and a single body-in-white assembly can carry several thousand of them. Checking each one with a destructive peel test is not just impractical, it is physically impossible at that volume. Statistical process control exists precisely for this situation: instead of testing every weld, a plant monitors the process parameters that determine weld quality — current, force, dynamic resistance — and uses control charts and capability indices to prove the process itself stays within range. A Cpk below 1.33 is not just a quality concern in automotive welding, it is frequently a contractual and audit failure under CQI-11 and CQI-15. iFactory builds real-time SPC directly into weld monitoring, so Cpk isn't a report you run monthly, it's a live signal your team can act on. To see it running against your own weld parameter data, book a demo.
AUTOMOTIVE WELD INSPECTION · SPC · PROCESS CAPABILITY
Cpk Isn't a Report You Run Monthly, It's a Number That Should Never Stop Updating
iFactory calculates process capability in real time from live weld parameter data, flagging a drifting Cpk before it crosses the audit threshold, not after a CQI-11 review catches it.
WHY SAMPLING ISN'T ENOUGH
You Cannot Destructively Test Your Way to Confidence at This Volume
Weld quality has traditionally been verified through destructive testing — peel tests, chisel tests, tensile pulls — performed on a small sample pulled off the line periodically. This approach worked reasonably well when welding volumes were lower and the cost of under-sampling was tolerable. Neither of those conditions holds in a modern high-volume automotive body shop.
01
Destructive Tests Destroy the Part
A peel test consumes the very weld it verifies, which means testing every weld is not an option, only a sample can ever be checked this way.
02
Sampling Misses Between-Sample Drift
Electrode wear and current drift happen continuously, not in the discrete moments a sampling schedule happens to check, leaving gaps a sample-based plan cannot see.
03
A Passing Sample Doesn't Prove a Capable Process
A handful of good welds pulled from a sample can pass while the underlying process variation is too wide to reliably produce good welds outside that sample.
04
Audits Require Continuous Evidence, Not Snapshots
CQI-11 and CQI-15 audits expect SPC data with control limits derived from actual process capability, not periodic sample results treated as a stand-in for it.
None of this means destructive testing has no place, it remains the method that validates the correlation between process parameters and actual weld strength. What it cannot do on its own is provide continuous assurance across thousands of welds a shift, which is exactly the gap real-time SPC on process parameters is built to close.
THE PARAMETERS THAT MATTER
What Actually Gets Charted for Weld Process Control
Statistical process control for welding is only as good as the signal it monitors. For resistance spot welding specifically, a small set of process variables carries most of the information about whether a given weld will be structurally sound.
Welding Current
The primary driver of heat generation at the weld interface, monitored via X-bar and range charts across consecutive welds at each station.
Electrode Force
Insufficient clamping force alongside excess current is a leading cause of expulsion, so force and current are typically tracked together rather than in isolation.
Dynamic Resistance Curve
The resistance profile across the weld cycle is recognized as the most complete technological signature of the metallurgical development of a spot weld, capturing far more information than a single current or force reading alone.
Electrode Tip Condition
Tip wear changes the effective contact area and current density over time, producing a slow, predictable drift pattern that control charts are specifically designed to catch.
The dynamic resistance curve deserves particular attention because it is a functional signal, not a single number, meaning the whole shape of the curve across the weld cycle carries diagnostic information that a simple average current reading discards. Advanced SPC approaches increasingly treat the entire curve as the monitored signal rather than reducing it to a handful of summary statistics.
See your current Cpk calculated from your own weld data
iFactory reviews your existing weld parameter logs and shows you where your process capability actually stands against the CQI-11/CQI-15 benchmark.
READING THE NUMBER
What Cpk Actually Tells You, and Why 1.33 Is the Line
Cpk measures how well a process's actual variation fits inside its specification limits, accounting for how centered the process is, not just how wide its spread is. A process can have tight variation and still score poorly on Cpk if it is running off-center toward one specification limit.
| Cpk Value |
What It Means |
Typical Automotive Status |
| Below 1.00 |
Process variation exceeds specification limits regularly |
Unacceptable, immediate corrective action required |
| 1.00 – 1.32 |
Marginally capable, some parts near or outside limits |
Below the standard automotive threshold, at audit risk |
| 1.33 – 1.66 |
Generally accepted minimum capability for critical characteristics |
Meets the common Cpk ≥ 1.33 automotive requirement |
| 1.67 and above |
High capability with comfortable margin to specification limits |
Aligns with the Ppk ≥ 1.67 benchmark cited for world-class suppliers |
The distinction between Cpk and Ppk matters here too. Cpk is calculated from within-subgroup variation and reflects the process's short-term, inherent capability, while Ppk uses overall variation across the full dataset and reflects actual long-term performance including shifts and drifts between subgroups. A process can show a healthy Cpk while its Ppk reveals that real-world performance is drifting more than the short-term data alone would suggest, which is exactly why serious quality programs track both rather than either one in isolation.
CATCHING DRIFT EARLY
Western Electric Rules Flag a Problem Before a Control Limit Is Even Breached
A control chart's value is not limited to catching a point that falls outside its control limits. A set of pattern-detection rules, commonly known as the Western Electric rules, flags non-random patterns in the data that signal a process is drifting even while every individual point still sits within limits.
Six Points Trending in One Direction
A steady climb or decline across six consecutive points indicates a systematic shift, such as gradual electrode wear, well before any single point crosses a limit.
Two of Three Points Beyond Two Sigma
A cluster of points running unusually far from center, even inside the control limits, signals increased variation that deserves investigation.
Nine Points on One Side of Center
A sustained run above or below the process average, without a single point crossing back, indicates a shift in the process mean rather than ordinary random variation.
A Single Point Beyond Three Sigma
The classic out-of-control signal, but by the time this triggers, the pattern-based rules above have often already flagged the developing problem earlier.
Applying these rules automatically across every monitored parameter at every station is what turns SPC from a chart someone reviews periodically into a live detection system. iFactory applies this rule set continuously and routes a flagged trend directly to a prioritized maintenance work order with the specific asset, the parameter that drifted, and how far it has moved from its established baseline.
FROM CHART TO WORK ORDER
What Happens the Moment SPC Flags a Trend
A control chart that only produces a visual alert on a dashboard nobody is actively watching provides limited real protection. The value compounds once a flagged trend connects directly into the maintenance and quality workflow that acts on it.
Trend Detected
A Western Electric rule triggers on a specific station's current or force chart, identified automatically rather than caught by a periodic manual chart review.
Work Order Generated
A prioritized work order is created automatically with the specific asset, the drifted parameter, and how far it has moved from baseline already populated.
Technician Dispatched With Context
The assigned technician receives the SPC chart, relevant history, and a recommended corrective action rather than a bare instruction to investigate.
Correction Feeds Back Into the Record
Parts consumed, labor time, and the corrective action taken are logged, building a maintenance history that improves future capability analysis.
This closed loop is what separates SPC as a compliance artifact from SPC as an operating discipline. The audit-ready chart and the corrective maintenance action come from the same underlying data pipeline, rather than being reconstructed separately whenever an auditor or a customer asks to see it.
TURNKEY DELIVERY
How iFactory Builds Real-Time SPC Into Your Weld Process
Real-time capability tracking connects to the process parameters your welding equipment already generates, rather than requiring a separate offline testing regimen layered on top.
What Gets Built
Live X-bar/R and individuals charts on current, force, and resistance signature
Real-time Cpk and Ppk calculation per station, updated continuously
Automated Western Electric rule detection across every monitored parameter
Work order generation on flagged trends with full diagnostic context
Audit-ready SPC records aligned with CQI-11 and CQI-15 documentation requirements
Deployment Timeline
Weeks 1–4: Parameter data integration, control family definition, baseline capture
Weeks 5–8: Control limits established, capability validation against destructive test correlation
Weeks 9–12: Go-live, work order automation active, quality team training
FREQUENTLY ASKED QUESTIONS
What Quality Teams Ask About Weld SPC and Process Capability
Do we still need destructive testing if we implement real-time SPC on process parameters?
Yes, destructive testing remains necessary to establish and periodically validate the correlation between your monitored process parameters and actual weld strength, which is what gives the SPC data its meaning in the first place. What real-time SPC replaces is the idea that a small periodic sample can provide continuous assurance across thousands of welds a shift — destructive testing validates the relationship, SPC monitors it continuously once established.
Book a demo to review how this validation step fits into your specific process qualification.
What's the difference between Cpk and Ppk, and which one actually matters for an audit?
Cpk reflects short-term, within-subgroup process capability, while Ppk reflects overall performance across the full dataset including drift between subgroups over time, and both typically appear in an automotive audit rather than either one alone. A common automotive benchmark expects Cpk at or above 1.33 alongside Ppk at or above 1.67, since a process can look capable in the short term while its long-term performance tells a different story once drift is accounted for.
Contact our support team to review both indices calculated against your current weld data.
How is this different from just watching a control chart on a screen?
A control chart displayed on a screen only provides value if someone is actively watching it and correctly interprets a subtle pattern before it becomes a hard limit breach, which is difficult to guarantee across every station on every shift. Automating Western Electric rule detection and routing a flagged trend directly into a prioritized work order removes that dependency on continuous human monitoring, catching the same patterns a trained quality engineer would look for, consistently and immediately, at every station simultaneously.
Book a demo to see the automated detection and work order routing in action.
Does this help specifically with CQI-11 or CQI-15 audit preparation?
Yes, both audit standards expect SPC charts for critical welding parameters with control limits derived from actual process capability data, current calibration records, and documentation that is genuinely current rather than assembled shortly before an audit. Automated, continuously updated SPC records with capability indices calculated in real time directly address the SPC-related failure modes that most commonly cause CQI-11 and CQI-15 findings, since the evidence already exists in an audit-ready form rather than needing to be reconstructed under time pressure.
Contact our support team to map your current audit documentation gaps against this approach.
Our welding equipment is older — can it still generate the data this approach needs?
Most resistance welding controllers, even on older equipment, already generate current and force signals that can be captured through appropriate sensors and integration, and the dynamic resistance curve can often be derived from the same measurements without requiring a full controller replacement. The specific integration approach depends on your equipment's age and existing instrumentation, which is exactly what an initial assessment is designed to determine before committing to a deployment plan.
Book a demo to review integration feasibility for your specific welding equipment.
MAKE CPK A LIVE SIGNAL, NOT A MONTHLY REPORT
Catch Weld Process Drift Before It Becomes an Audit Finding
iFactory builds real-time SPC and capability tracking directly into your weld monitoring, connecting every flagged trend to a prioritized work order and an audit-ready record automatically.