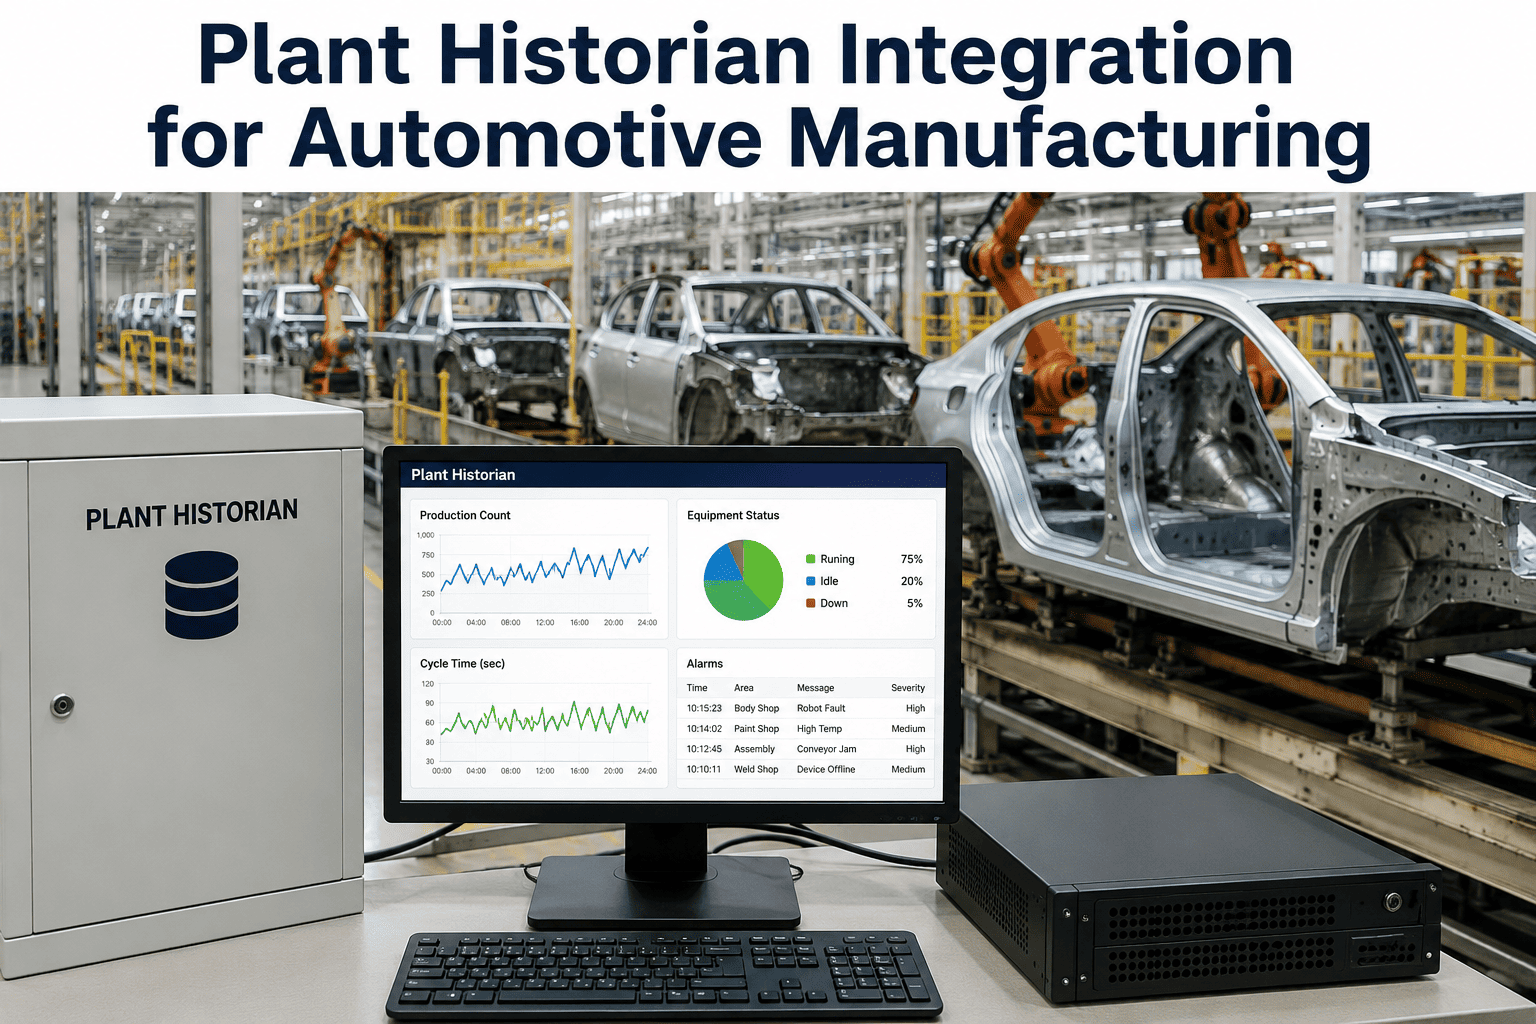
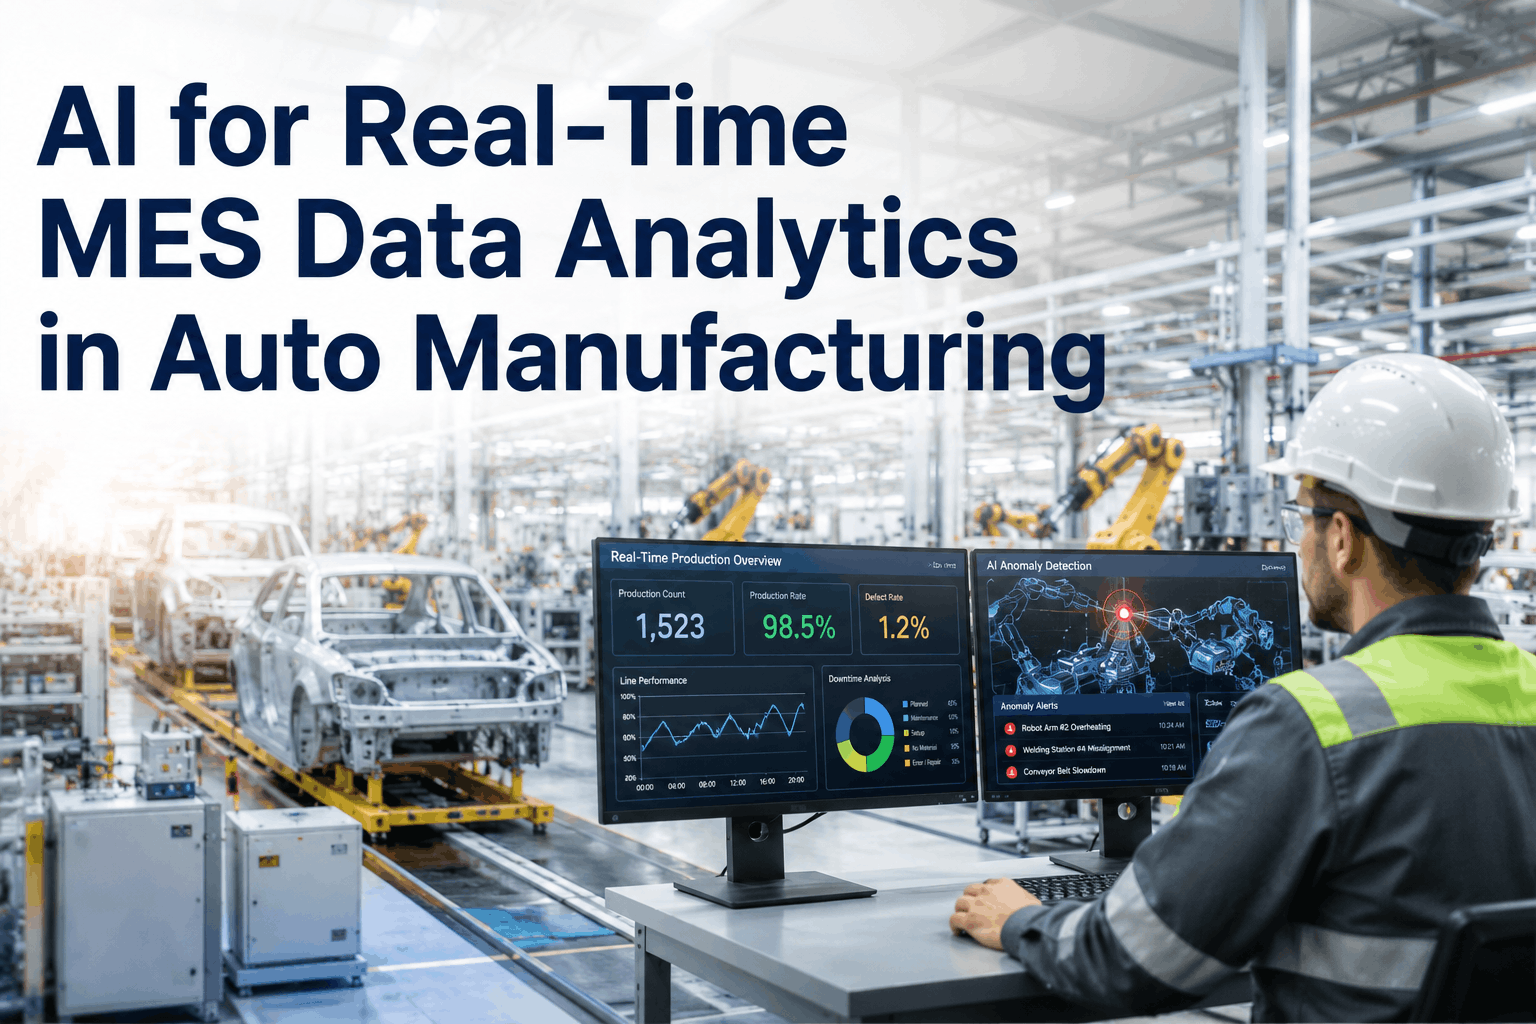
Most automotive plants have been writing to a process historian for a decade or more, tag by tag, shift by shift, until it holds millions of data points nobody has ever looked at twice. That archive sits there as a compliance artifact and an occasional troubleshooting reference, while the actual decisions on the floor still get made from a supervisor's memory of last Tuesday. The gap is not a lack of data, it is that nobody has time to query years of historian tags by hand, and you can book a demo to see AI sit directly on top of your existing historian and put that data to work.
PLANT HISTORIAN · AI INTEGRATION · OSI PI · SHIFT-LEVEL INSIGHT
Your Historian Already Holds the Answer — It Just Has No Way to Tell Anyone
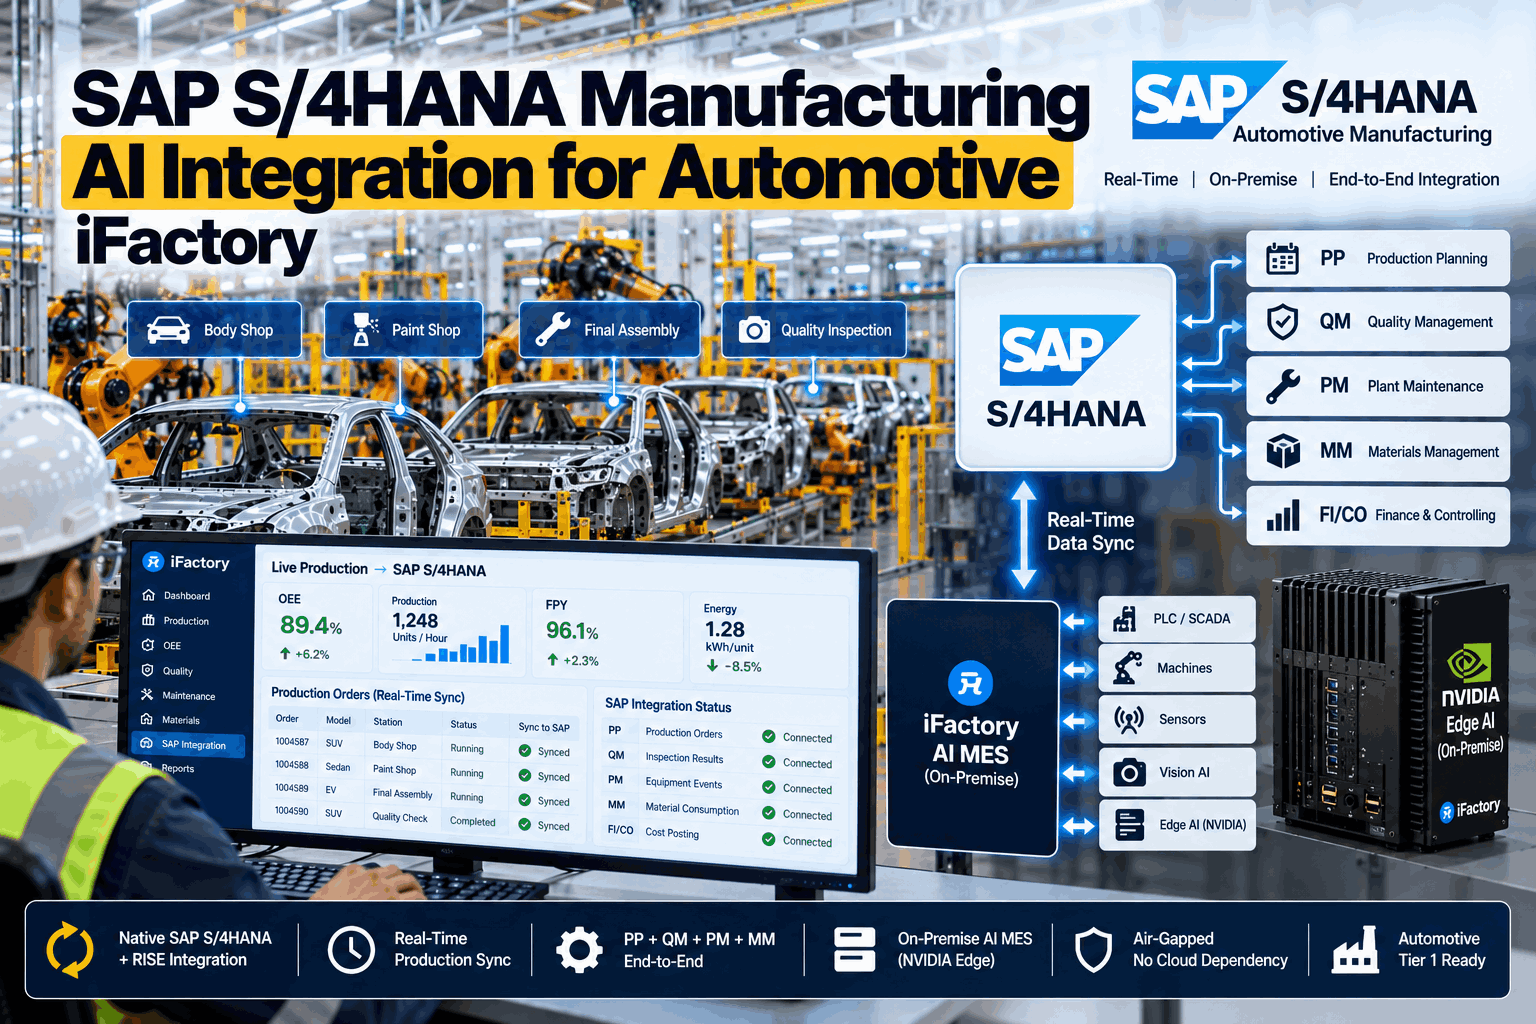
iFactory connects directly to your existing historian, whether OSI PI, Wonderware, or another platform, and turns years of stored tags into plain-language, shift-by-shift guidance for operators and engineers.
1
Historian
Years of tag data already being written every second
→
2
AI Layer
Pattern detection and context applied across every tag
→
3
Operator
Plain-language action delivered at the shift handoff
THE UNUSED-DATA PROBLEM
Years of Tag History Sitting Idle Because Nobody Has Time to Query It
A typical automotive plant historian holds thousands of tags updating every second across paint, body shop, and final assembly, which adds up to more raw process history than any team could review manually in a lifetime. The data was collected for a reason, usually compliance or troubleshooting after the fact, but it was never built to proactively tell an operator what to do differently on the next shift.
2,000+
Tags Per Line
Typical number of historian tags updating continuously across a single automotive production line
<5%
Tags Actively Reviewed
Rough share of stored historian tags that anyone actually queries or reviews in a typical month
Years
Of History Available
Typical depth of historical data most plants retain but rarely analyze across full production cycles
DASHBOARD VS AI-DRIVEN HISTORIAN
Why a Trend Chart Is Not the Same as an Instruction
Most historian client tools were built to draw a trend chart when someone asks for one, which is useful for troubleshooting after a problem has already happened, but it depends entirely on someone knowing which tag to query and when. An AI layer flips that relationship, watching every relevant tag continuously and surfacing the ones that matter before a shift begins rather than after a defect is already on the line.
Traditional Historian Dashboard
Requires someone to know which tag to query and when
Shows a trend chart, not a recommended action
Used mainly after a problem has already occurred
Insight depends on the reviewer's own experience level
AI Sitting on the Historian
Continuously watches every relevant tag across the line
Delivers a plain-language recommendation, not just a chart
Surfaces developing issues before they reach the line
Applies consistent pattern detection regardless of who is on shift
See Your Historian Turned Into Shift-Level Guidance
iFactory connects to your existing historian in place, with no rip-and-replace, and starts surfacing patterns within the first data pull.
WHAT THE AI DELIVERS
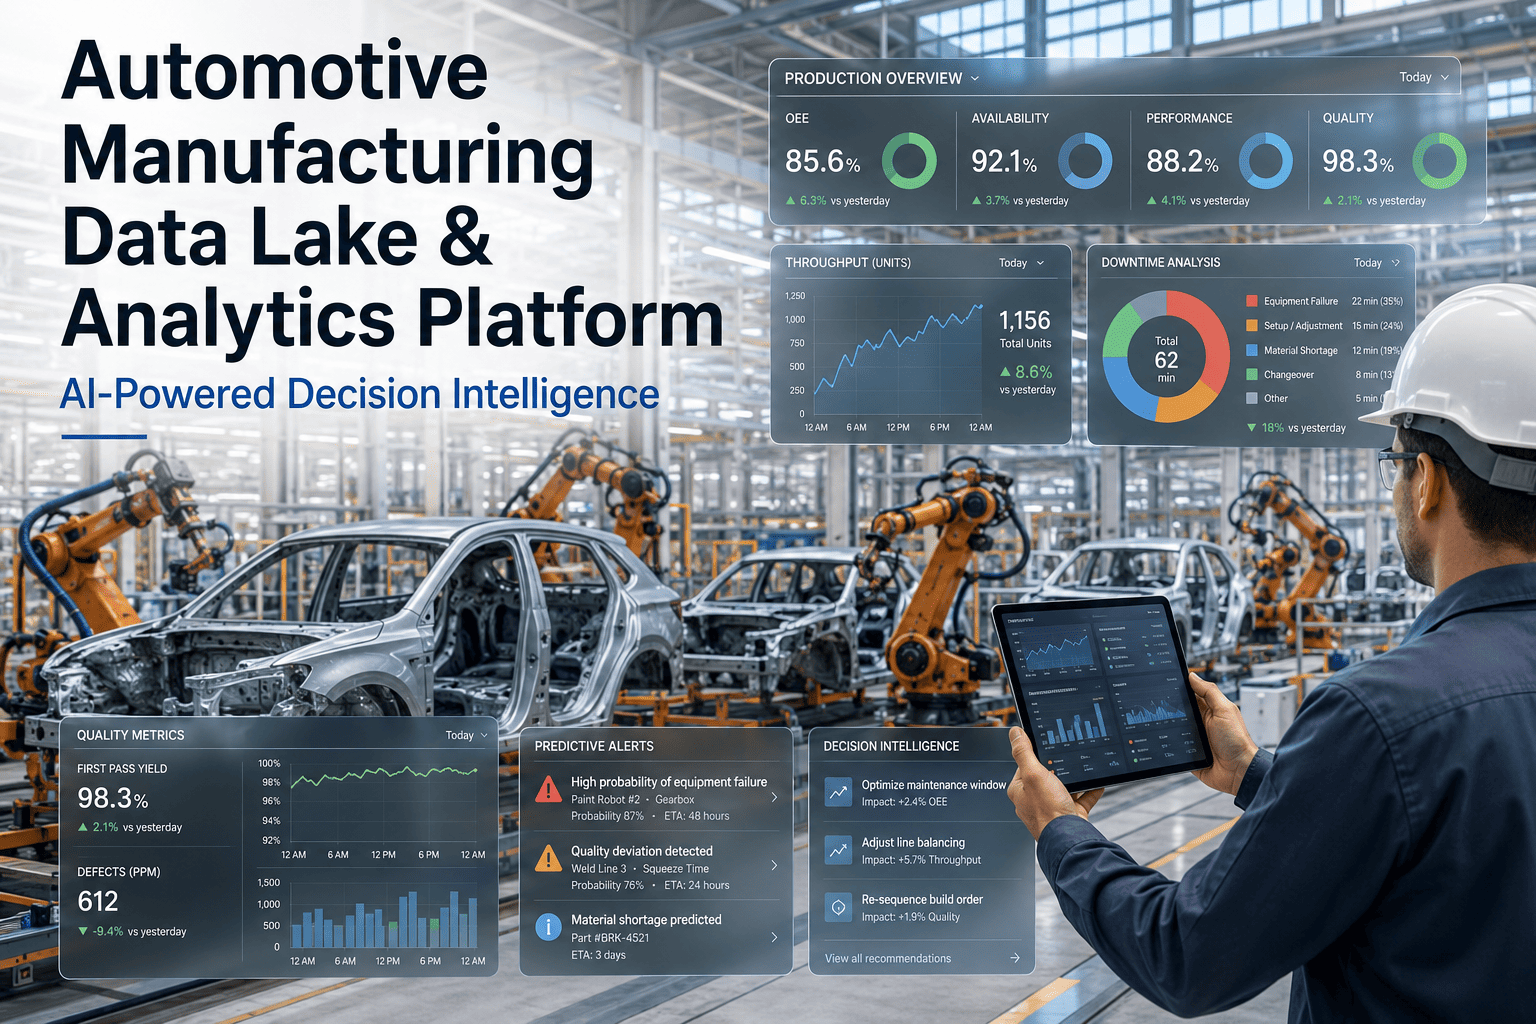
Turning Raw Tag History Into Guidance Operators Actually Use
Shift Handoff Summaries
A plain-language summary of what changed during the shift, generated automatically from the tags that moved outside their normal range, so the next shift starts informed instead of guessing.
Cross-Tag Correlation
Patterns spanning multiple tags, such as a paint booth humidity drift correlating with a downstream defect rate, are surfaced automatically instead of requiring an engineer to cross-reference charts manually.
Early Drift Detection
Tags trending toward an out-of-spec condition are flagged well before they cross the alarm threshold, giving operators time to intervene rather than react.
Natural-Language Query
Engineers can ask a plain question about historian data and get an answer drawn from the full tag history, without needing to build a query in the historian client first.
HISTORIAN COMPATIBILITY
Integration Approach by Historian Platform
| Historian Platform |
Integration Method |
Typical Setup Time |
| OSI PI |
Direct PI Web API connection |
1-2 weeks |
| Wonderware Historian |
Native SQL and OLE DB access |
1-2 weeks |
| GE Proficy Historian |
Historian API connector |
2-3 weeks |
| Custom or legacy historian |
Assessed case by case |
Varies by system |
MEASURED RESULTS
Outcomes Reported After Layering AI Onto an Existing Historian
4.6x
More historian tags actively reviewed on a weekly basis after AI-driven summaries were introduced
28%
Faster time to identify the root cause of a recurring quality issue
19%
Fewer defects traced back to a drift that had gone unnoticed for multiple shifts
2 weeks
Typical time from historian connection to the first useful shift summary
GETTING STARTED
Connecting to Your Historian Without Disrupting What Already Works
Step 1
Connect Read-Only
The platform connects to your historian in a read-only capacity, so nothing about your existing data collection or archiving changes.
Step 2
Map Tags to Context
Tags are mapped to the lines, stations, and processes they represent, so recommendations reference the floor in terms operators already use.
Step 3
Establish Baselines
The AI learns normal operating ranges for each tag from historical data before it starts flagging deviations, reducing false alerts from day one.
Step 4
Deliver Shift Summaries
Plain-language summaries and alerts begin reaching operators and engineers at shift handoff, with detail depth tuned to each role.
FREQUENTLY ASKED QUESTIONS
Questions Plant Teams Ask About Historian AI Integration
Do we need to migrate our historian data to a new platform for this to work?
No, the platform connects to your historian exactly where it already sits, whether that is OSI PI, Wonderware, or another system, and reads tag data through the historian's own supported interfaces rather than requiring a migration. Your existing data collection, archiving, and retention policies continue exactly as they are today, since the AI layer is additive rather than a replacement for the historian itself.
Book a demo to see the connection method for your specific historian platform.
How far back into our historical data does the AI actually look?
The baseline learning phase typically draws on as much historical data as your historian has retained, since more history generally produces a more accurate picture of what normal operation actually looks like across seasons, shifts, and product changeovers. For plants with many years of retained tag history, that depth becomes a real advantage rather than a burden, because patterns invisible in a single month often become clear across several years.
Contact support to discuss how much history your setup can draw on.
Will this add load to our historian server that could slow down existing queries?
Queries are scheduled and rate-limited to stay well within the historian's normal capacity, and most integrations pull data on a batch schedule rather than constant polling, so existing dashboards and reports continue running without noticeable impact. The assessment phase includes a load review specific to your historian server before any ongoing connection is finalized.
Book a demo to review expected load for your server configuration.
Can engineers still use their existing historian client tools alongside this?
Yes, nothing about your existing historian client access changes, and engineers who prefer to build their own trend queries can continue doing so exactly as before. The AI layer runs alongside that existing workflow, adding proactive summaries and natural-language query on top rather than requiring anyone to abandon tools they already know well.
Contact support to see how the two tools coexist in daily use.
How does the system decide which tags actually matter enough to surface?
Tags are prioritized by a combination of how far they deviate from their learned baseline and how strongly they have historically correlated with downstream quality or downtime events, so the summaries surface the handful of signals most likely to matter rather than an overwhelming list of every tag that moved slightly. Engineers can also adjust which processes and tag groups receive the most attention based on current priorities on the floor.
Book a demo to see a sample summary from a comparable production line.
Stop Letting Years of Historian Data Sit Unused
iFactory connects to your existing historian and turns stored tag history into guidance your team actually acts on every shift.